
✔️ 웹 데이터 분석 5~6
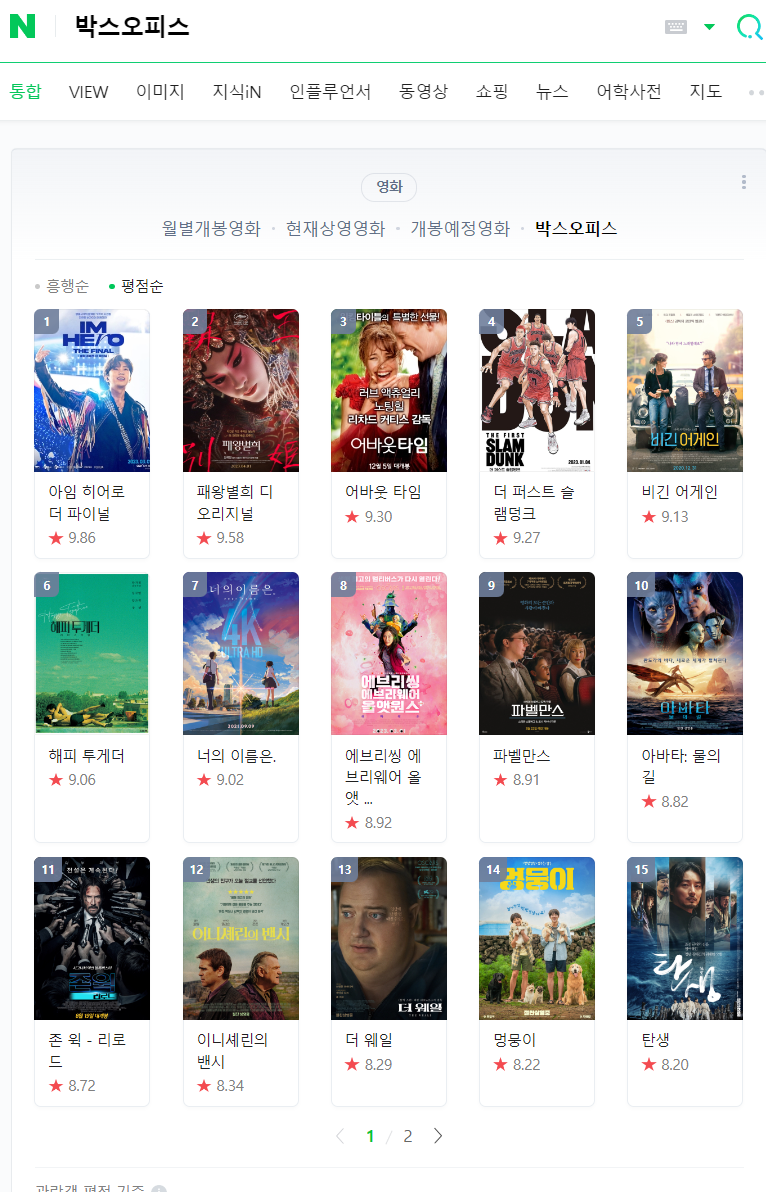
※ 현재 3월 31일자로 네이버 영화 평점 사이트가 종료된 관계로 수업 내용과 유사하게 따라해 보겠음.1. 네이버 영화 평점 검색 화면 분석
# requirements

import pandas as pd
from urllib.request import urlopen, Request
from bs4 import BeautifulSoup
url = 'https://search.naver.com/search.naver?where=nexearch&sm=top_hty&fbm=0&ie=utf8&query=%EC%98%81%ED%99%94+%ED%8F%89%EC%A0%90+%EC%88%9C%EC%9C%84'
response = urlopen(url)
# response.status
soup = BeautifulSoup(response, 'html.parser')- 영화 제목 태그 불러오기
soup.find_all('div',{'class':'_panel_rating _tab_content'})[0].find_all('strong','name')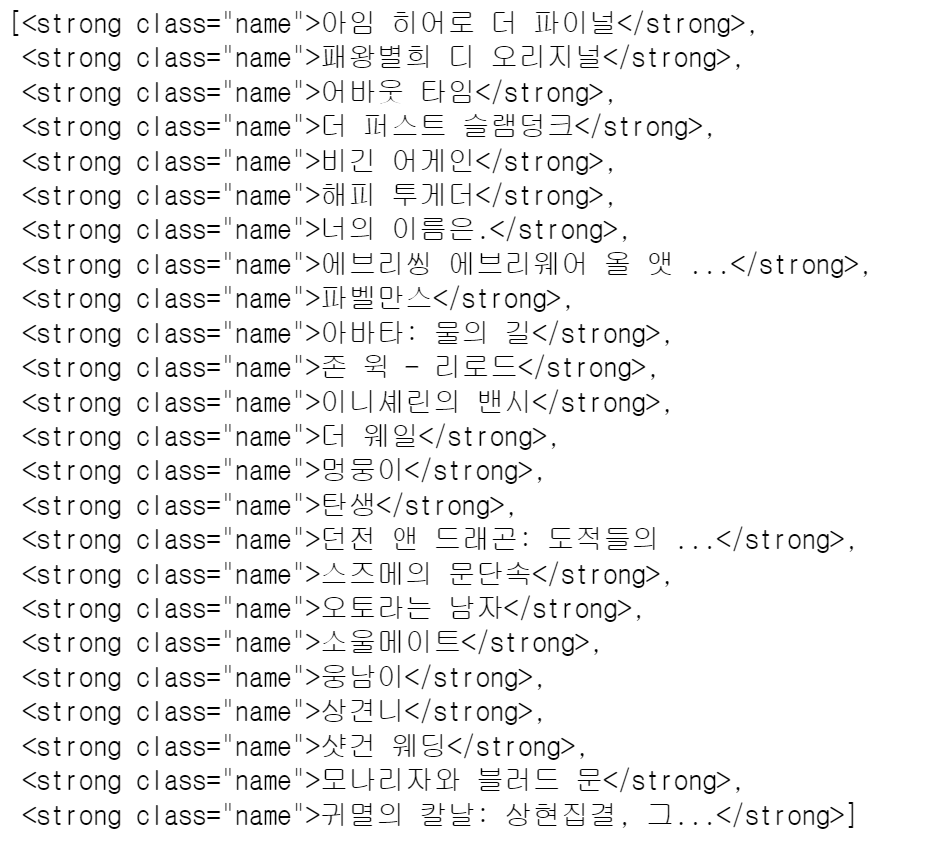
- 영화 평점 태그 불러오기
soup.find_all('div', class_='_panel_rating _tab_content')[0].find_all('span','sub_text')
# soup.find_all('div',{'class':'_panel_rating _tab_content'})[0].select('.sub_text')[0].text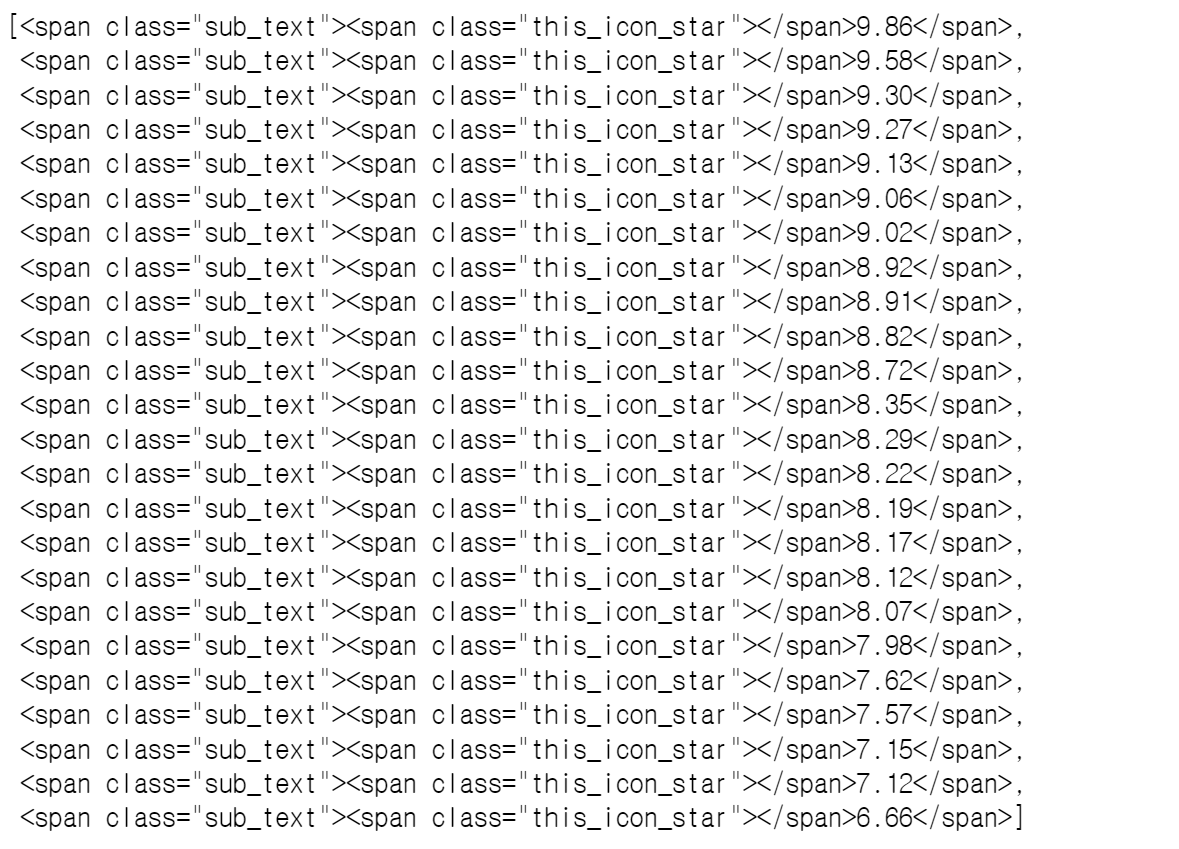
- 영화 제목 및 평점 리스트 생성
end = len(soup.find_all('div',{'class':'_panel_rating _tab_content'})[0].find_all('div','title_box'))

# 영화 제목 리스트
movie_name = [soup.find_all('div', class_='_panel_rating _tab_content')[0].find_all('strong','name')[n].string for n in range(end)]

# 영화 평점 리스트
movie_point = [soup.find_all('div',{'class':'_panel_rating _tab_content'})[0].find_all('span','sub_text')[n].text for n in range(end)]
# 전체 데이터 수 확인
len(movie_name), len(movie_point)
# (24, 24)2. 자동화를 위한 코드
※ 본 예제에서는 일자별 영화 평점 순위를 크롤링하여 데이터 프레임으로 생성하는 파트이지만,
일자별 데이터가 없으므로 검색한 날짜를 기준으로 하루 데이터를 이용하여 데이터 프레임 생성- 날짜 데이터 포맷 형식 참고
date = pd.date_range('2021.01.01', periods=100, freq='D')
print(date)		# DatetimeIndex(['2021-01-01', '2021-01-02', '2021-01-03', ··· , '2021-04-10'], dtype='datetime64[ns]', freq='D')

print(date[0])		# Timestamp('2021-01-01 00:00:00', freq='D')
print(date[0].strftime('%Y-%m-%d'))		# '2021-01-01'
print(date[0].strftime('%Y.%m.%d'))		# '2021.01.01'

# 문자열 format
test_string = "Hi, I'm {name}"
print(test_string.format(name='Zerobase')) # "Hi, I'm Zerobase"- 데이터 프레임 생성
import time
movie_date = [time.strftime('%Y%m%d') for i in range(end)]

movie = pd.DataFrame({
    'date': movie_date,
    'name': movie_name,
    'point': movie_point
})
movie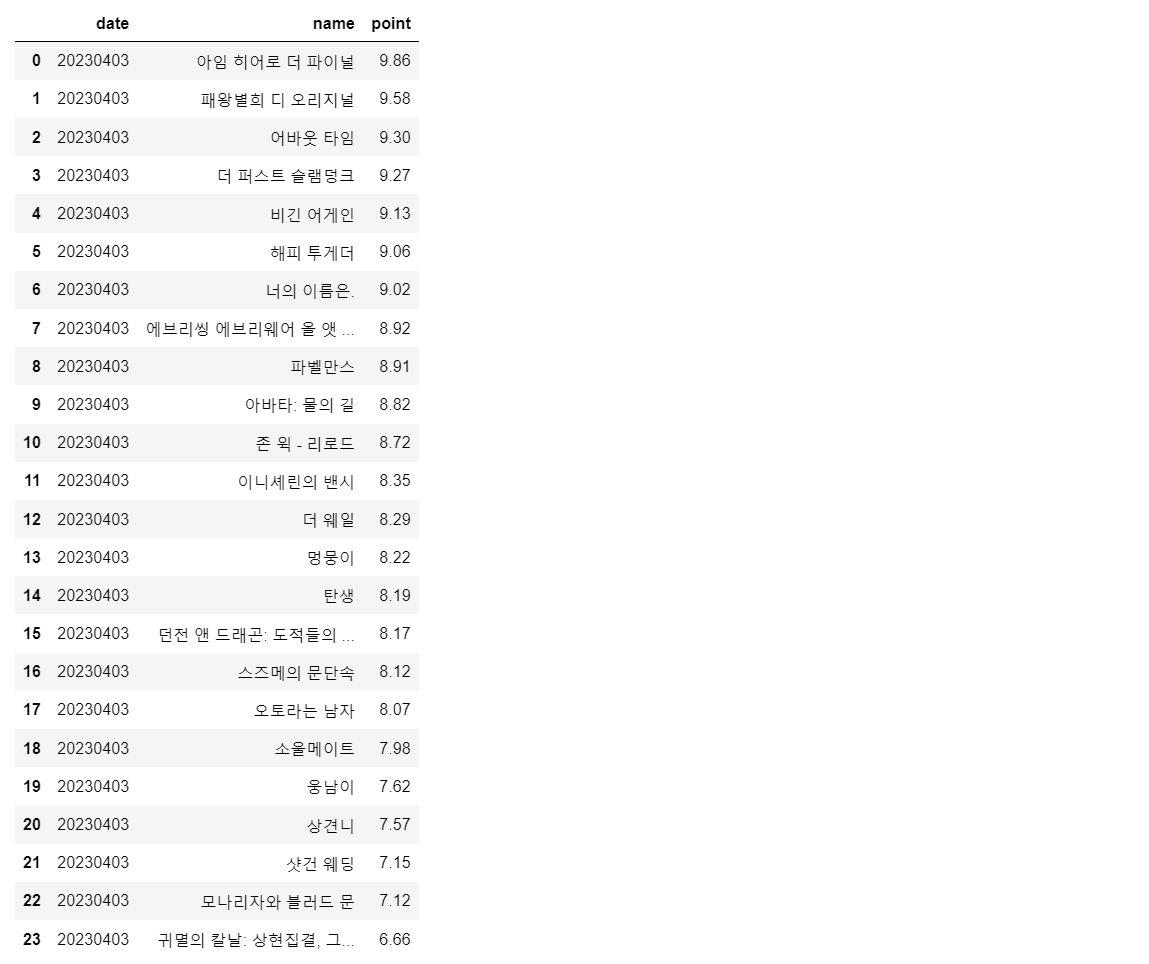
- 데이터 타입 변경 ('object' → 'date', 'float')
movie['date'] = movie['date'].astype(date)
movie['point'] = movie['point'].astype(float)

movie.info()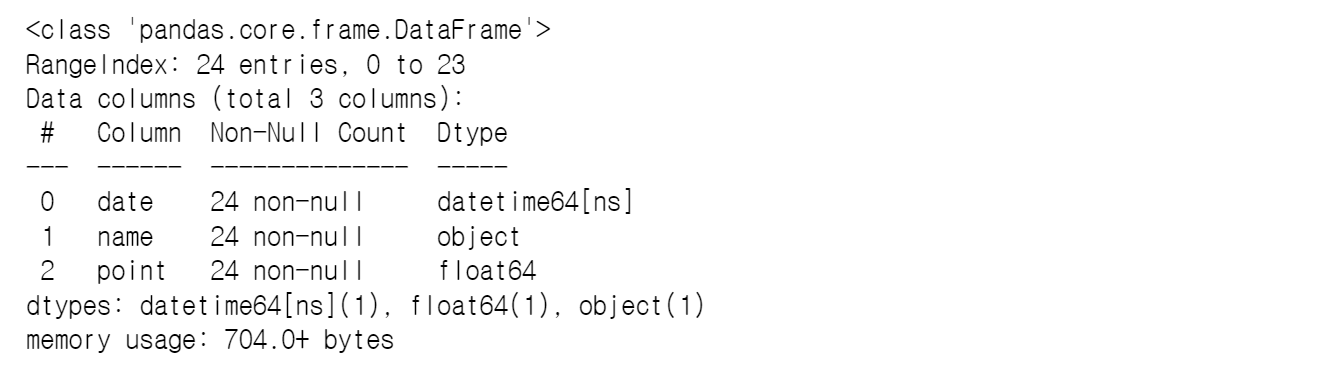
3. 영화 평점 데이터 정리
※ 지금부터는 앞서 추출한 데이터가 아닌 제공받은 데이터(100일간의 영화 평점순위 데이터)로 실습을 진행해보겠음.- 영화 이름으로 인덱스를 설정한 후,
- 점수의 합산을 구하고,
- 100일 간 네이버 영화 평점 합산 기준 베스트 & 워스트 10 선정
import numpy as np
import pandas as pd

import matplotlib
matplotlib.rcParams['axes.unicode_minus'] = False

movie = pd.read_csv('../data/04_naver_movie_raw_data.csv', index_col=0)
movie.tail()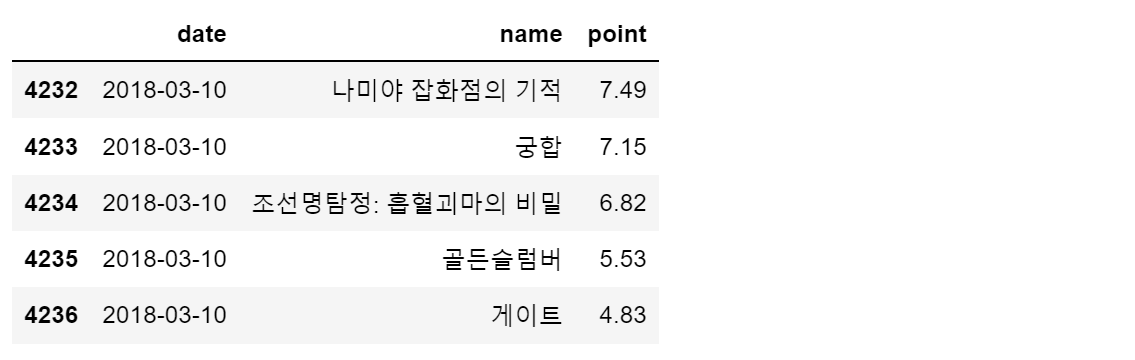
- pivot table
movie_unique = pd.pivot_table(data = movie, index='name', aggfunc=np.sum)
movie_unique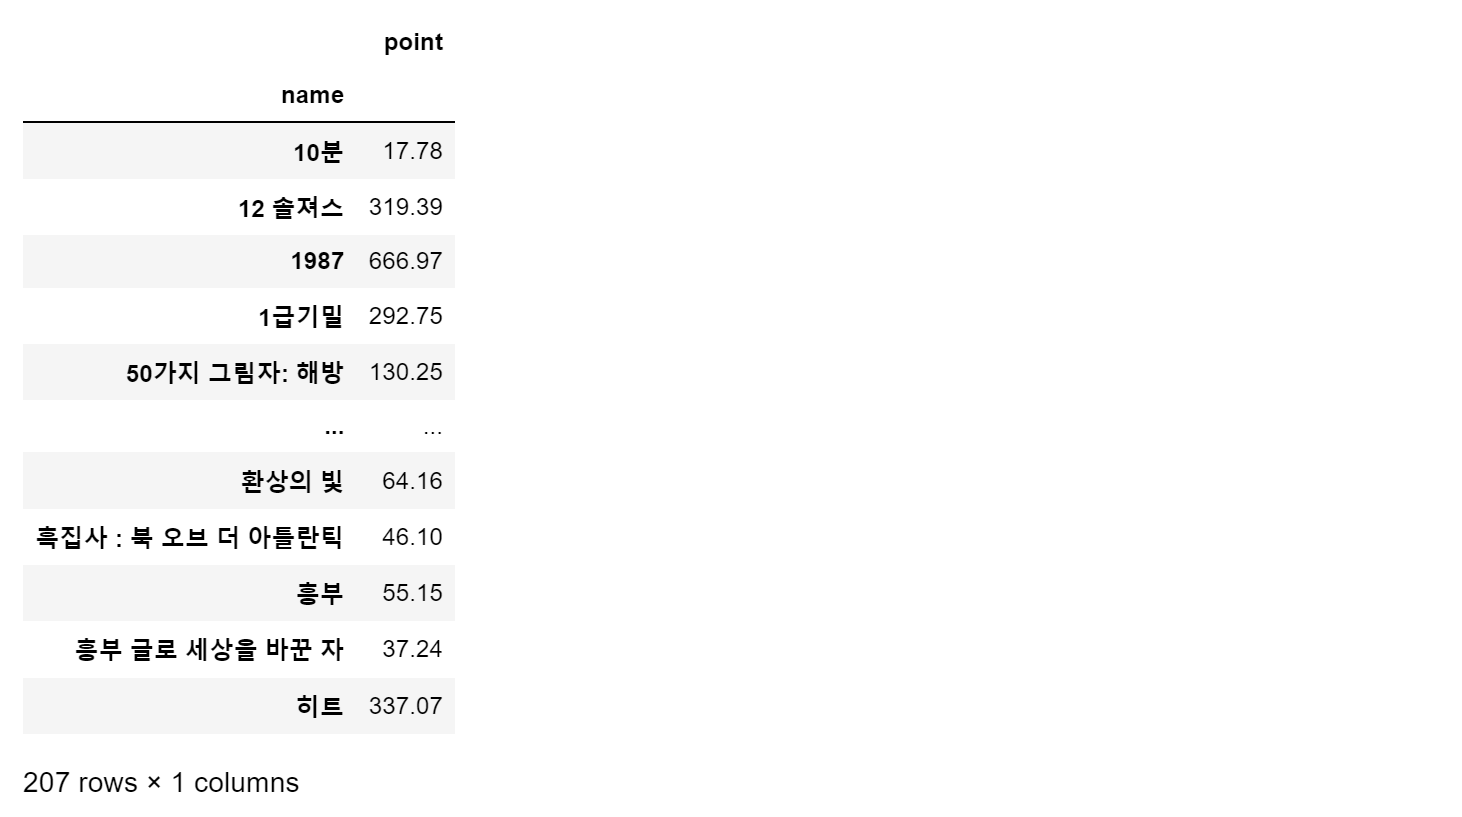
- 합산 기준으로 재정렬
movie_best = movie_unique.sort_values(by='point', ascending=False)
movie_best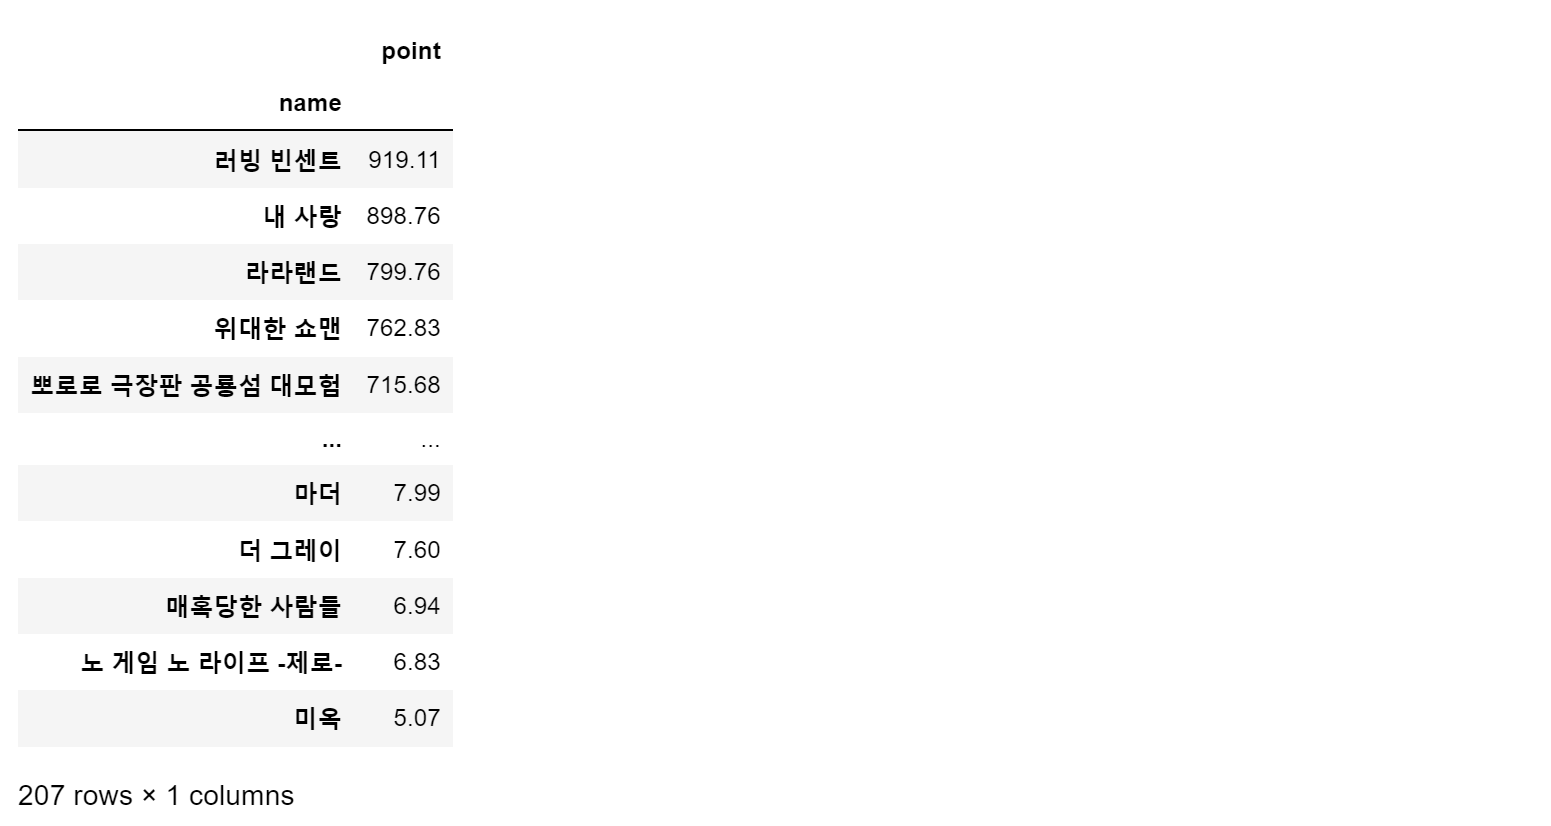
- 시각화
import matplotlib.pyplot as plt
from matplotlib import rc
rc('font', family='Malgun Gothic')
%matplotlib inline- 하나의 영화로 시각화 해보기
tmp = movie.query('name == ["50가지 그림자: 해방"]')

plt.figure(figsize=(20, 8))
plt.plot(tmp['date'], tmp['point']) # 선그래프 x축 날짜, Y축 평점 -> 날짜에 따른 평점 변화를 선그래프로 표현(시계열)
plt.title('날짜별 평점')
plt.xlabel('평점')
plt.ylabel('날짜')
plt.xticks(rotation='vertical') # x축 라벨 수직으로 변경
plt.legend(labels=['평점 추이'], loc='best')
plt.grid(True)
plt.show()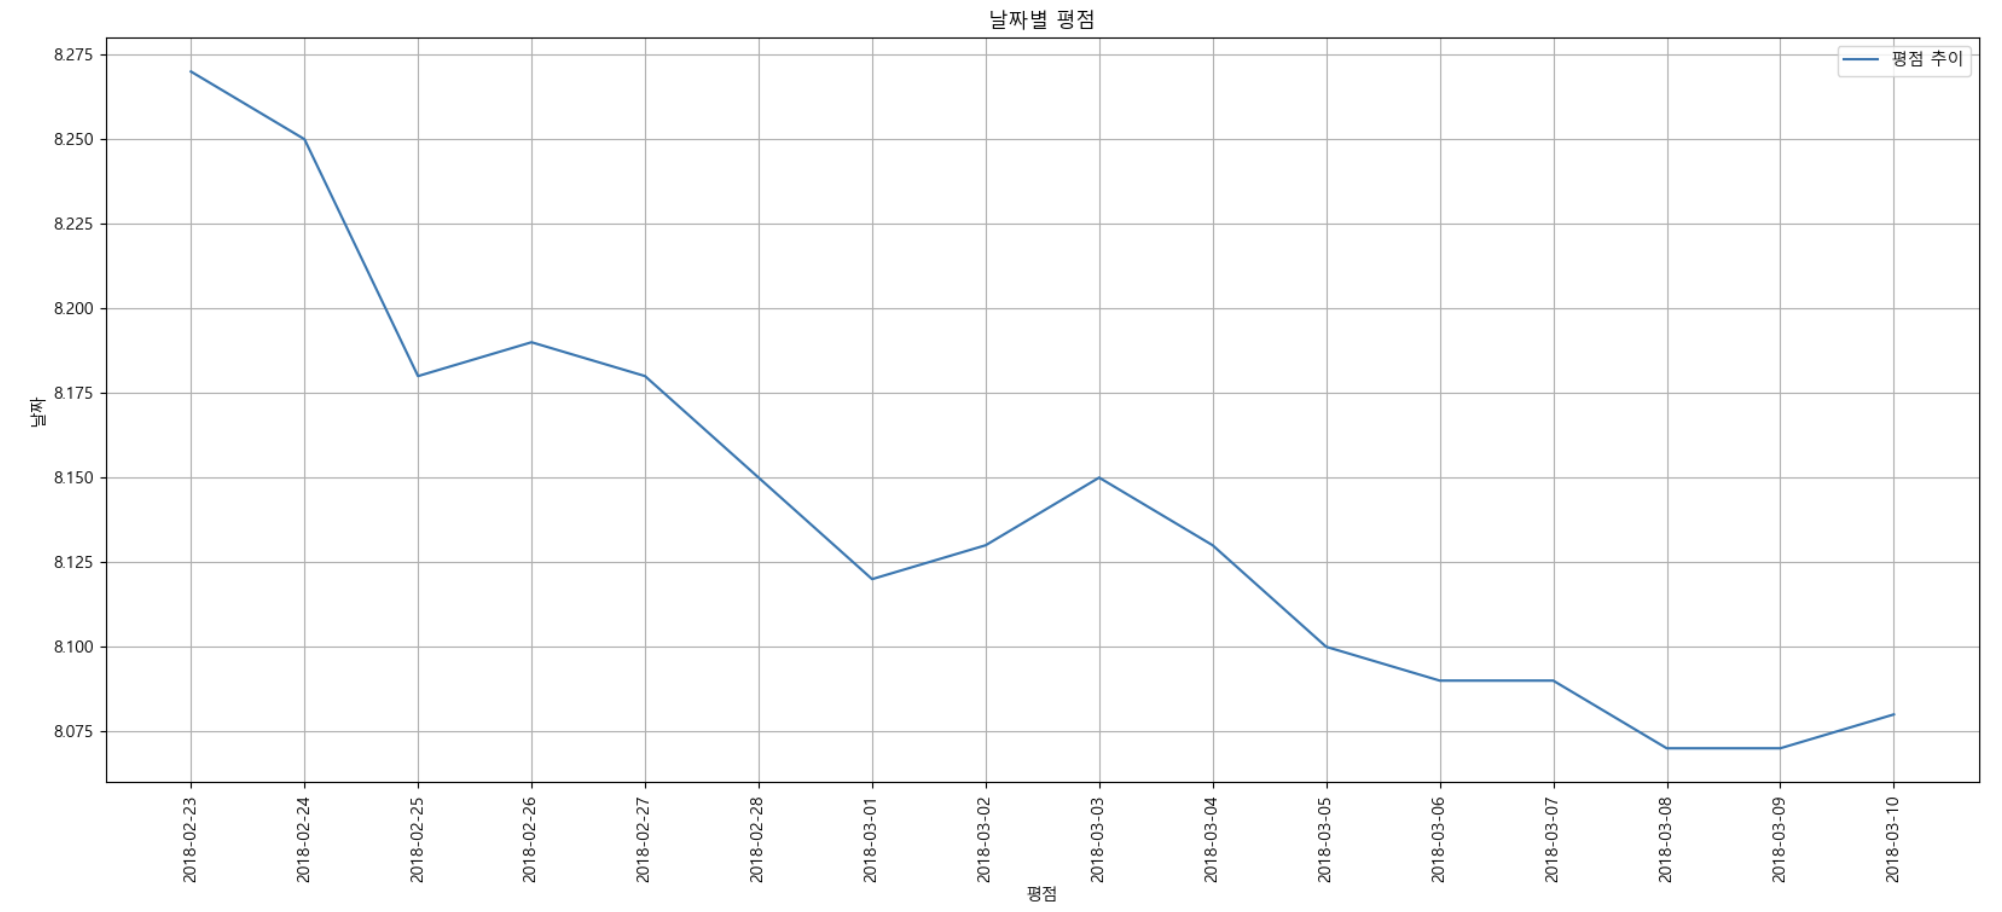
- 인덱스는 'date'로 설정하고, 'name'을 기준으로 피봇
movie_pivot = pd.pivot_table(data=movie, index='date', columns='name', values='point')
movie_pivot.head()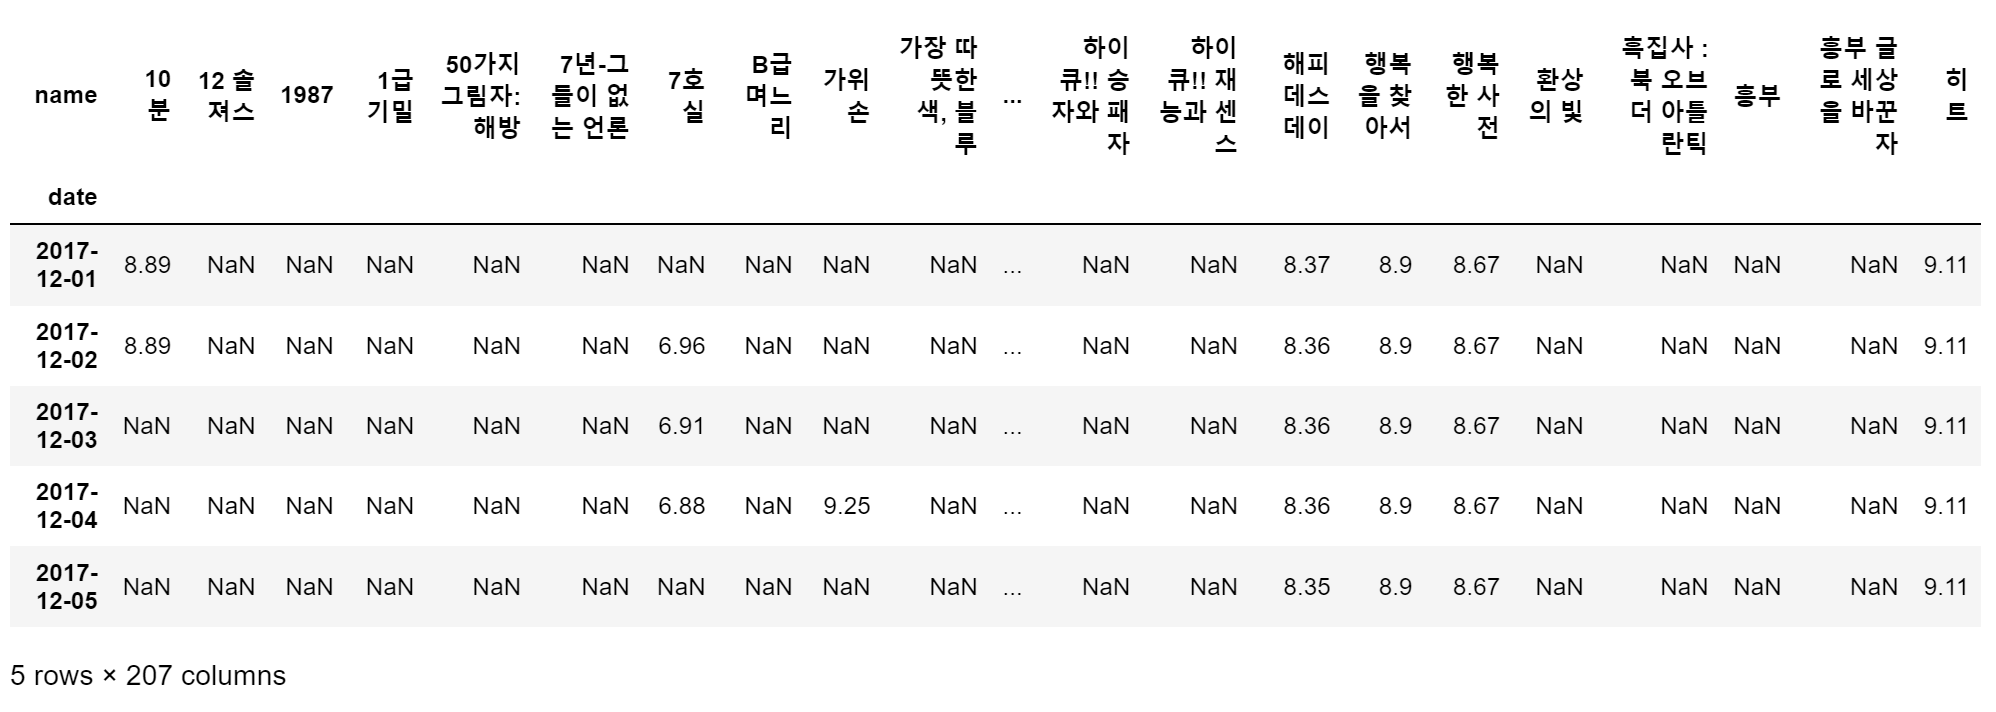
- 날짜별 영화 평점 시각화
target_col = ['7호실', '10분', '해피 데스데이', '행복한 사전', '히트']
plt.figure(figsize=(20, 10))
plt.title('날짜별 평점')
plt.xlabel('날짜')
plt.ylabel('평점')
plt.xticks(rotation='vertical')
plt.tick_params(bottom='off', labelbottom='off')
plt.plot(movie_pivot)
plt.legend(target_col, loc='best')
plt.grid(True)
plt.show()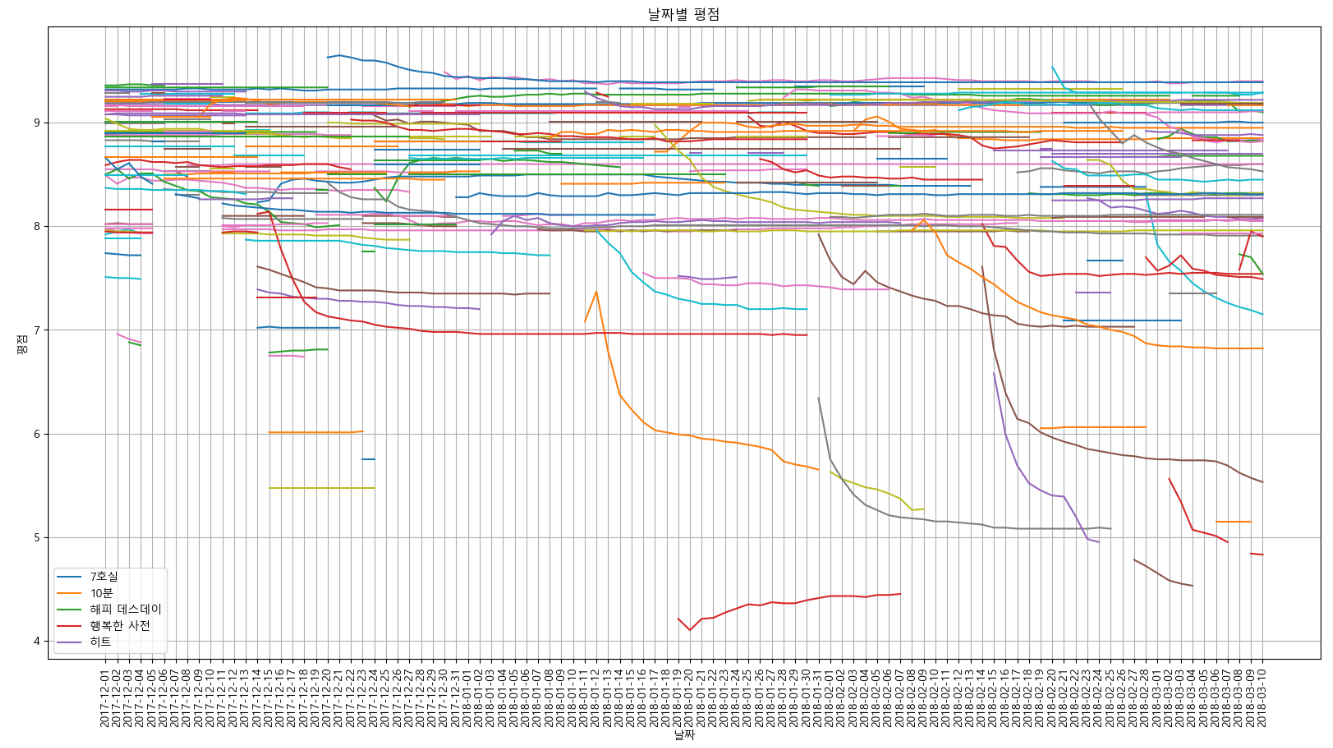
→ 알아보기 어려운 그래프가 결과로 나타났는데, 아무래도 데이터의 전처리가 적합하지 않았거나, 처리가 더 필요했던 것 같다.
"이 글은 제로베이스 데이터 취업 스쿨의 강의 자료 일부를 발췌하여 작성되었습니다."
