
Matplotlib (https://matplotlib.org/)
matplotlib은 파이썬의 대표적인 과학 계산용 라이브러리로, 파이썬 환경에서 그래프 그리기를 지원합니다.
선 그래프, 히스토그램, 산점도 등을 지원하여 고품질 그래프를 그릴 수 있도록 합니다.
주피터 노트북에서 사용 시 %matplotlib notebook 이나 %matplotlib inline 명령을 이용하면 브라우저에서 바로 그래프 이미지를 볼 수 있습니다.
다음 코드는 matplotlib을 사용하여 그래프를 그리는 간단한 예제입니다.
%matplotlib notebook
import numpy as np
import matplotlib.pyplot as plt

# -10 ~ 10까지 100개의 간격으로 나누어진 배열 생성
x = np.linspace(-10, 10, 100)
# 사인함수를 사용하여  y배열을 생성
y = np.sin(x)
#  plot 함수로 배열에 대응하는 선 그래프 그리기
plt.plot(x,y,marker="x")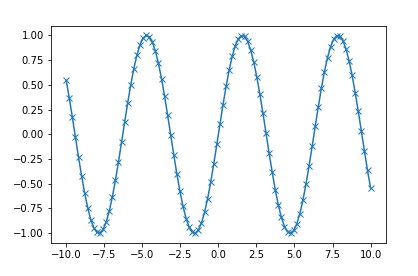
다음 예제는 그래프의 subplot, 선형도, 산포도, 범례 등 세밀한 설정에 관한 예제입니다.
%matplotlib notebook
#import numpy as np
#import matplotlib.pyplot as plt

# x축 영역과 정밀도 설정
x = np.arange(-3,3,0.1)
# 각 방정식의 y값 준비
y_sin = np.sin(x)
x_rand = np.random.rand(100)*6-3
y_rand = np.random.rand(100)*6-3

#figure 객체 생성
plt.figure()

#그래프 1개로 표시함을 설정
plt.subplot(1,1,1)

%matplotlib notebook
import numpy as np
import matplotlib.pyplot as plt

# x축 영역과 정밀도 설정
x = np.arange(-3,3,0.1)
# 각 방정식의 y값 준비
y_sin = np.sin(x)
x_rand = np.random.rand(100)*6-3
y_rand = np.random.rand(100)*6-3

#figure 객체 생성
plt.figure()

#그래프 1개로 표시함을 설정
plt.subplot(1,1,1)

#각 방정식의 선형과 마커, 레이블을 설정하고 플롯
##선형도
plt.plot(x, y_sin, marker='o', markersize=5, label='line')

##산포도
plt.scatter(x_rand, y_rand, label='scatter')

#범례
plt.legend()

#그리드 라인
plt.grid(True)

#그래프 표시
plt.show()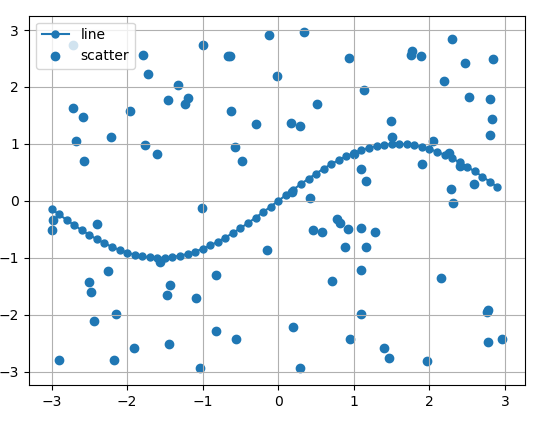
[참고자료]
▫ 「머신 러닝 부트캠프 with 파이썬」 시스템계획연구소, (주)도서출판길벗, 2018-07-16
▫ 「Introduction to Machine Learning with Python」, Andreas Müller, O'Reilly, 2021-07-19

세양쥐는 코딩하는 찍찍쥐