Introduction
The configuration of the existing system was not able to fully utilize the power of vSAN ESA, so further upgrades were made.
The entire cluster system now has Cascade Lake Xeon Gold CPUs, and the existing x8 PCI-E risers were changed to x16 to fully accommodate the bandwidth of the 100GbE single link.
Now that I'm ready for testing, I'll going to start testing the performance of vSAN ESA in earnest.
Prepare for performance testing
Deploy HCIBench
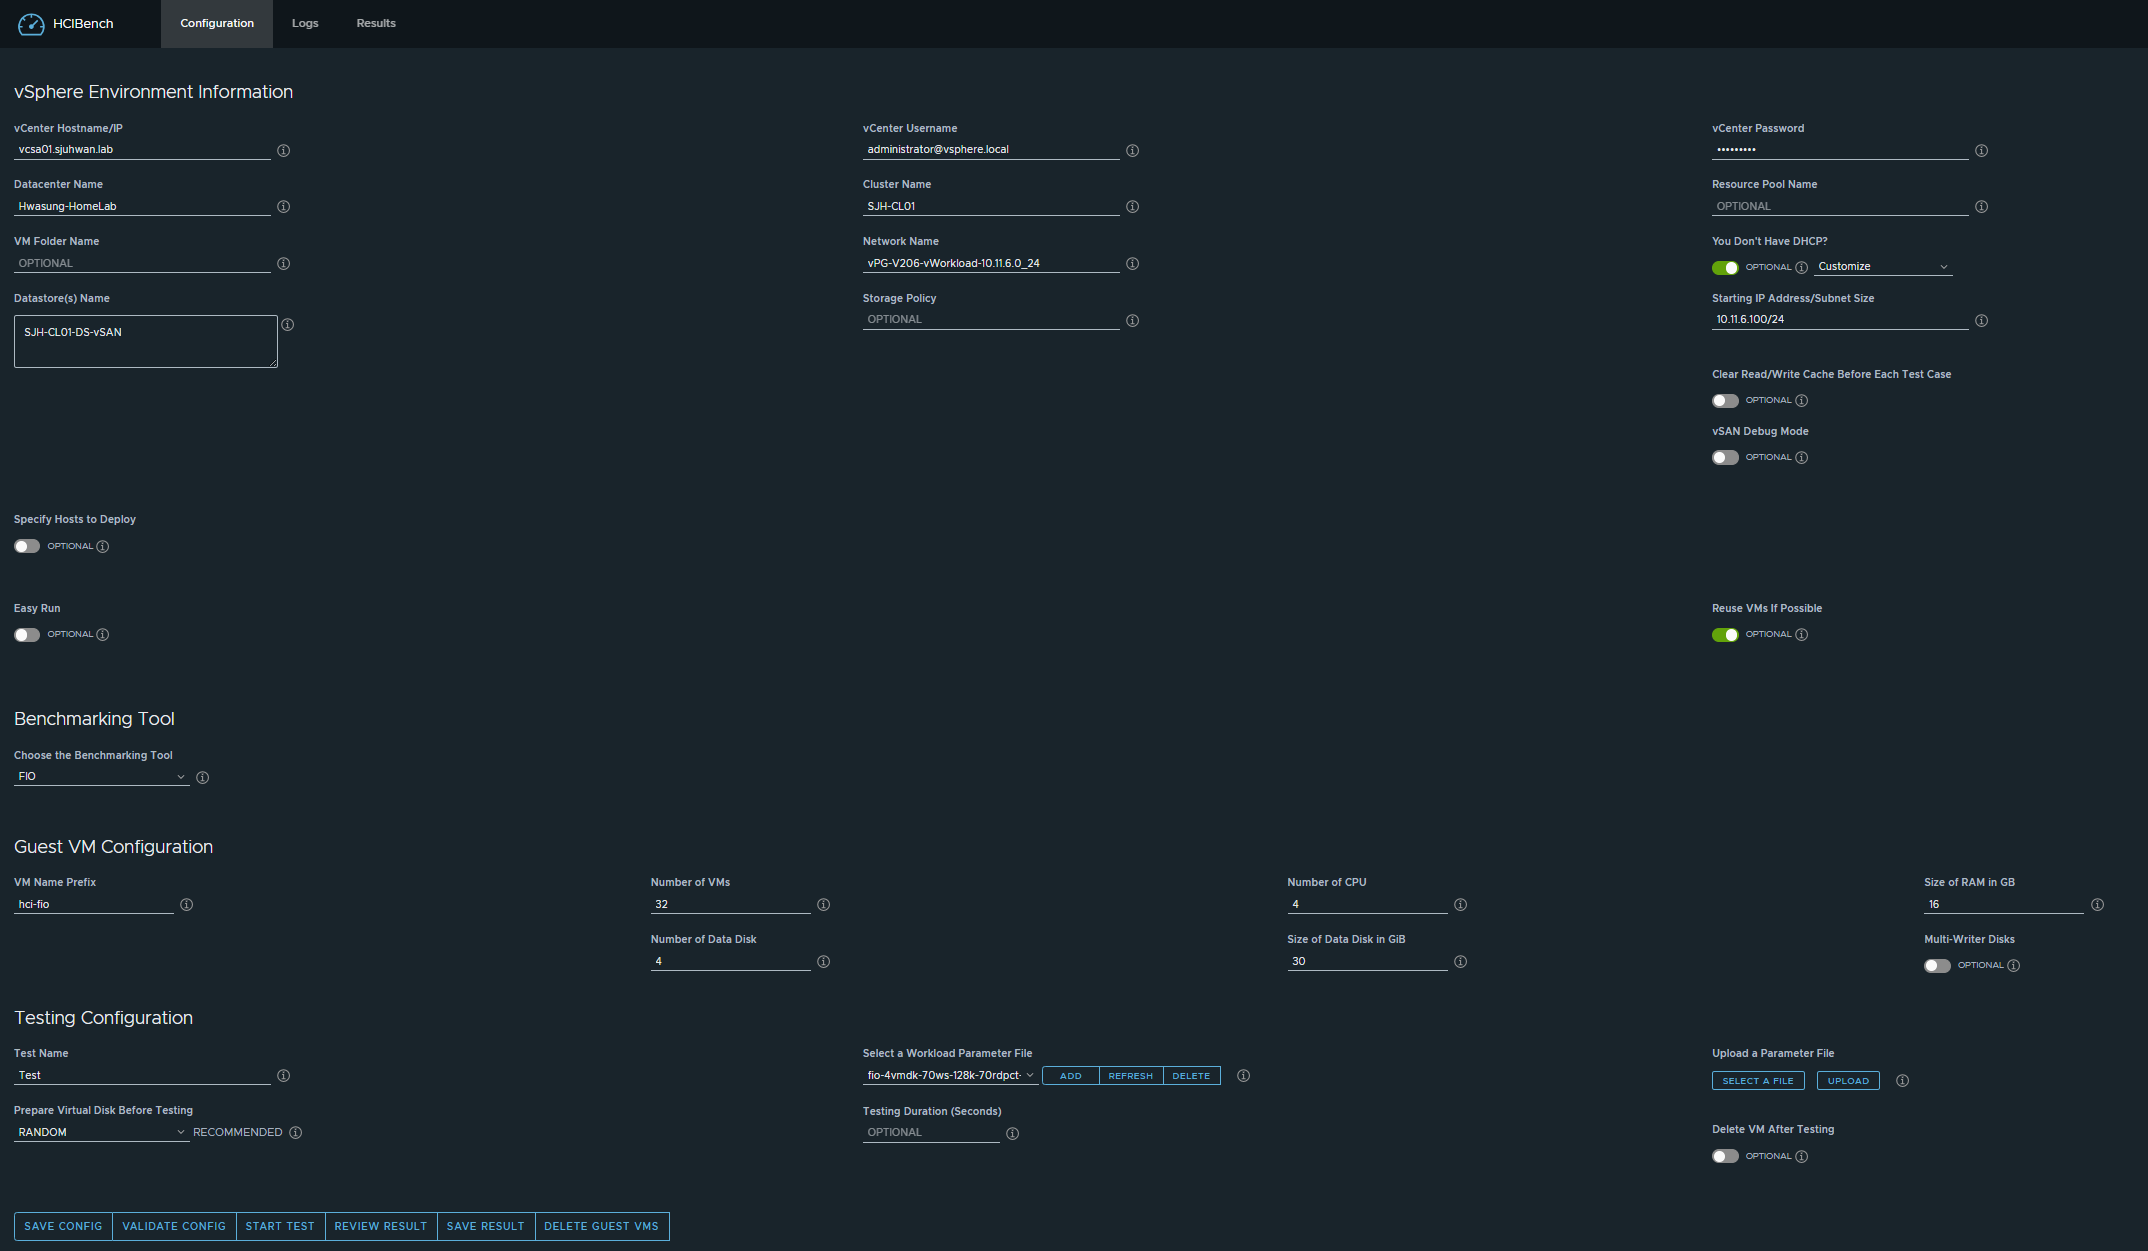
For performance testing, we will utilize HCIBench, a benchmark appliance provided by VMware.
The latest version at this point is 2.8.3 and can be deployed as an OVF to the cluster will be testing.
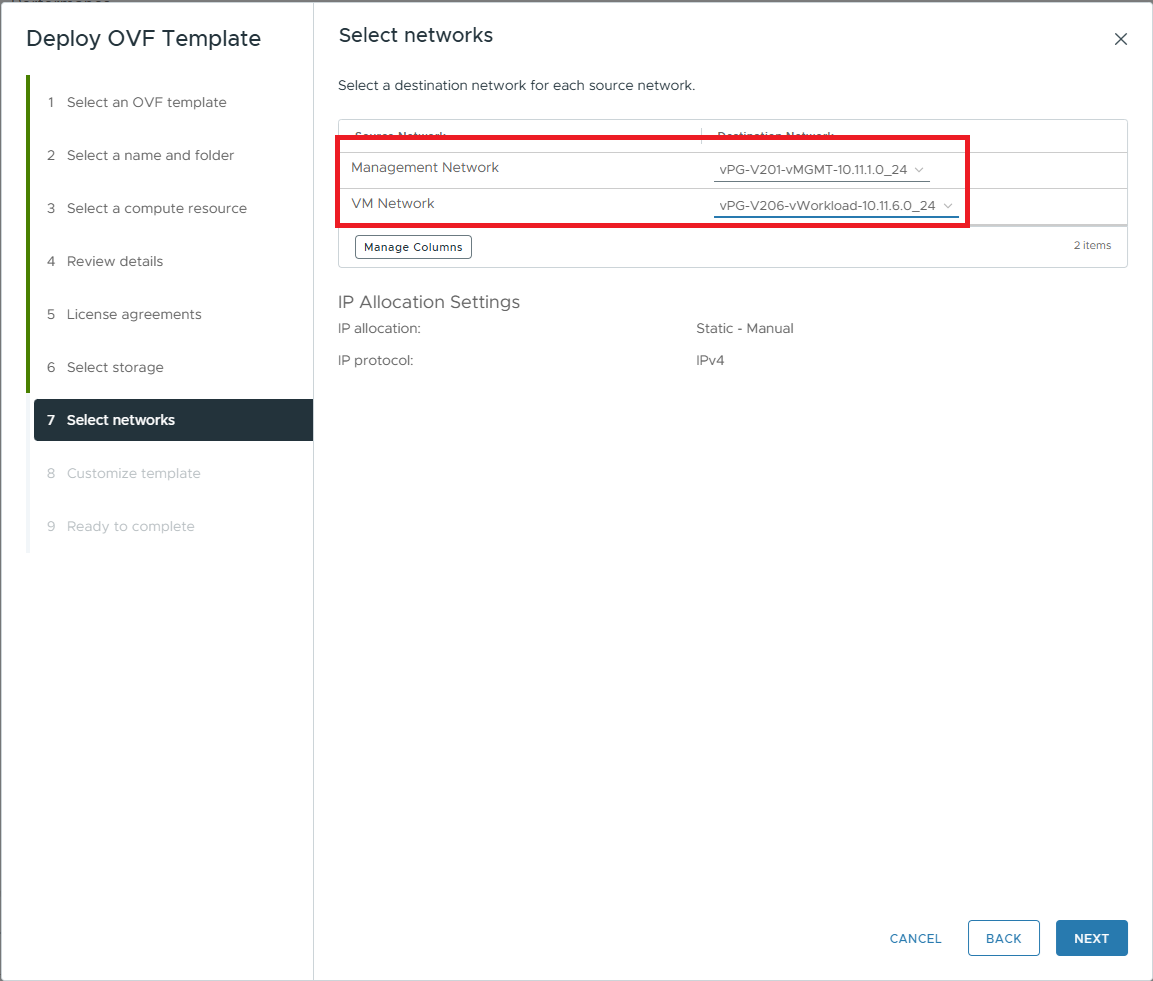
Note when deploying, the VM Network in the Select networks tab refers to the port group in HCIBench where the test VMs will be deployed.
Select the port group for the Management Network to access HCIBench and the port group for the VM Network to deploy the test VMs, and then proceed with the deployment.
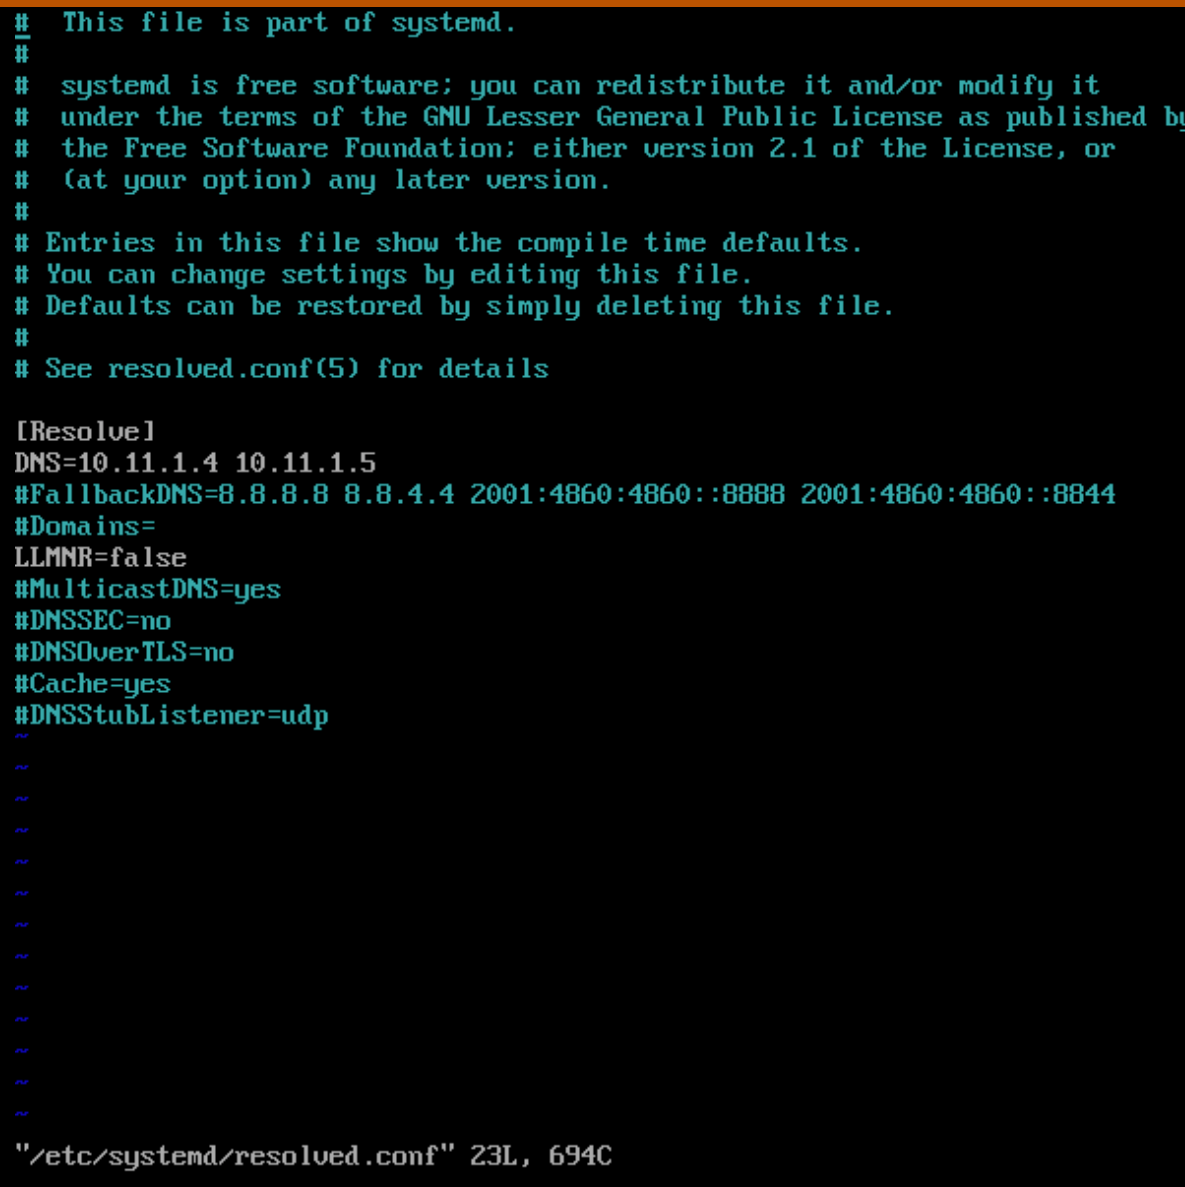
Next, after the initial boot, we need to manually enter the DNS servers to connect with vCenter. Although you can enter the DNS server on the Customize template tab, the value is not reflected in the actual configuration. Therefore, access HCIBench's console directly, specify the DNS server in /etc/systemd/resolve.conf and restart the systemd-resolved service.
Now log in to https://<HCIBenchIP>:8443 and you should see something like this.
Shorten the vSAN Perf Metric Collection Interval
vSAN collects and stores performance metrics every five minutes by default. However, in a benchmark environment, a collection interval of 5 minutes is too long, and we should reduce the collection interval to the minimum configurable value of 1 minute.
The following command should be run on the CMMDS Master node, which is the first node in the list of sub-cluster nodes in vSAN Cluster Status.
# Execute on the CMMDS master node
esxcli vsan perf set --interval=60
We are now ready to proceed with vSAN performance testing using HCIBench.
Test Environment
ESA Cluster Configuration
The current configuration of the vSAN ESA cluster is as follows
- vSphere 8.0 Update 3b
- 8 total nodes in cluster
- 4 Xeon Gold 6230 x2, 2 Xeon Gold 6252 x2, 2 Xeon Gold 6240 x2
- 256GB+ memory on each node
- Micron 7300 MAX 3.2TB x 15EA, Intel P4610 3. 2TB x 16EA (approximately 4 per node, one node could not recognize one Micron SSD due to faulty backplane)
- ConnectX-4 100GbE Dual Port NIC (PCI-E 3.0, use single port for vSAN testing)
- RDMA Best Practice Configuration (no ETS)
- vSAN ESA RAID-6 Policy
- No dedup / compression
HCIBench Test Configuration
The test cases are as follows:
- Using FIO
- 4 vCPU / 4 Disk / 8 Thread (2 Thread/VM) - 2:1 Oversubscription
- R/W Ratio: 7:3
- Runtime: 600 sec (10 minutes)
- Warm-up time: 120 sec
- Random
- 0%
- 50%
- 100%
- Number of VMs
- 16
- 32
- Block Size
- 4KiB
- 64KiB
- 256KiB
- 1MiB
- RDMA Enabled or Not
- ON
- OFF
- Power Profile Configuration
- Performance
- Balanced
The first goal is to show the maximum performance of vSAN ESA in an environment that is representative of typical use cases, and the second is to see how much performance variation occurs with changes in detailed parameters.
Test Results
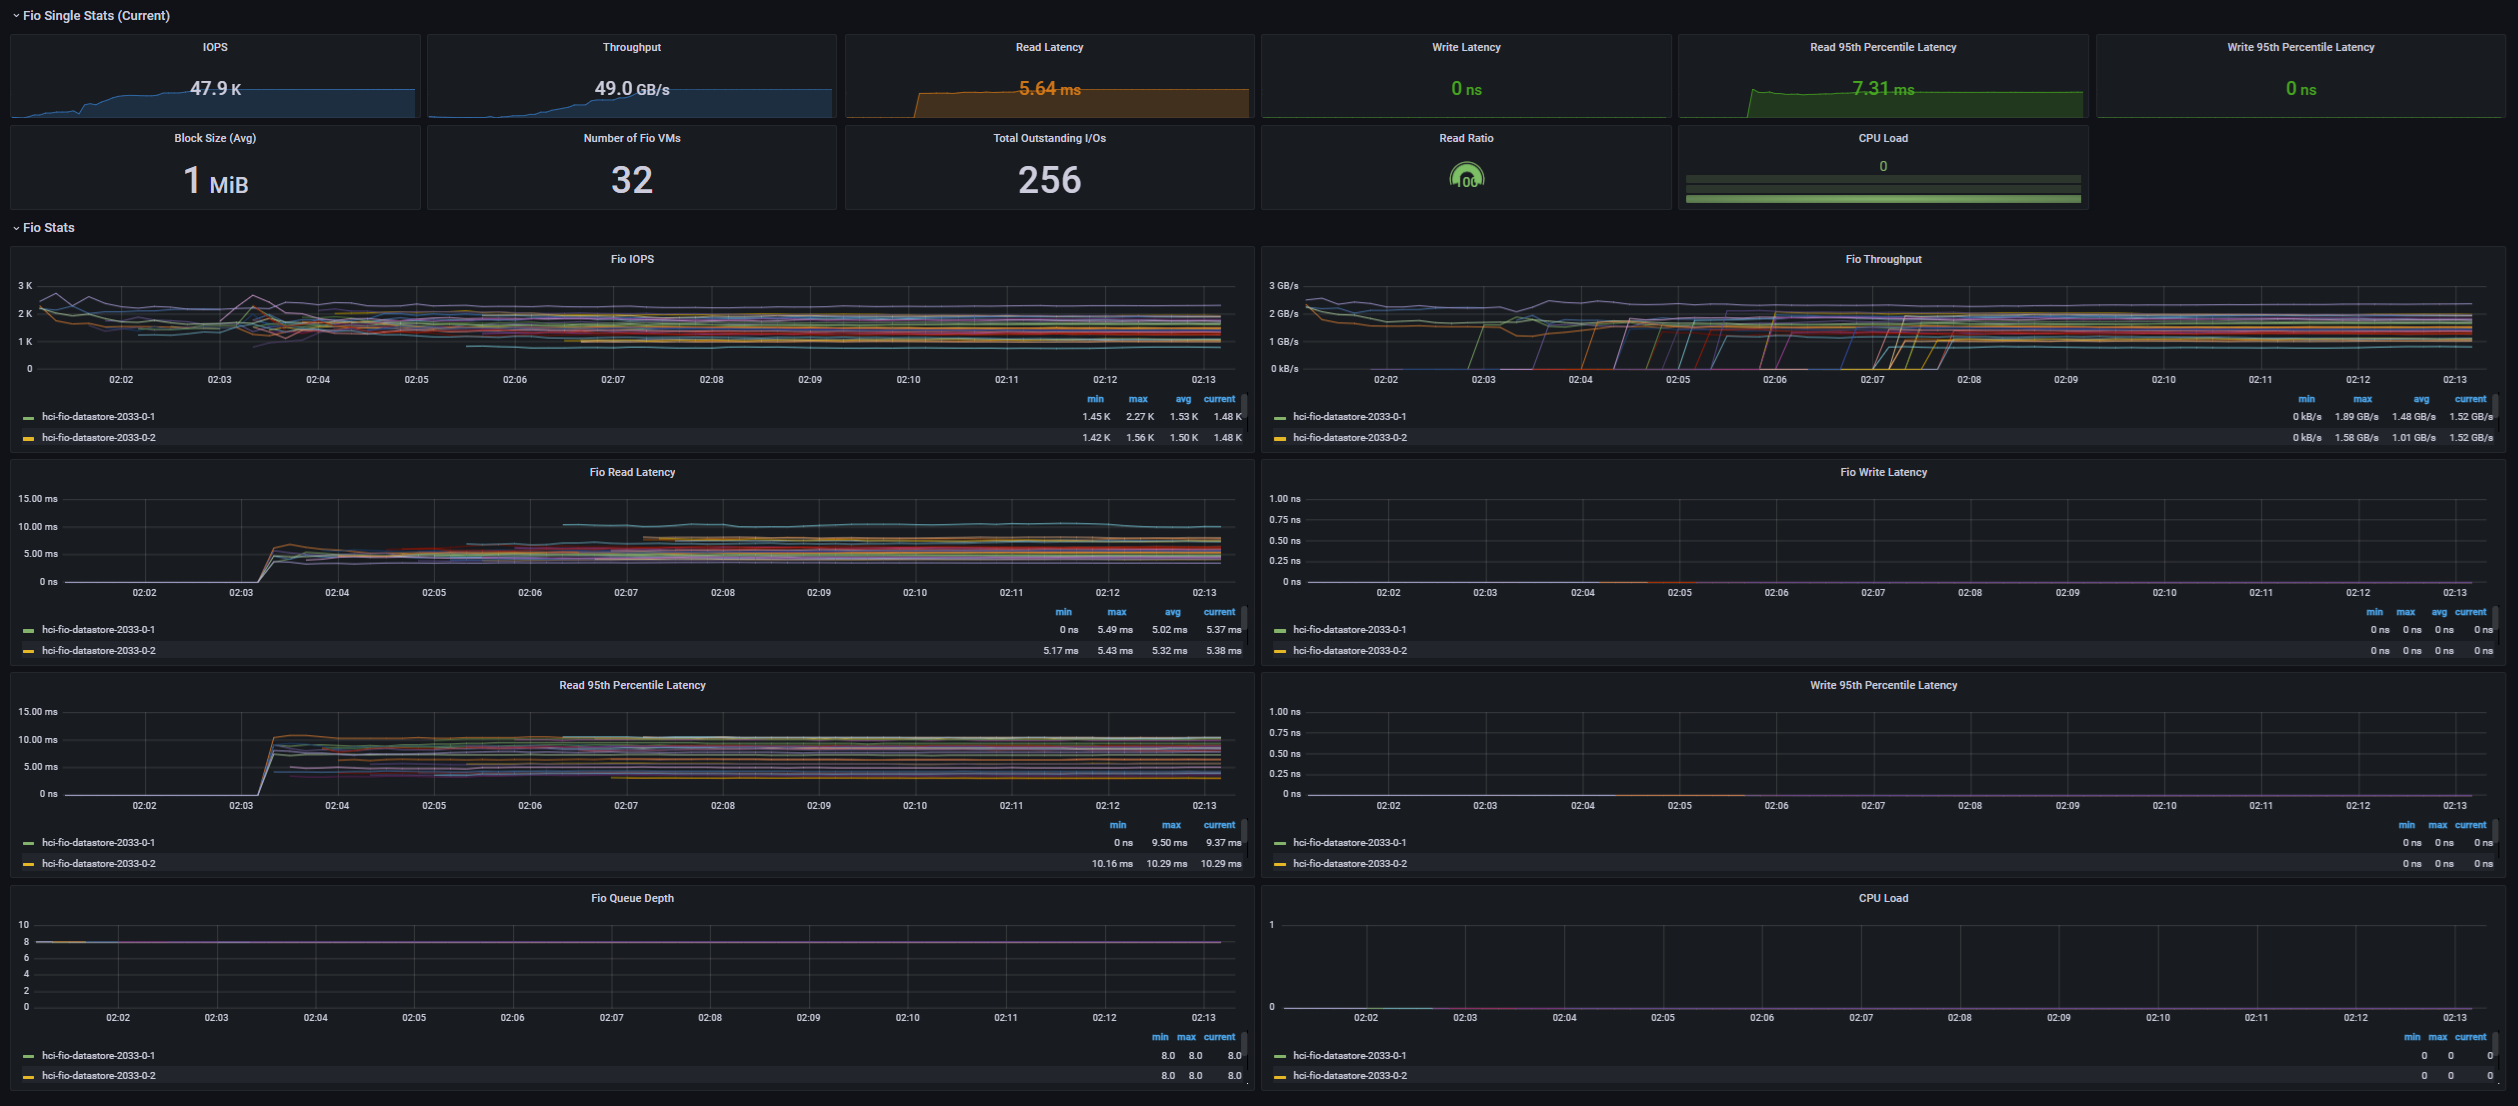
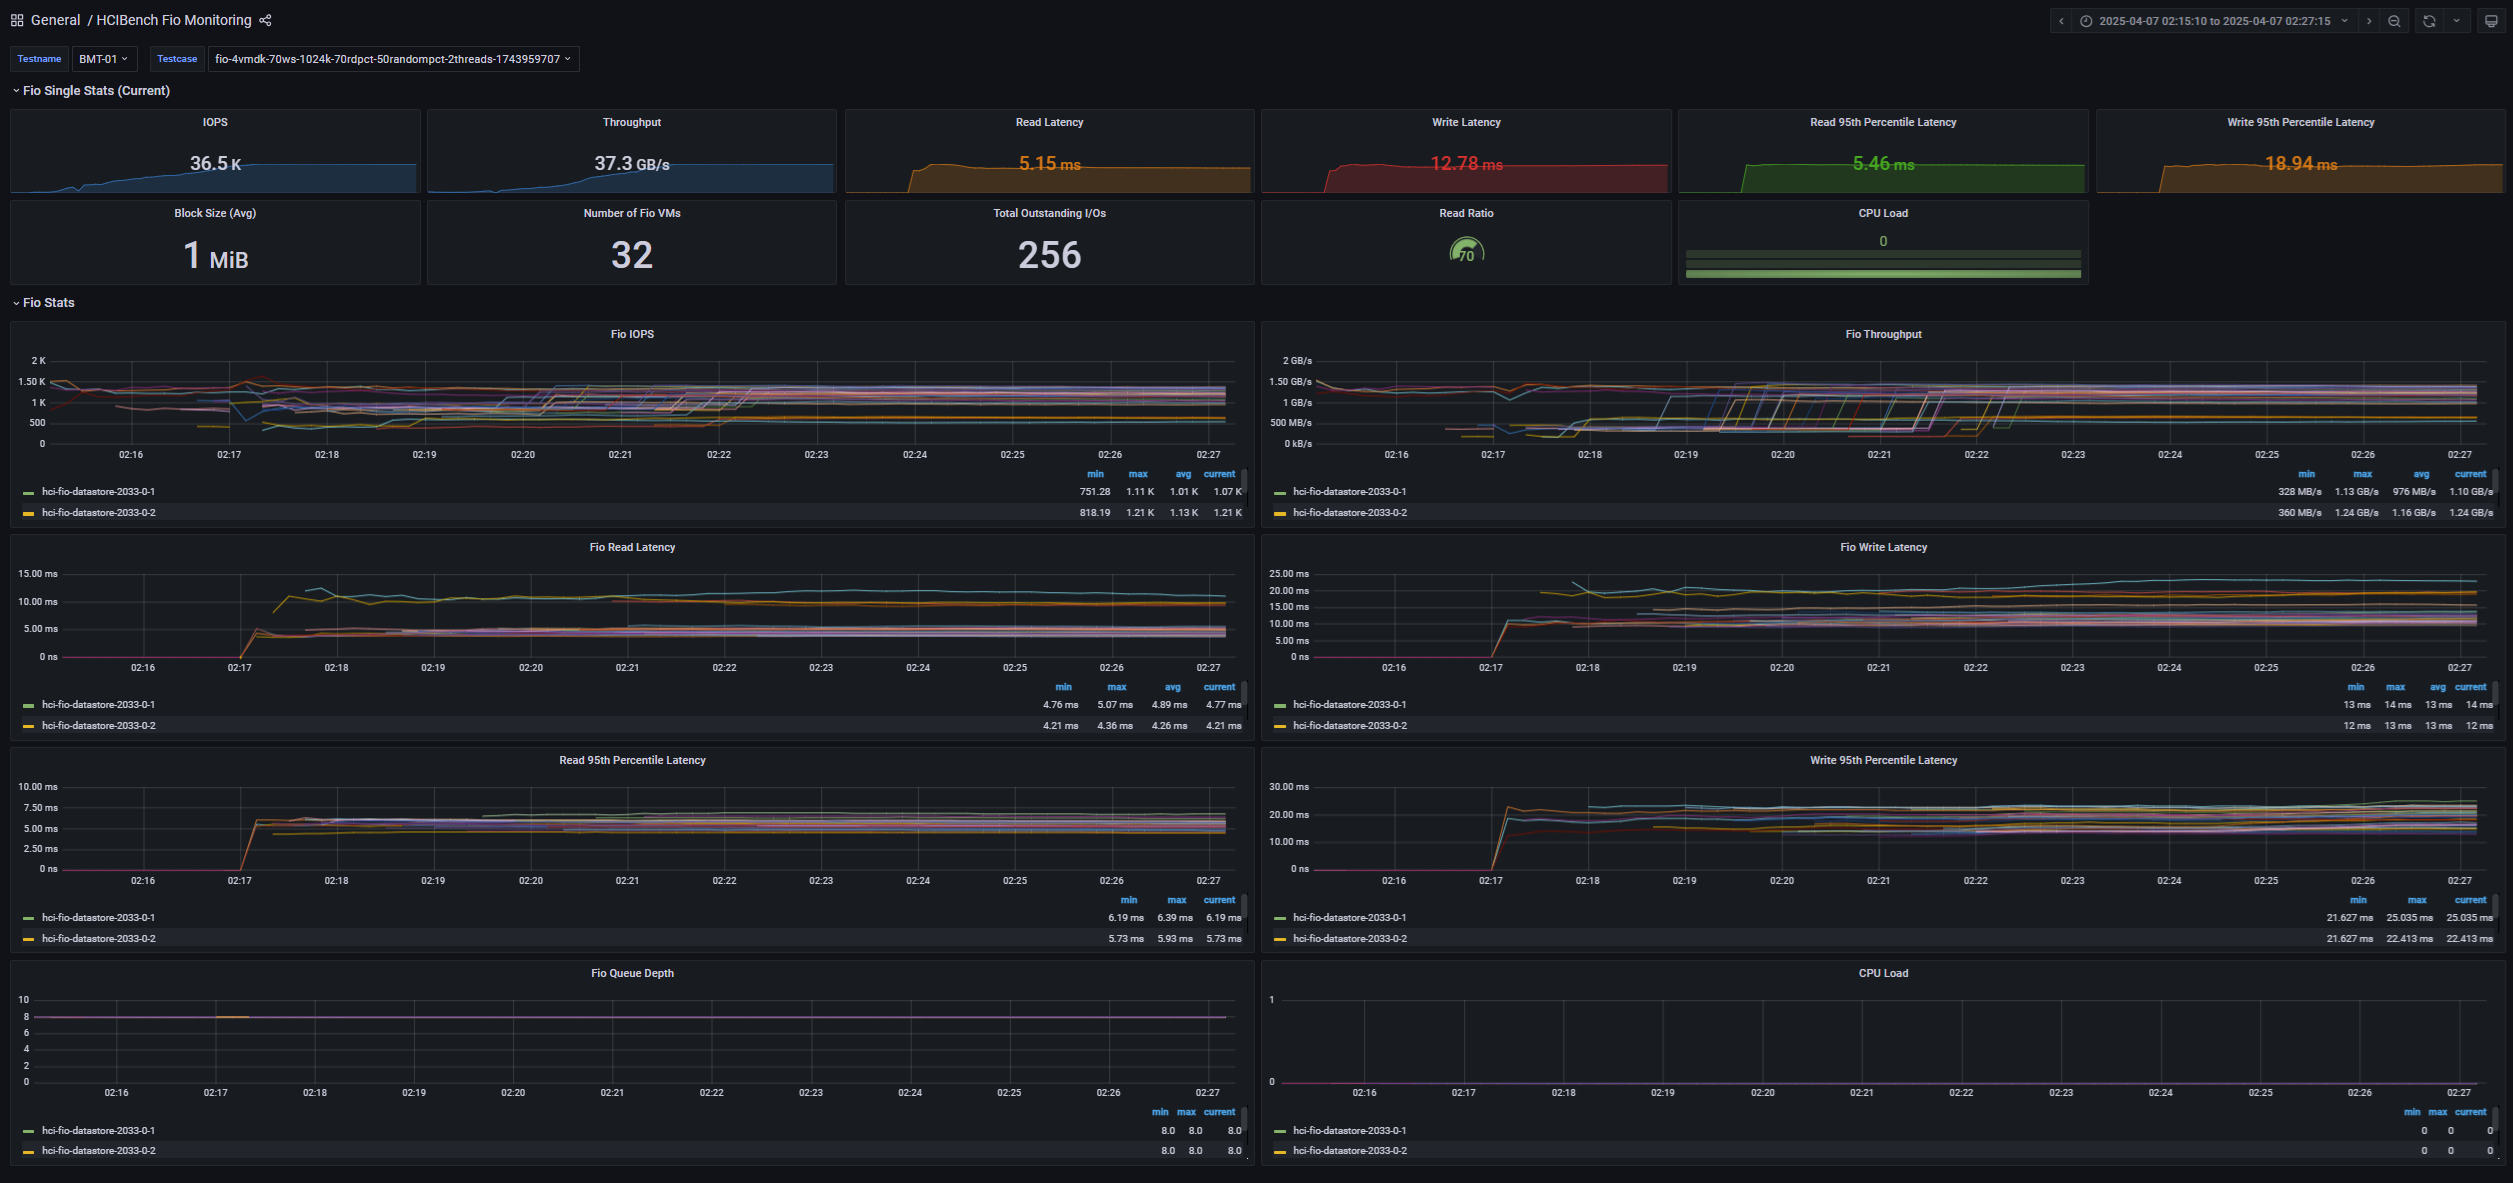
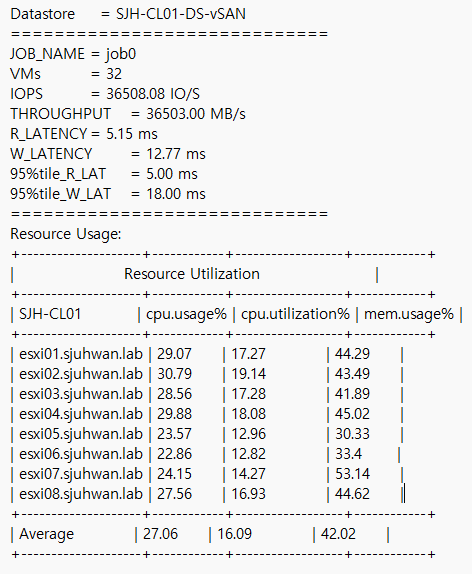
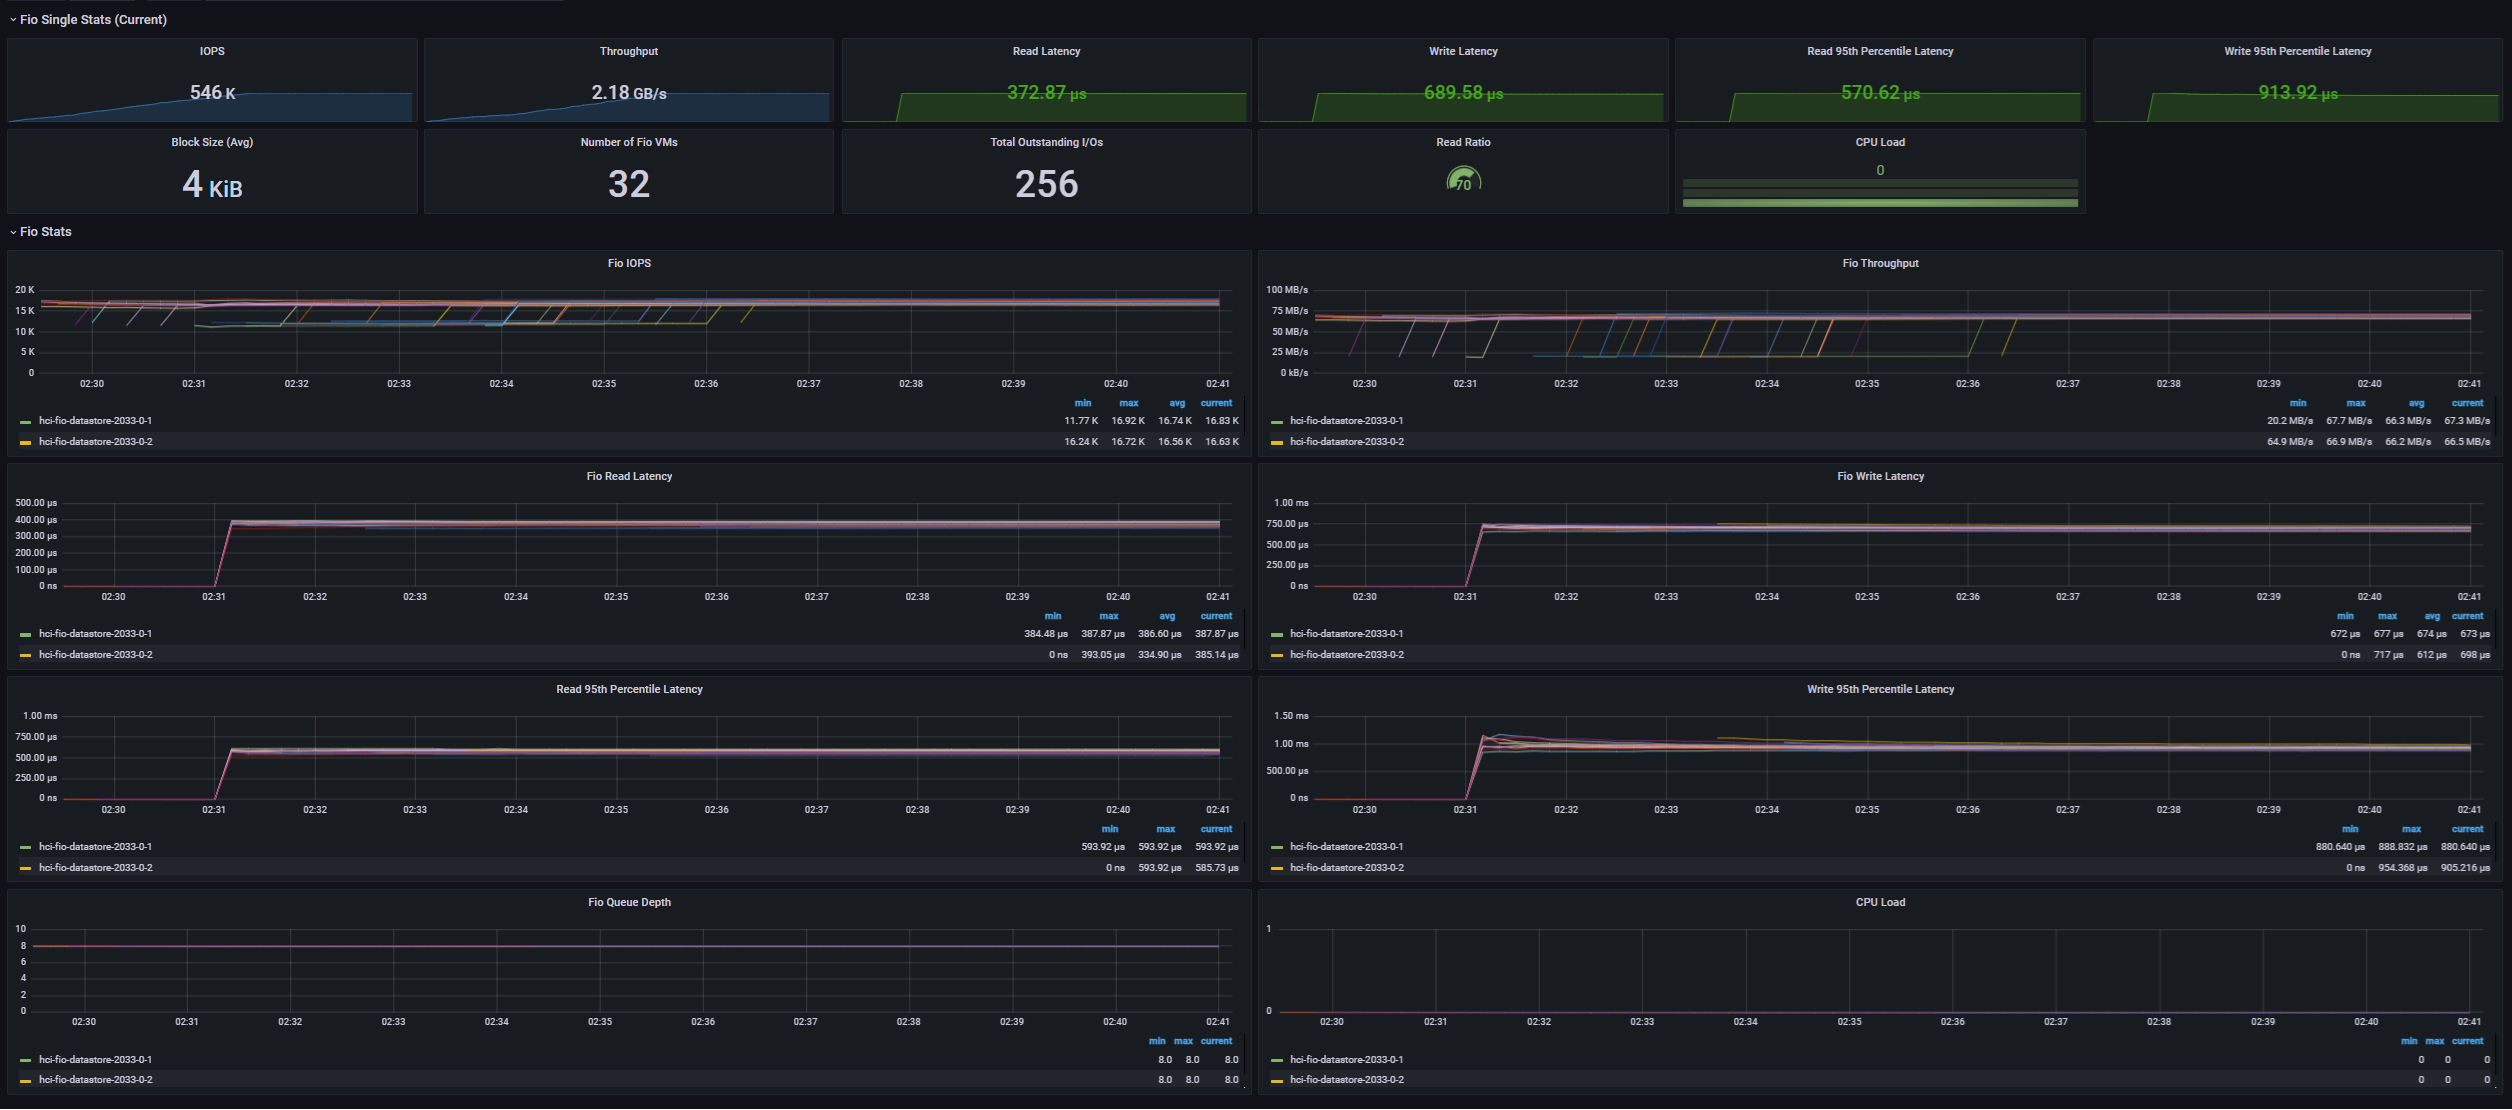
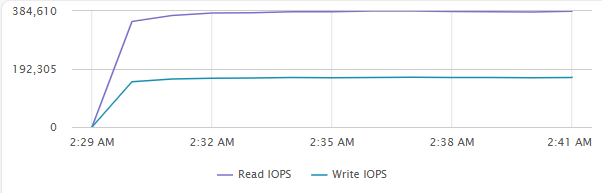
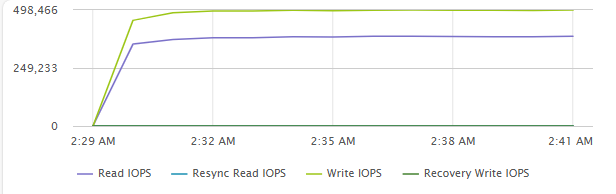
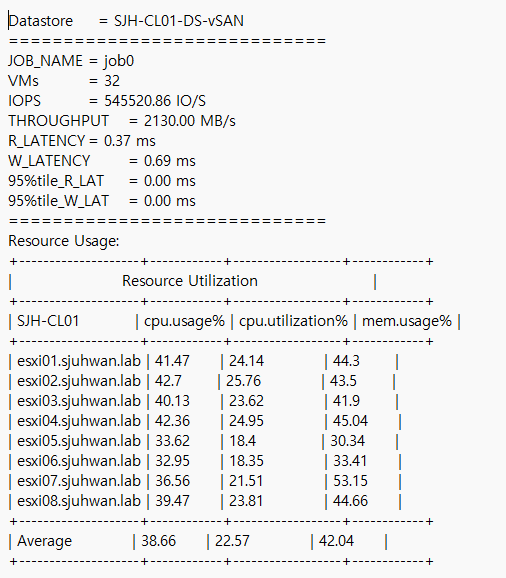
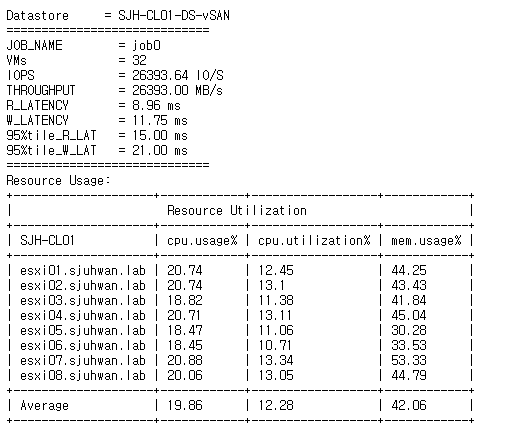
Maximum IOPS Test
- 32 VM (4 VM / Host)
- 4 vCPU / 4 VMDK / 8 Thread (QD=8)
- 4KiB Block Size
- R/W Ratio: 7:3
- Random 50%
- RDMA ON
- Performance Power Profile
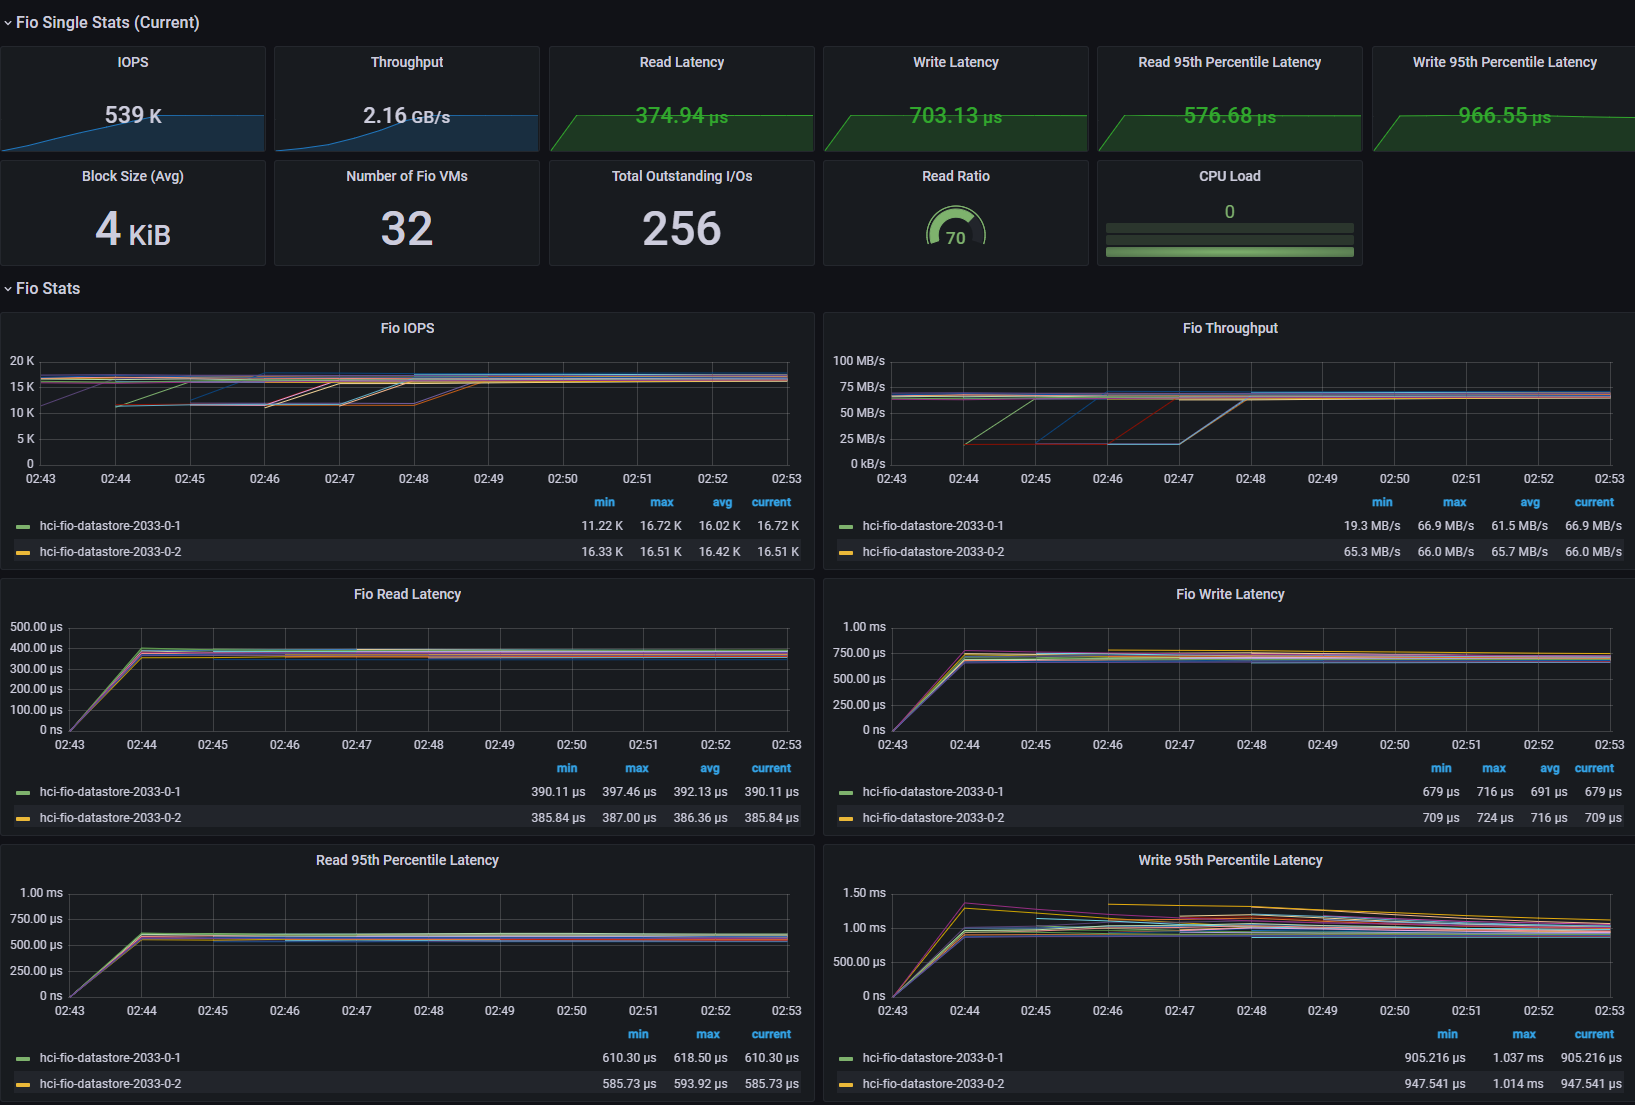
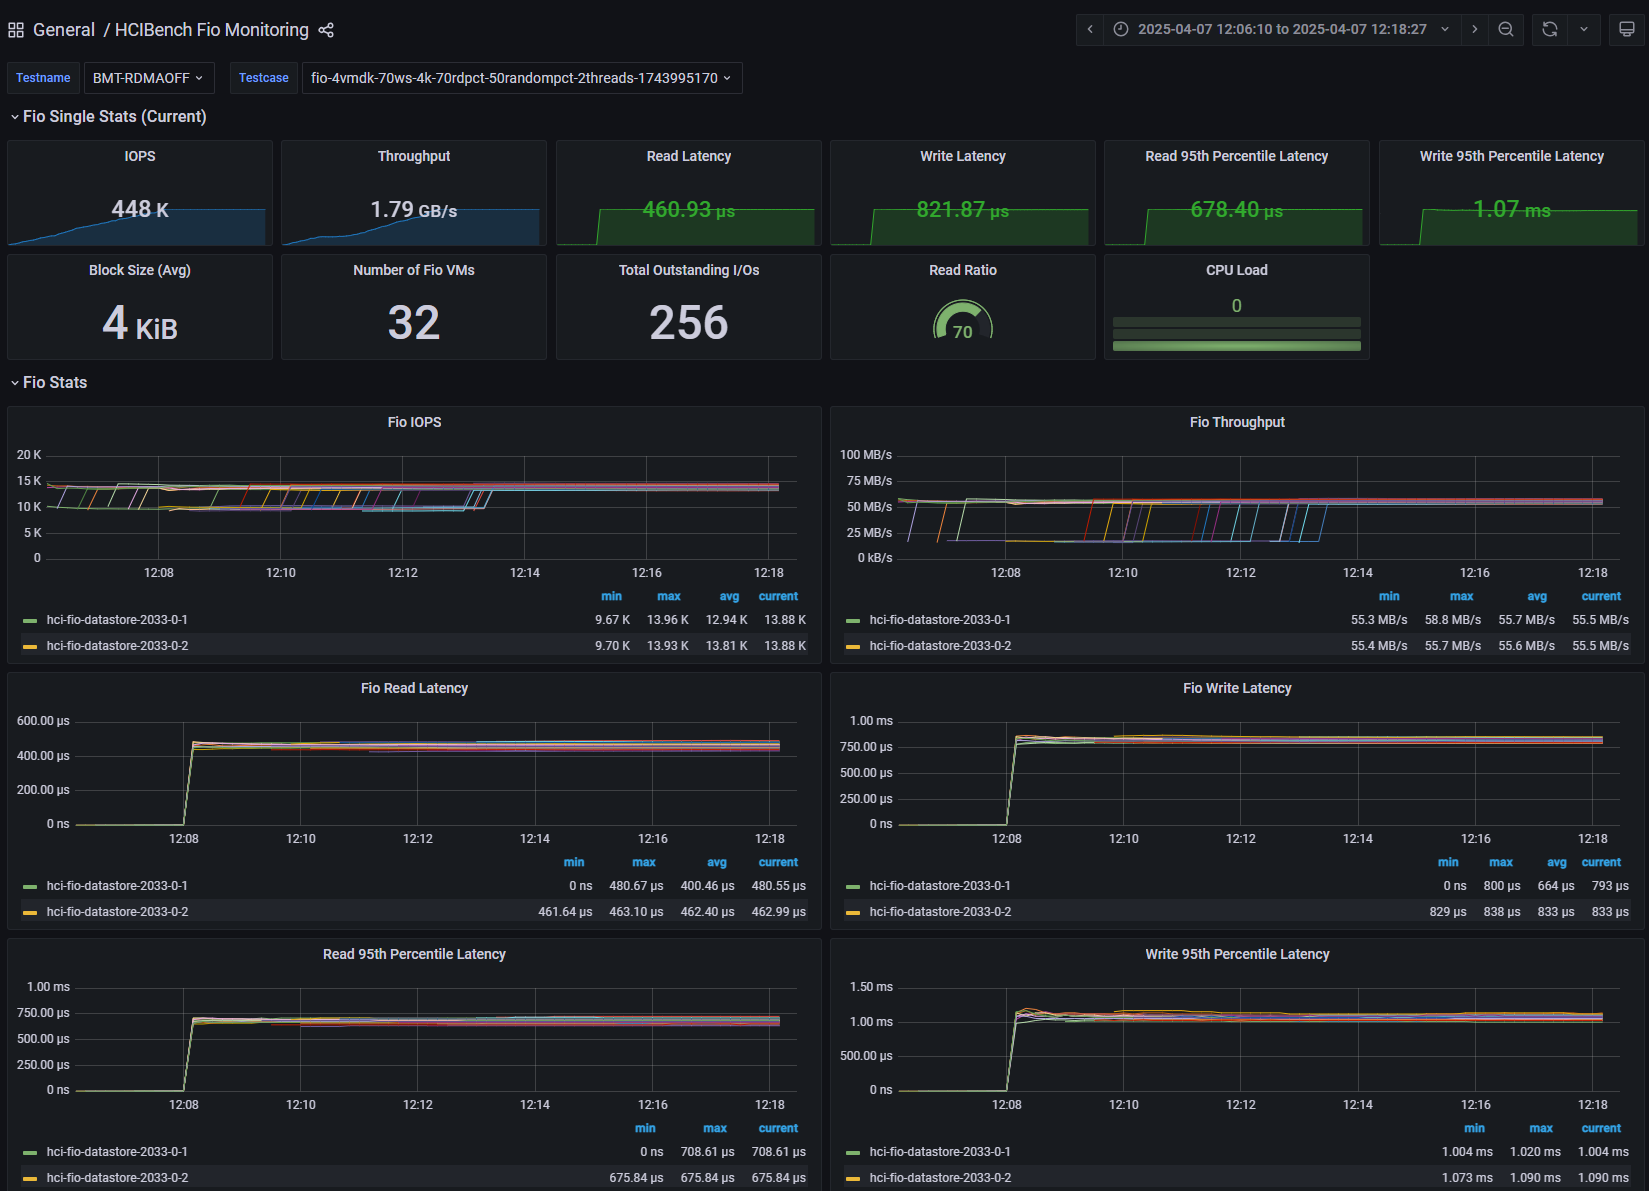
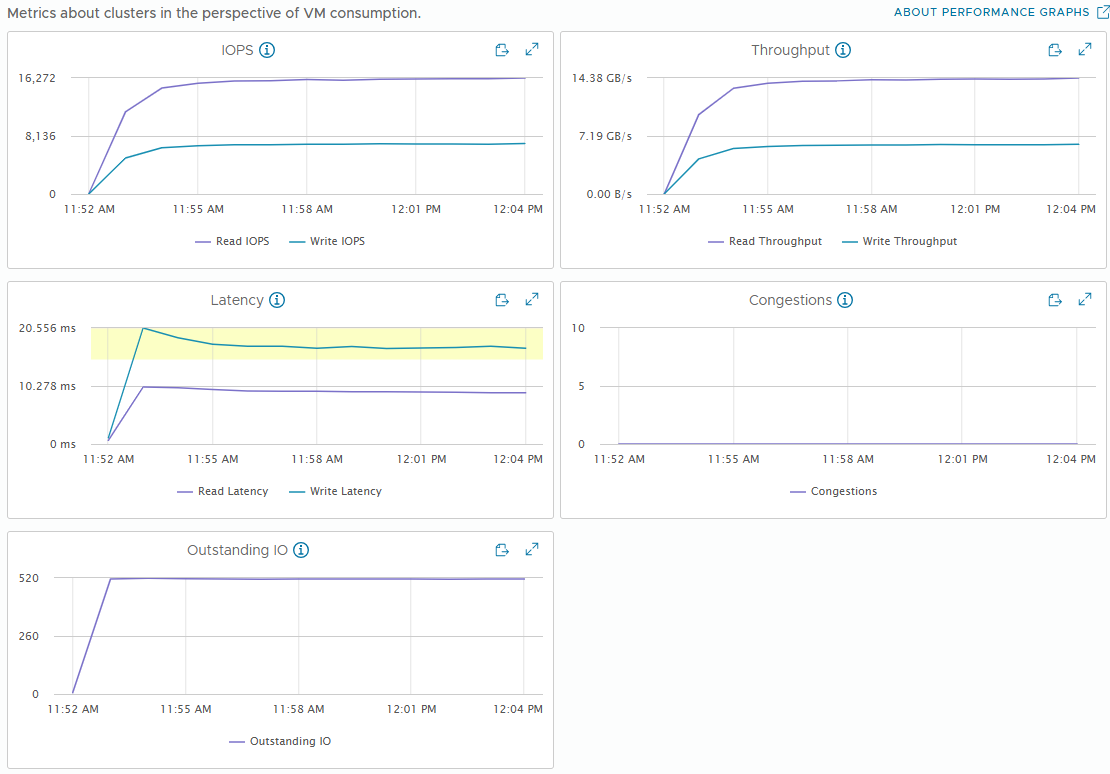
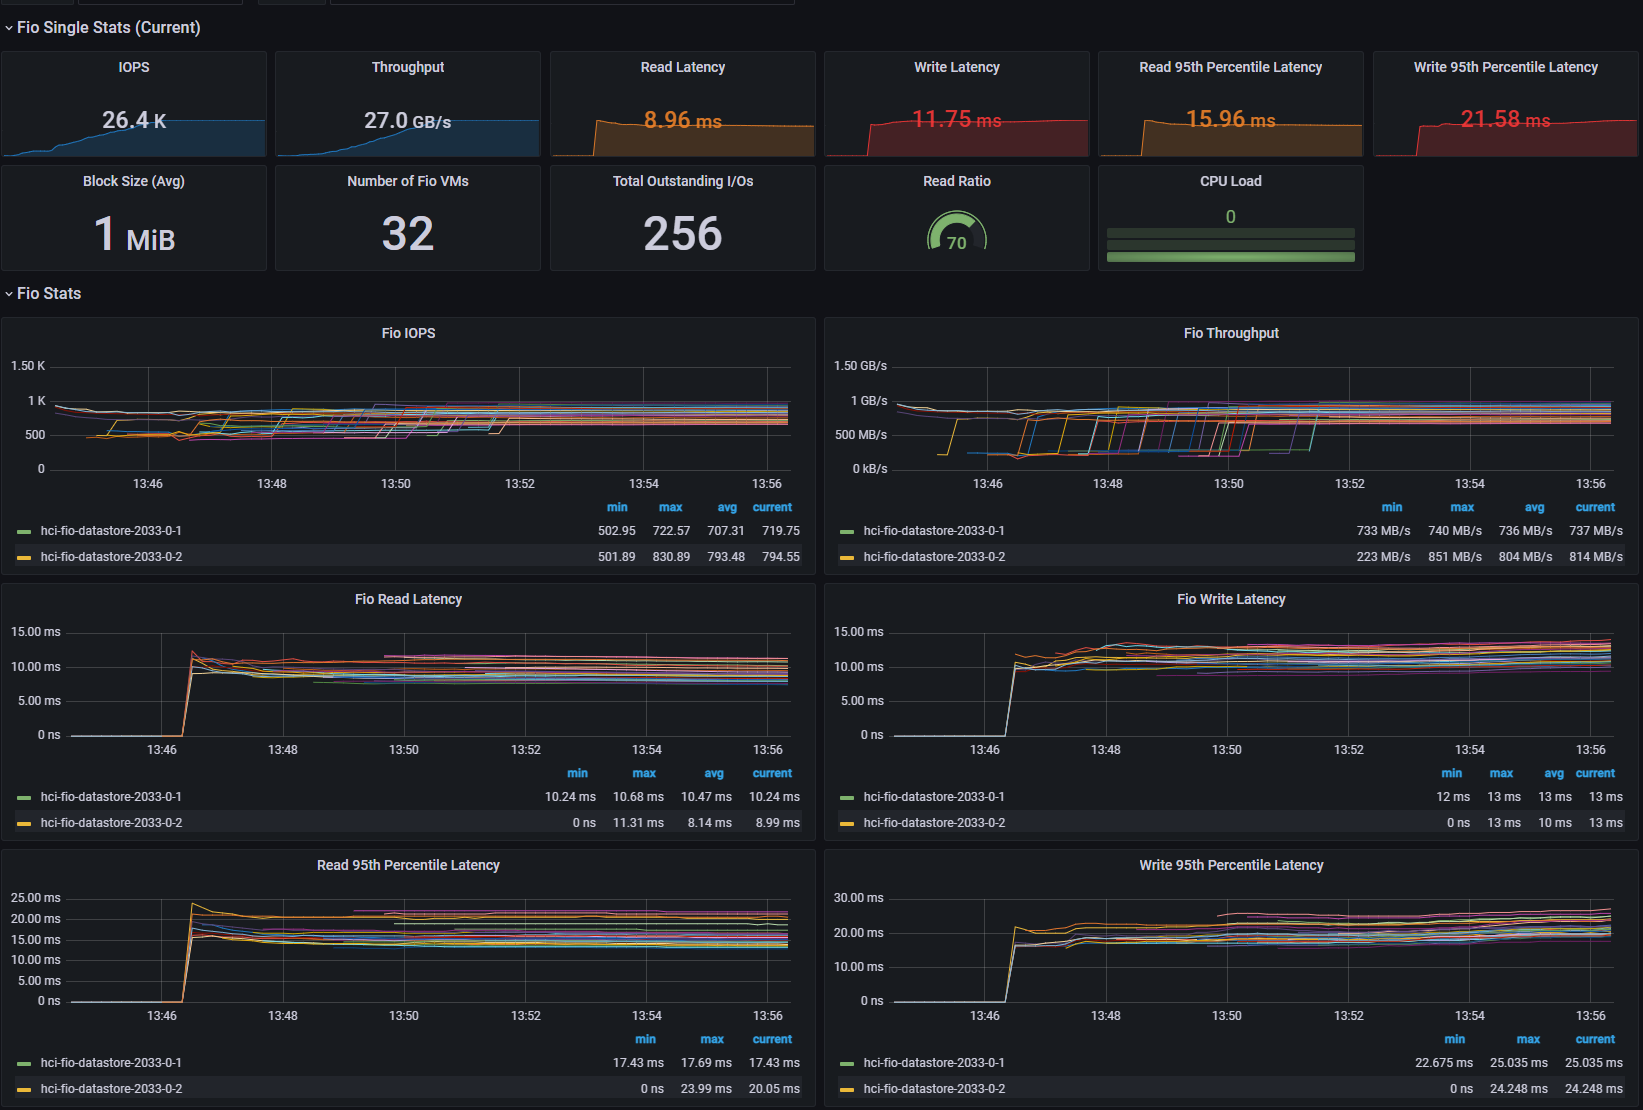
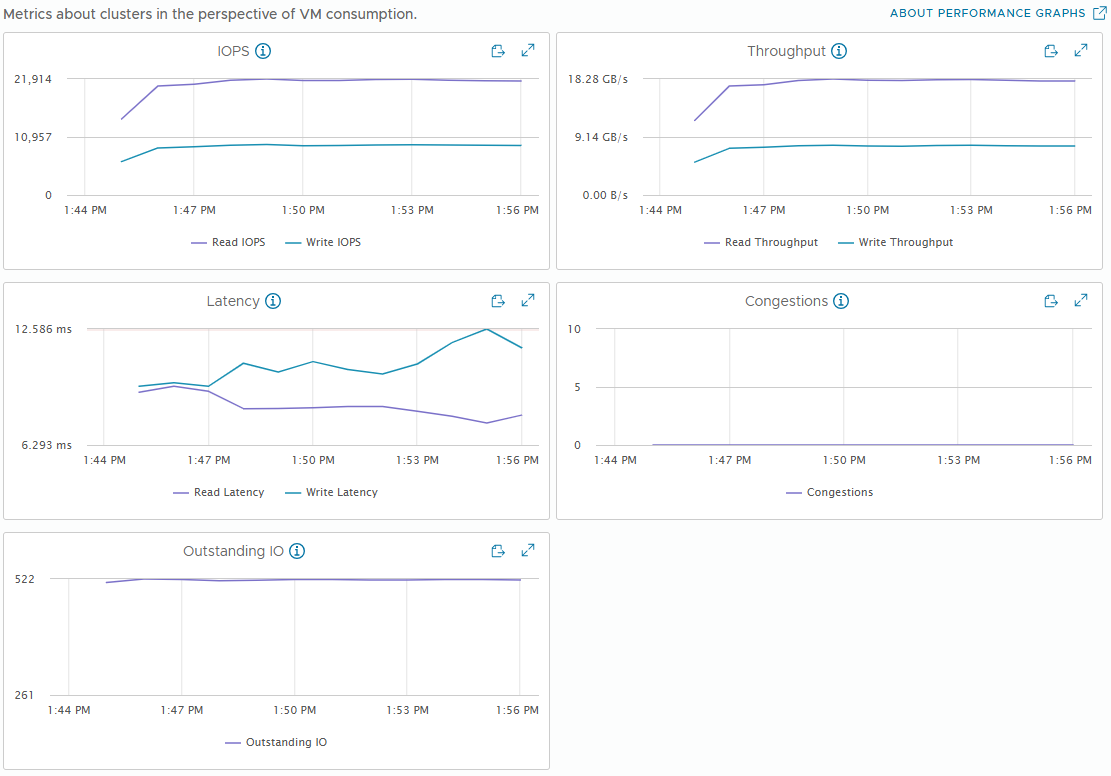
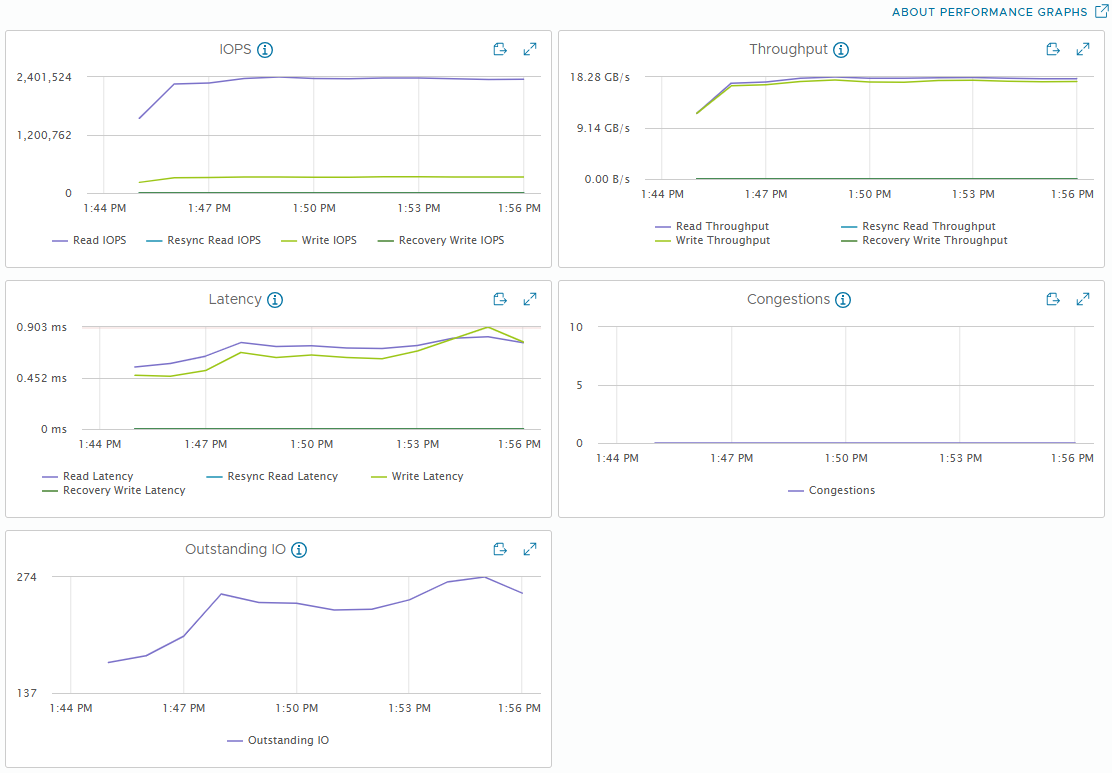
[Fig 1. FIO Grafana Dashboard]
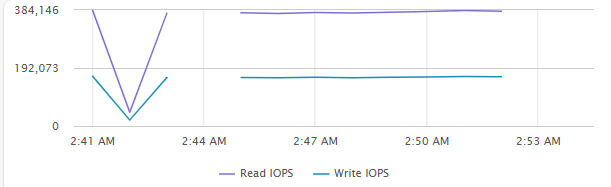
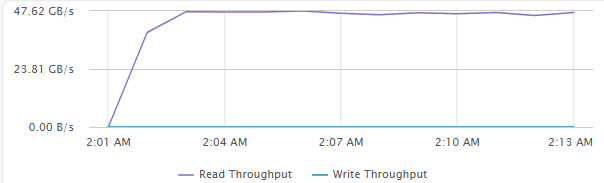
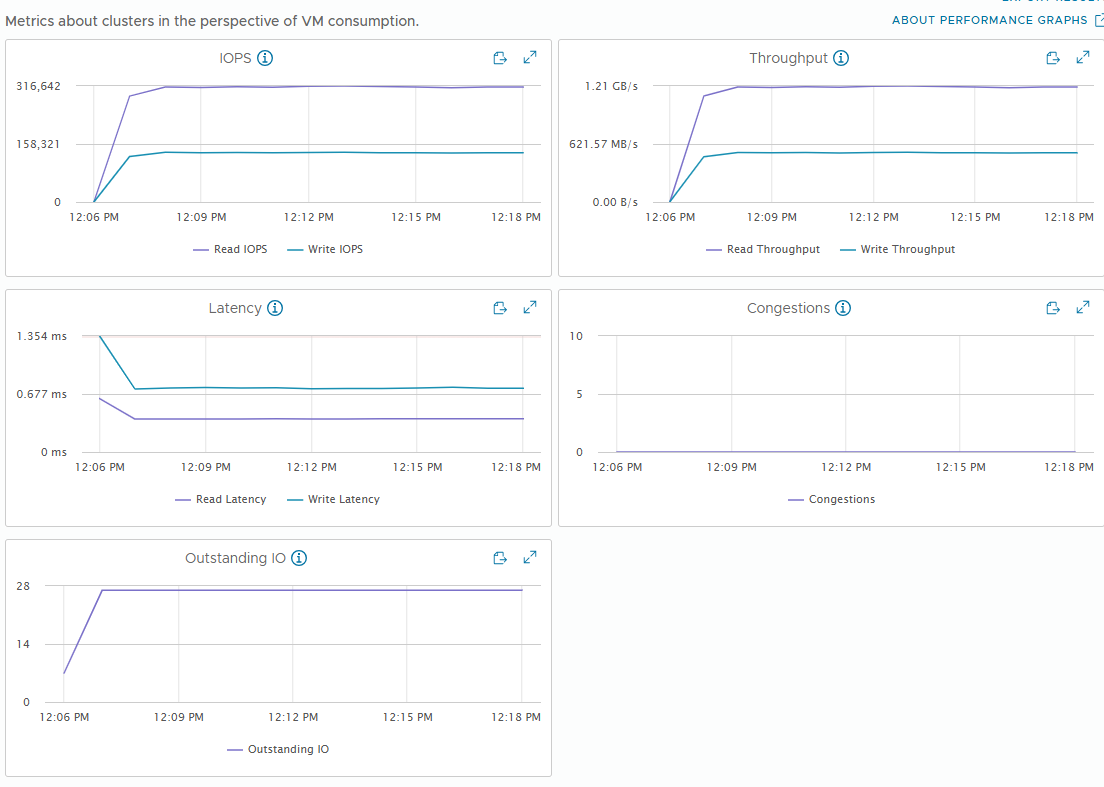
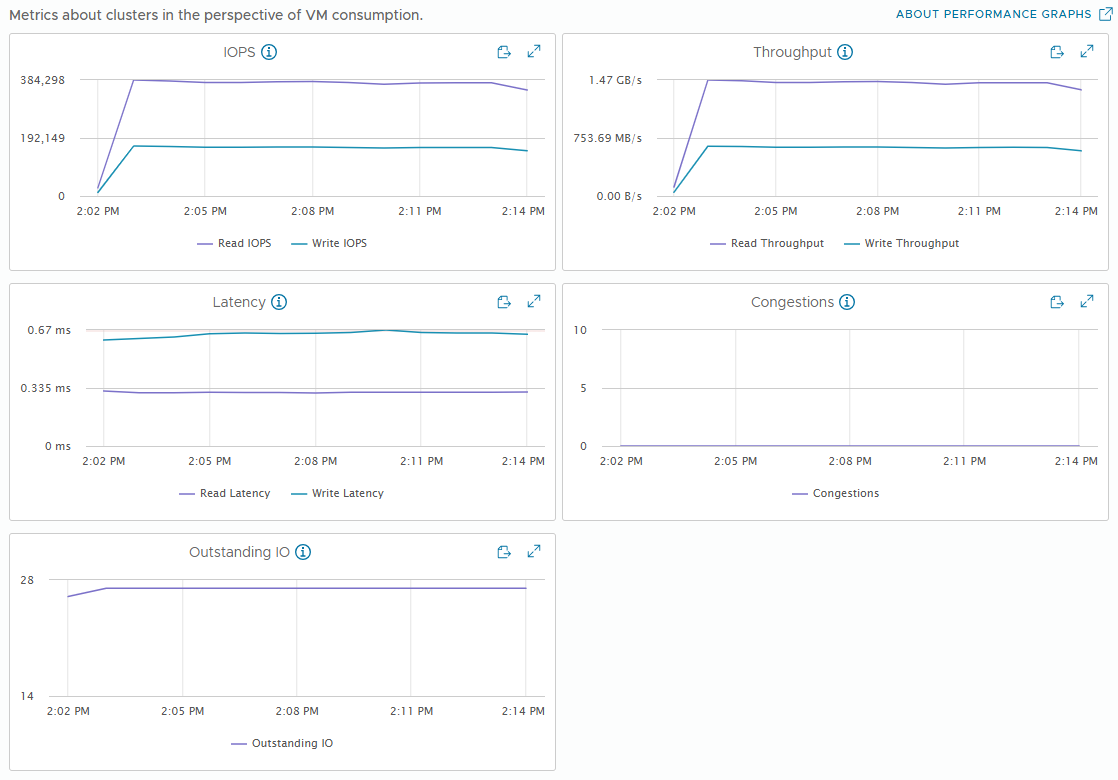
[Fig 2. VM IOPS Graph]
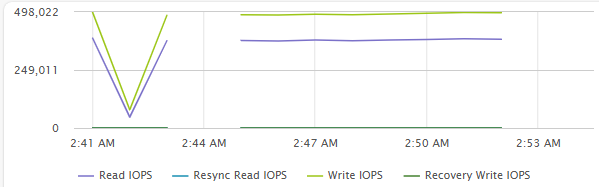
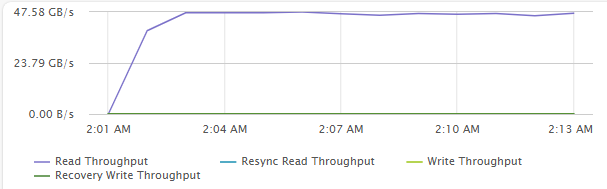
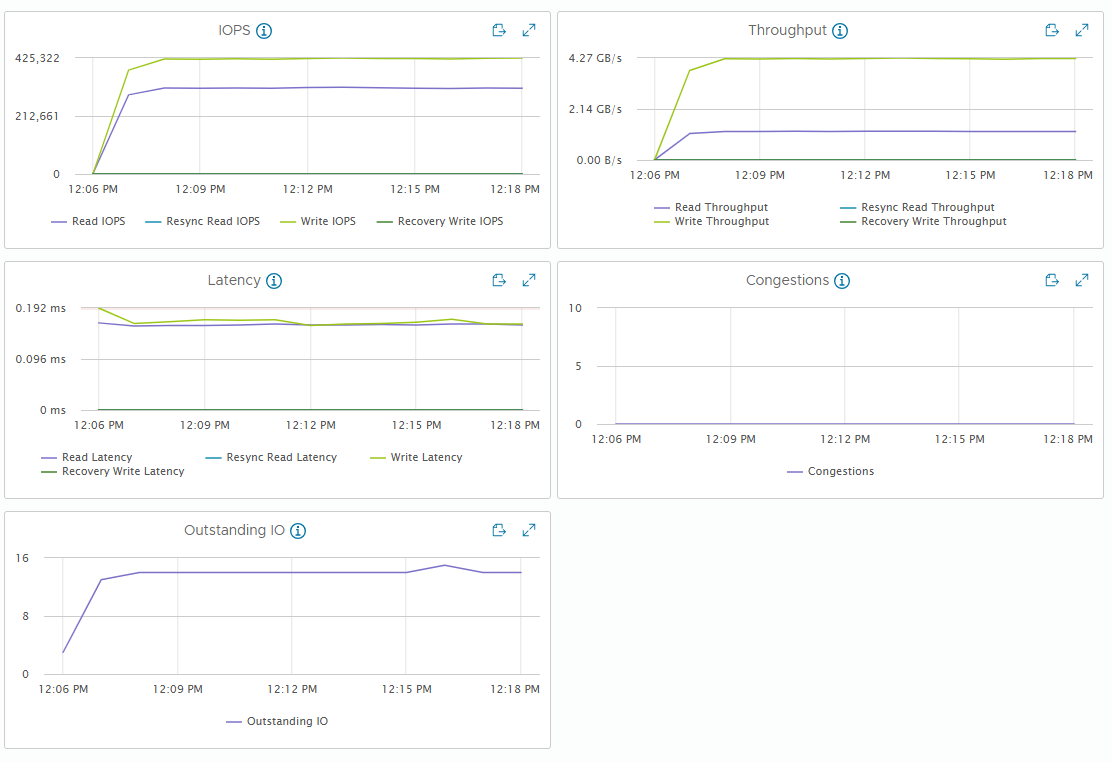
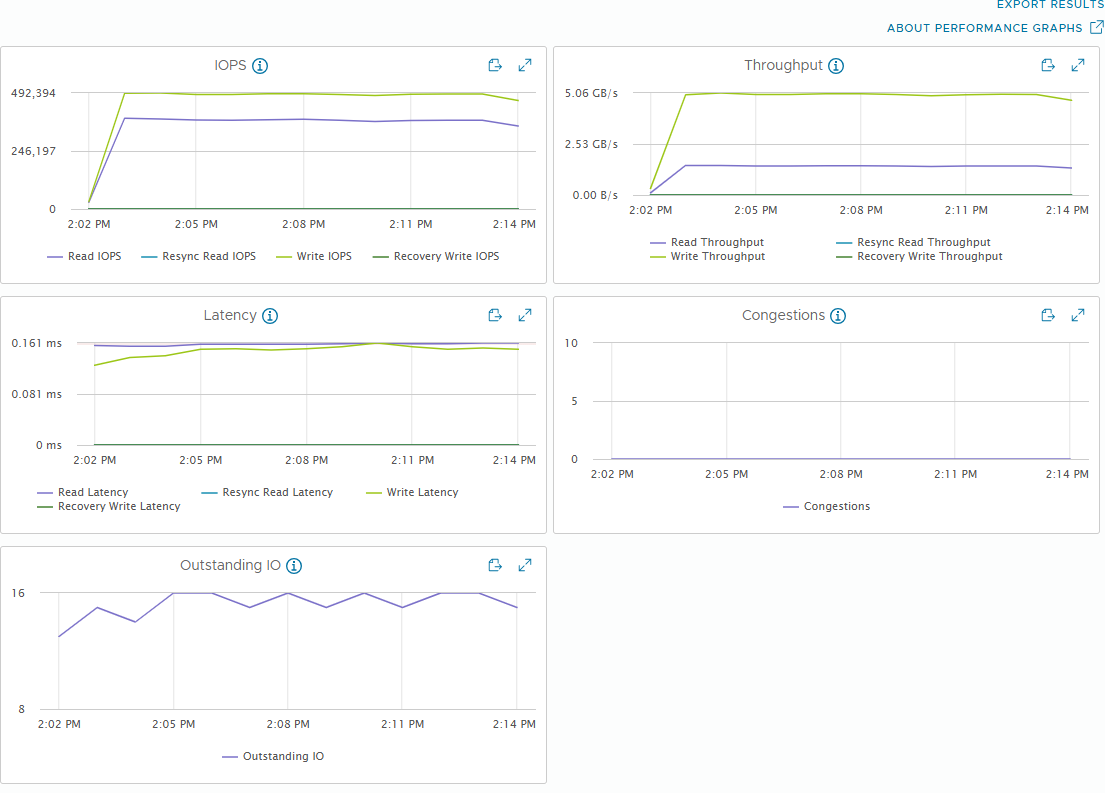
[Fig 3. Backend IOPS Graph]
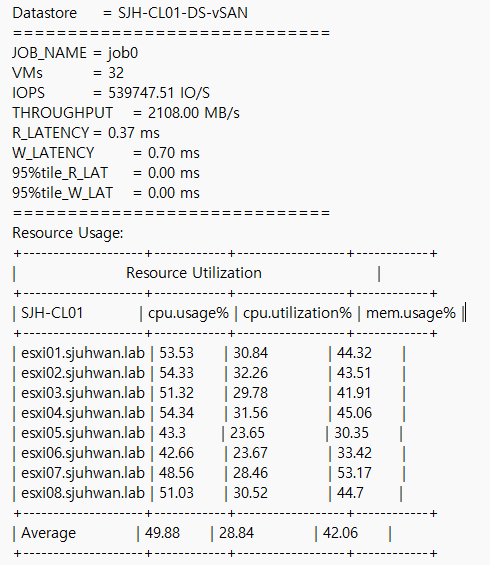
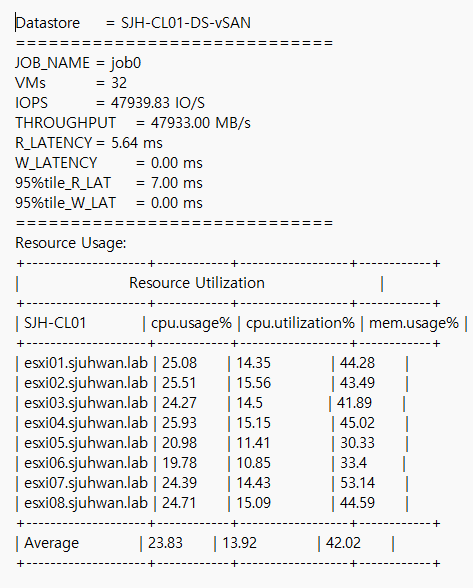
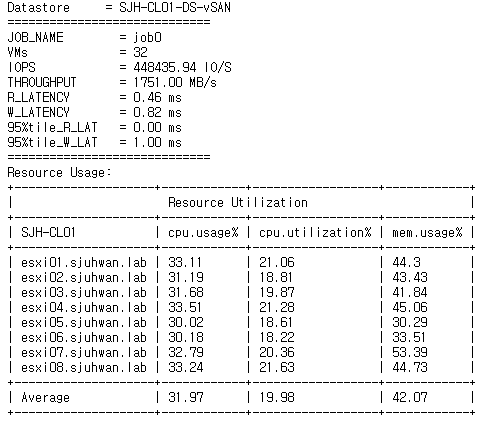
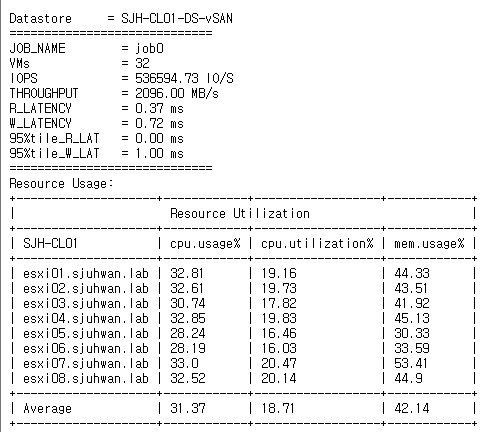
[Fig 4. Resource Consumption Data]
Maximum Throughput Test
- 32 VM (4 VM / Host)
- 4 vCPU / 4 VMDK / 8 Thread (QD=8)
- 1MiB Block Size
- R/W Ratio: 7:3
- Random 50%
- RDMA ON
- Performance Power Profile
[Fig 5. FIO Grafana Dashboard]
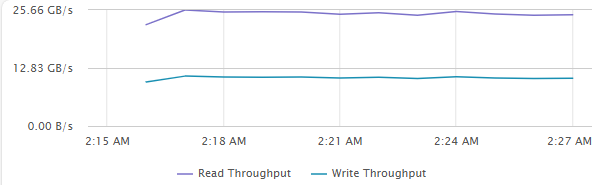
[Fig 6. VM Throughput Graph]
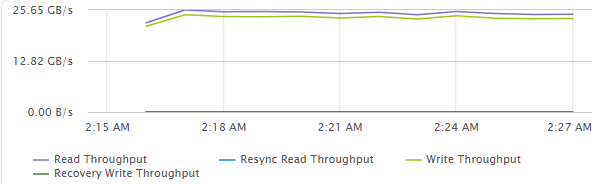
[Fig 7. Backend Throughput Graph]
[Fig 8. Resource Consumption Data]
Maximum Random IOPS Test
- 32 VM (4 VM / Host)
- 4 vCPU / 4 VMDK / 8 Thread (QD=8)
- 4KiB Block Size
- R/W Ratio: 7:3
- Random 100%
- RDMA ON
- Performance Power Profile
[Fig 9. FIO Grafana Dashboard]
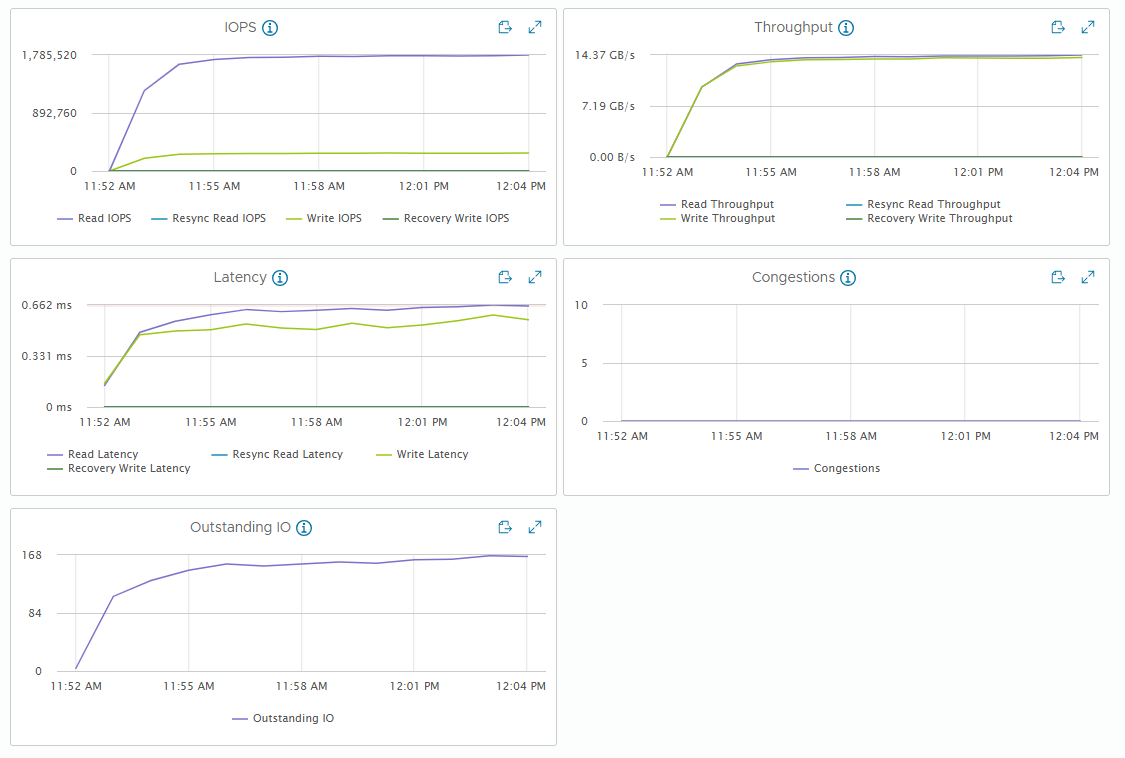
[Fig 10. VM IOPS Graph]
[Fig 11. Backend IOPS Graph]
[Fig 12. Resource Consumption Data]
Maximum Sequential Throughput Test
- 32 VM (4 VM / Host)
- 4 vCPU / 4 VMDK / 8 Thread (QD=8)
- 1MiB Block Size
- R/W Ratio: 10:0
- Random 0%
- RDMA ON
- Performance Power Profile

[Fig 13. FIO Grafana Dashboard]
[Fig 14. VM Throughput Graph]
[Fig 15. Backend Throughput Graph]
[Fig 16. Resource Consumption Data]
Performance Comparison between the RDMA On/Off
Maximum IOPS Test
- 32 VM (4 VM / Host)
- 4 vCPU / 4 VMDK / 8 Thread (QD=8)
- 4KiB Block Size
- R/W Ratio: 7:3
- Random 50%
- RDMA OFF
- Performance Power Profile
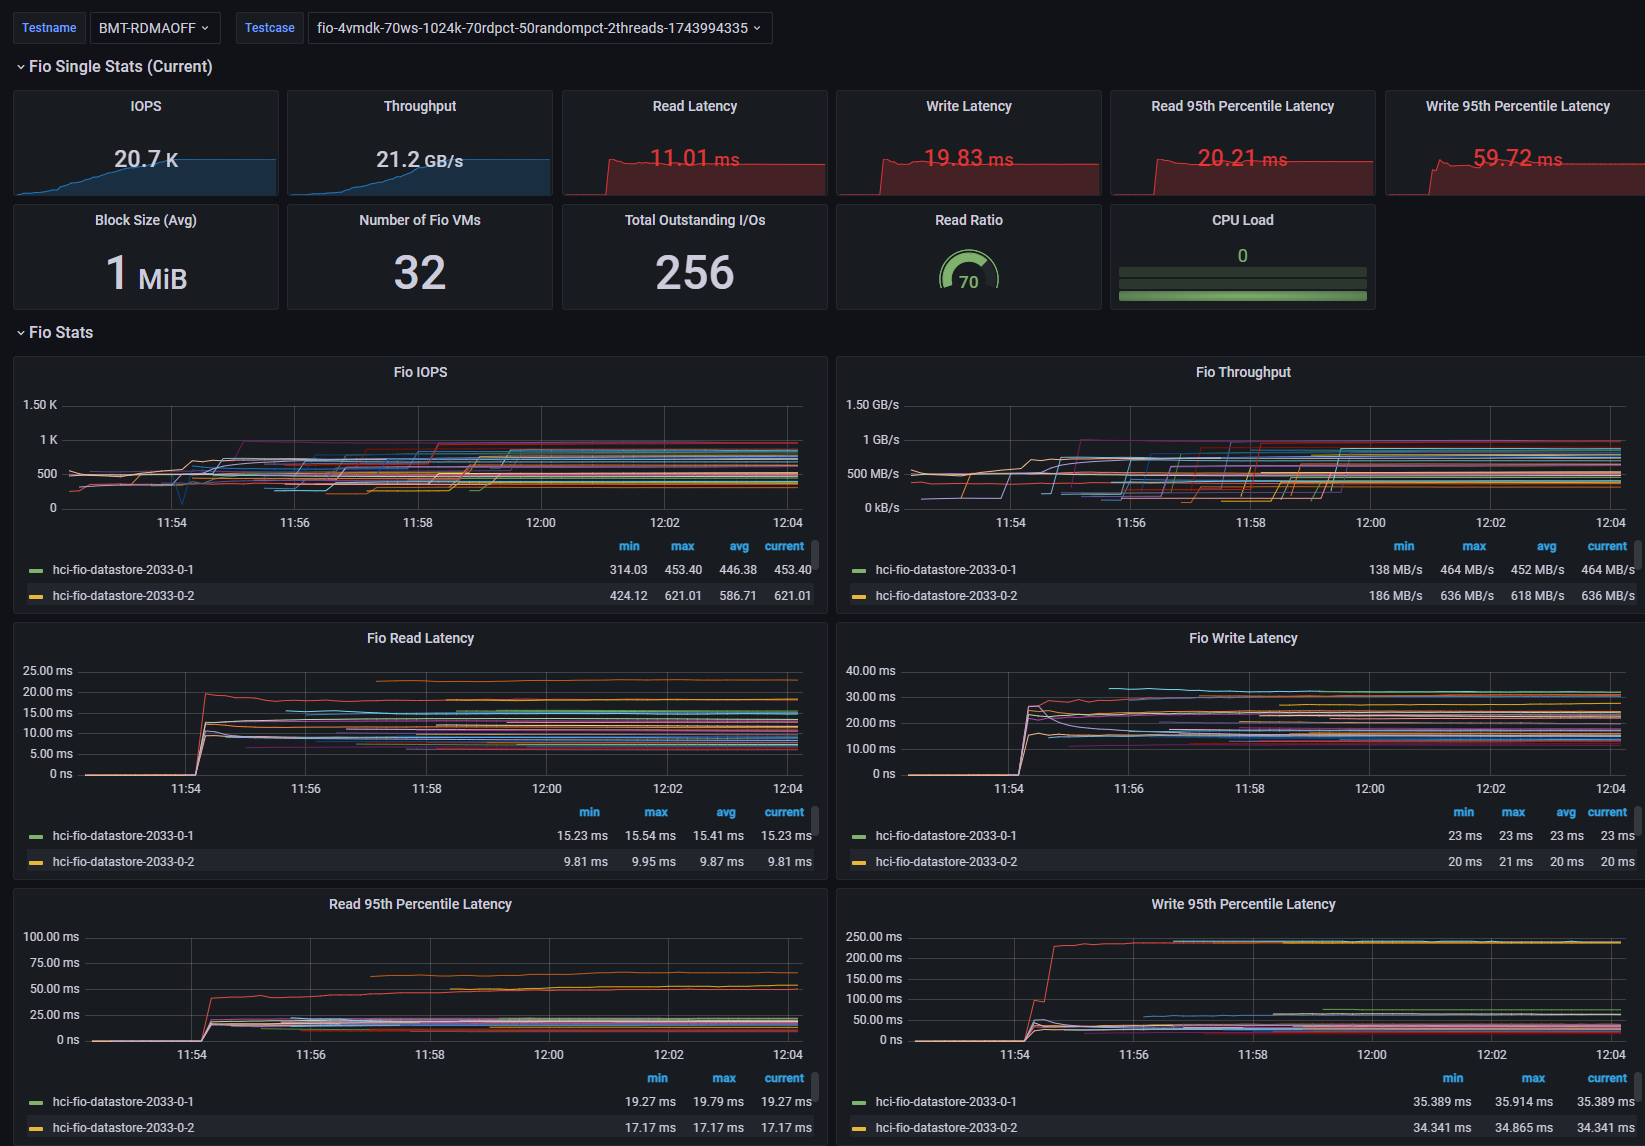
[Fig 17. FIO Grafana Dashboard]
[Fig 18. VM Metric Graph]
[Fig 19. Backend Metric Graph]
[Fig 20. Resource Consumption Data]
Maximum Throughput Test
- 32 VM (4 VM / Host)
- 4 vCPU / 4 VMDK / 8 Thread (QD=8)
- 1MiB Block Size
- R/W Ratio: 7:3
- Random 50%
- RDMA OFF
- Performance Power Profile
[Fig 21. FIO Grafana Dashboard]
[Fig 22. VM Throughput Graph]
[Fig 23. Backend Throughput Graph]
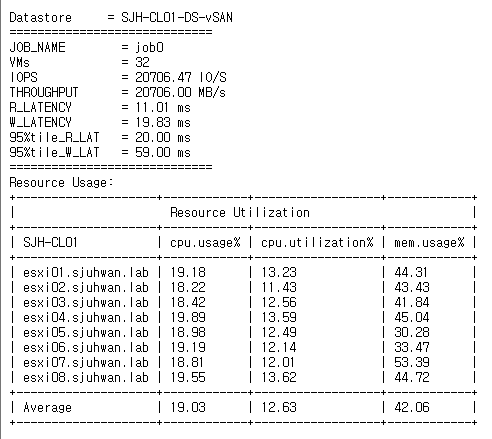
[Fig 24. Resource Consumption Data]
Performance Comparison between the power profiles
Maximum IOPS Test
- 32 VM (4 VM / Host)
- 4 vCPU / 4 VMDK / 8 Thread (QD=8)
- 4KiB Block Size
- R/W Ratio: 7:3
- Random 50%
- RDMA ON
- Balanced Power Profile
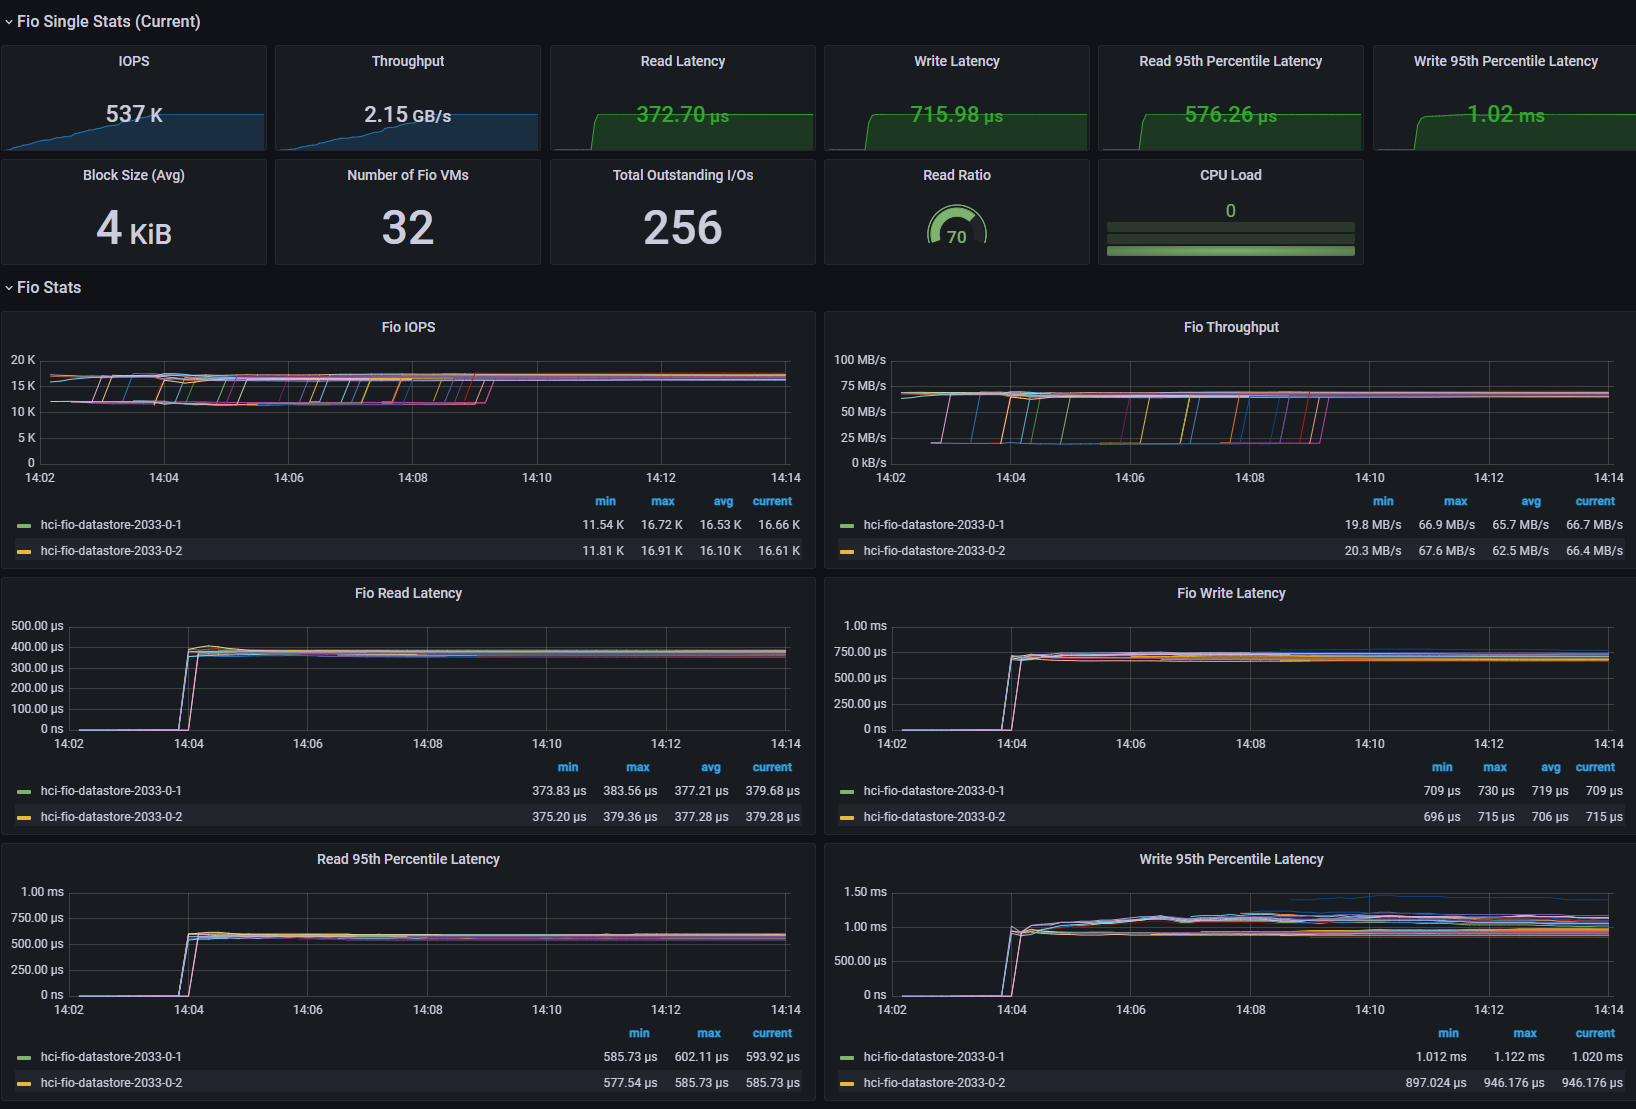
[Fig 25. FIO Grafana Dashboard]
[Fig 26. VM Metrics Graph]
[Fig 27. Backend Metrics Graph]
[Fig 28. Resource Consumption Data]
Maximum Throughput Test
- 32 VM (4 VM / Host)
- 4 vCPU / 4 VMDK / 8 Thread (QD=8)
- 1MiB Block Size
- R/W Ratio: 7:3
- Random 50%
- RDMA ON
- Balanced Power Profile
[Fig 29. FIO Grafana Dashboard]
[Fig 30. VM Metrics Graph]
[Fig 31. Backend Metrics Graph]
[Fig 32. Resource Consumption Data]
Result summarization
VM/backend metrics and implications
vSAN performance metrics have a distinction between VM and backend. VM metrics are performance from the VM perspective, while backend metrics are performance from the vSAN perspective.
VM metrics closely match what is measured by the application (in this case, FIO), while backend metrics can vary significantly based on workload patterns.
Perhaps the biggest difference is in Backend Writes, which is caused by vSAN sending a single write to multiple hosts to ensure high availability.
In the RDMA ON / Performance Power Profile, the Write Amplification Ratio for each case was as follows
- Max IOPS test: about 2.7x
- Max throughput test: about 2x
- Max random IOPS test: about 2.6x
If you have a performance target from a cluster throughput perspective, you need to design your entire cluster with this write amplification in mind.
Also, vSAN breaks up large block I/Os into chunks of about 28 KiB in size and sends them down to the backend devices.
When evaluating the performance of NVMe disks for vSAN ESA, it is good to see 4KiB and 32KiB I/O performance, and when vSAN ESA officially supports QLC, it is likely that these characteristics will be included in the Indirection Unit (IU) considerations.
Performance variance with RDMA
In the 4KiB test, I observed about a 20% reduction in throughput and a 120us increase in read/write latency.
In the 1MiB test, I observed about 56% throughput reduction, 6ms read latency, and 15ms write latency increase.
The backend I/O seems to be the bottleneck, reaching 1.785 MIOPS in the 1MiB test, which contributed to the overall VM latency increase.
For CPU utilization, I was consistently saw about 10% lower utilization in the RDMA-less case, but this was due to the relatively lower throughput, which reduced the load on vSAN.
In conclusion, RDMA allows us to have a much higher backend I/O cap, along with higher CPU utilization-to-performance ratio. Therefore, RDMA should be strongly considered when implementing vSAN ESA
Performance variation by power profile
In the 4KiB test, I saw a decrease in throughput and an increase in latency that was within the margin of error.
On the other hand, in the 1MiB test, we observed a throughput reduction of approximately 28% and an increase in read latency of 4ms.
In a typical workload environment, not heavy, bandwidth-intensive workloads, there is little performance difference between Balanced and Performance, but if you are running bandwidth-intensive workloads, you should consider setting the power profile to Performance.
Closing
In this post, we evaluated the performance of vSAN ESA in an 8-node configuration with 4 NVMe SSDs per node. With the exception of the 1MiB / Non-RDMA case, we didn't see any performance bottlenecks in any of the other test cases, so there is plenty of potential for higher peak performance as VMs scale out.
vSAN ESA is capable of delivering high performance even in near-minimum configurations, with significant performance variation between RDMA and Power profile configurations, especially at large block sizes.
If you are considering adopting vSAN ESA, you may want to consider deploying a 100GbE RoCEv2-enabled network environment to maximize its potential.

레이어 별로 성능 수집 결과가 매우 흥미롭네요.
시간내어 진행하신 조건과 결과를 다시 한번 보아야 겠어요.