⬜딥러닝
◾Mask Man
1. 개요
- 얼굴 사진을 이용해 마스크 착용 여부 인식
- 데이터 : Kaggle
2. 데이터 준비
- 압축 관리 툴을 이용해 압축풀기
import zipfile

# 파일 압축 해제
content_zip = zipfile.ZipFile('''./data/02/Face Mask Dataset.zip''')
content_zip.extractall('''./data/02/''')
# 객체 종료
content_zip.close()- 압축 해제 확인
%ls .\\data\\02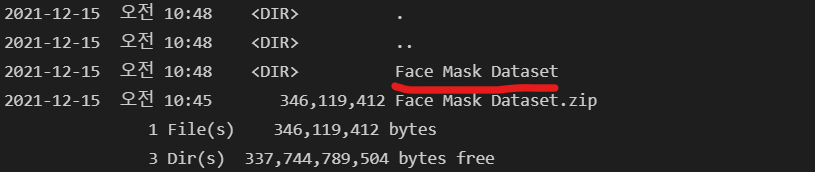
- 사용 모듈 import
import numpy as np
import pandas as pd
import os
import glob
import matplotlib.pyplot as plt
import seaborn as sns

import tensorflow as tf
from tensorflow.keras import models
from tensorflow.keras.layers import Flatten, Dense, Conv2D, MaxPooling2D, Dropout
from sklearn.model_selection import train_test_split
from sklearn.metrics import classification_report, confusion_matrix
3. 데이터 정리
- 데이터 읽기
- 각 폴더의 사진 읽기
path = './data/02/Face Mask Dataset/'
dataset = {"image_path" : [], "mask_status" : [], "where" : []}

for where in os.listdir(path):
    for status in os.listdir(path + "/" + where):
        for image in glob.glob(path + where + '/'+status + '/' + '*.png'):
            dataset['image_path'].append(image)
            dataset['mask_status'].append(status)
dataset['where'].append(where)- Pandas의 DataFrame로 정리
dataset = pd.DataFrame(dataset)
dataset.head()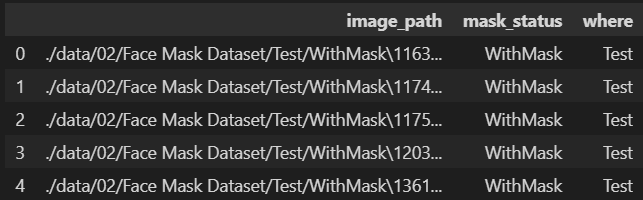
- 데이터 분포 확인
- 마스크 착용 분포 확인
print('With Mask : ', dataset.value_counts("mask_status")[0])
print('Without Mask : ', dataset.value_counts("mask_status")[1])

sns.countplot(x=dataset["mask_status"]);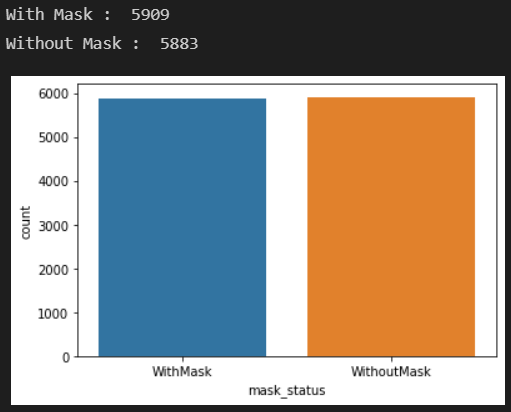
- 이미지 확인
- OpenCV를 활용해 이미지 확인
import cv2

plt.figure(figsize=(15, 10))
for i in range(9):
    random = np.random.randint(1, len(dataset))
    plt.subplot(3, 3, i+1)
    plt.imshow(cv2.imread(dataset.loc[random, "image_path"]))
    plt.title(dataset.loc[random, "mask_status"], size=15)
    plt.axis('off')
plt.show()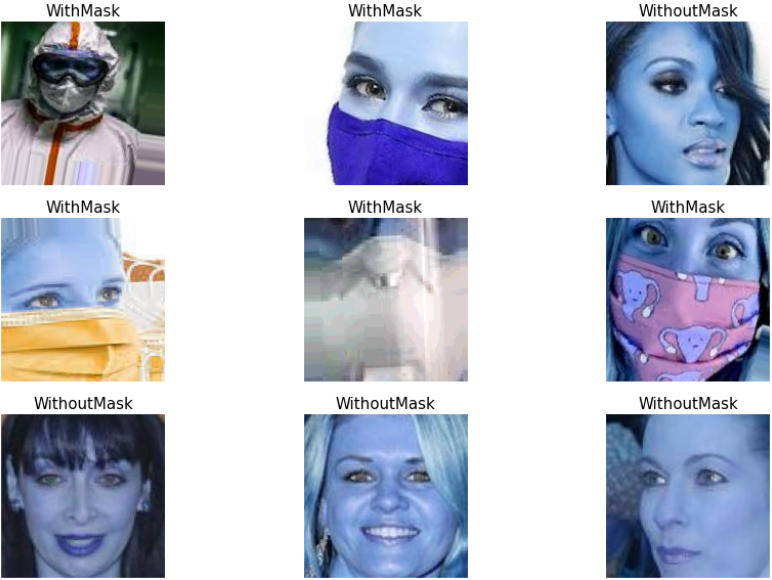
- 데이터 분리 및 분포 확인
- 각 폴더에 맞게 데이터 분리
train_df = dataset[dataset['where'] == 'Train']
test_df = dataset[dataset['where'] == 'Test']
valid_df = dataset[dataset['where'] == 'Validation']

# 인덱스 정리 진행
train_df = train_df.reset_index(drop=True)
test_df = test_df.reset_index(drop=True)
valid_df = valid_df.reset_index(drop=True)

train_df.head(2)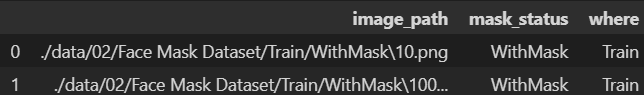
- Train/Test/Validation 분포 확인
- Test에서 마스크 미착용이 조금 더 많지만 대체로 비슷한 분포를 보인다.
plt.figure(figsize=(15, 5))

plt.subplot(1, 3, 1)
sns.countplot(x=train_df['mask_status'])
plt.title("Training Dataset", size=10)

plt.subplot(1, 3, 2)
sns.countplot(x=test_df['mask_status'])
plt.title("Test Dataset", size=10)

plt.subplot(1, 3, 3)
sns.countplot(x=valid_df['mask_status'])
plt.title("Validation Dataset", size=10)

plt.show()
4. 데이터 전처리
- 이미지 조절
- 이미지 사이즈를 [150 X 150] 조절한다.
data = []
image_size = 150

for i in range(len(train_df)):
    # 이미지 Grayscale로 변경
    img_array = cv2.imread(train_df['image_path'][i], cv2.IMREAD_GRAYSCALE)

    # 이미지 사이즈 조절
    new_image_array = cv2.resize(img_array, (image_size, image_size))

    # 새로운 이미지와 라벨 인코딩
    # 1 : 마스크 착용
    # 0 : 마스크 미착용
    if train_df['mask_status'][i] == "WithMask":
        data.append([new_image_array, 1])
    else:
data.append([new_image_array, 0])- Data 쏠림 현상이 있을 수 있으므로 shuffle 해준다.
np.random.shuffle(data)
data[0]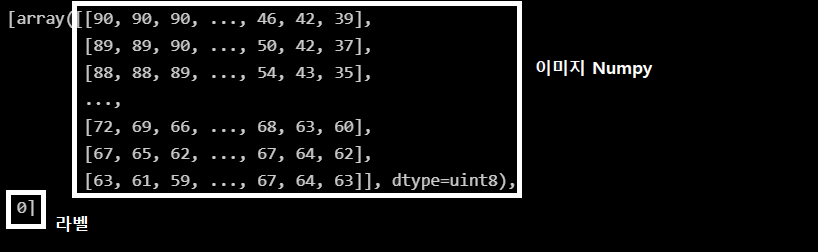
- 이미지 확인
fig, ax = plt.subplots(2, 3, figsize=(10, 6))

for row in range(2):
    for col in range(3):
        image_index = row * 100 + col

        ax[row, col].axis('off')
        ax[row, col].imshow(data[image_index][0], cmap='gray')

        if data[image_index][1] == 0:
            ax[row, col].set_title("Without Mask")
        else:
            ax[row, col].set_title("With Mask")
plt.show()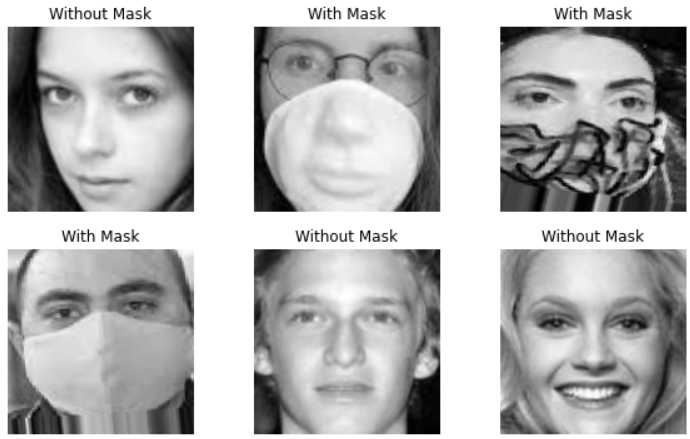
- 데이터 분리
- X : 이미지 데이터
- y : 라벨(마스크 착용여부)
X = []
y = []

for image, label in data:
    X.append(image)
    y.append(label)

X = np.array(X)
y = np.array(y)

X.shape, y.shape
- Train 데이터를 8 : 2 로 분리
X_train, X_val, y_train, y_val = train_test_split(X, y, test_size=0.2, random_state=13)5. 모델
- 모델 구현
- LeNet을 기본으로 모델 구현
model = models.Sequential([
                        Conv2D(32, kernel_size=(5, 5), strides=(1, 1), padding='same', activation='relu', input_shape=(150, 150, 1)),
                        MaxPooling2D(pool_size=(2, 2), strides=(2, 2)),
                        Conv2D(64, (2, 2), activation='relu', padding='same'),
                        MaxPooling2D(pool_size=(2, 2)),
                        Dropout(0.25),
                        Flatten(),
                        Dense(1000, activation='relu'),
                        Dense(1, activation='sigmoid')
                   ])

model.summary()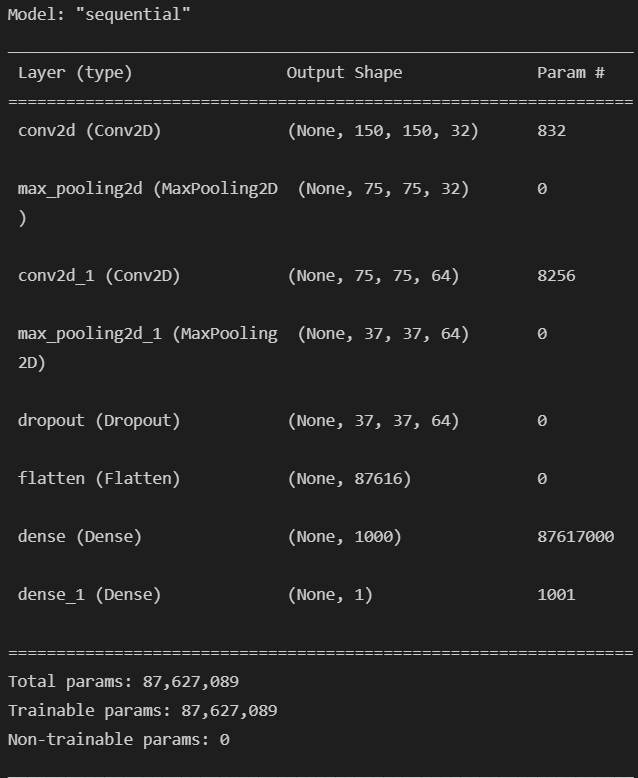
- 모델 compile
model.compile(
    optimizer='adam', loss=tf.keras.losses.BinaryCrossentropy(),
    metrics=["accuracy"]
)
- 모델 학습
- 학습에 많은 시간이 걸려 colab을 활용할 수 있다.
X_train = X_train.reshape(len(X_train), X_train.shape[1], X_train.shape[2], 1)
X_val = X_val.reshape(len(X_val), X_val.shape[1], X_val.shape[2], 1)

history = model.fit(X_train, y_train, epochs=4, batch_size=32)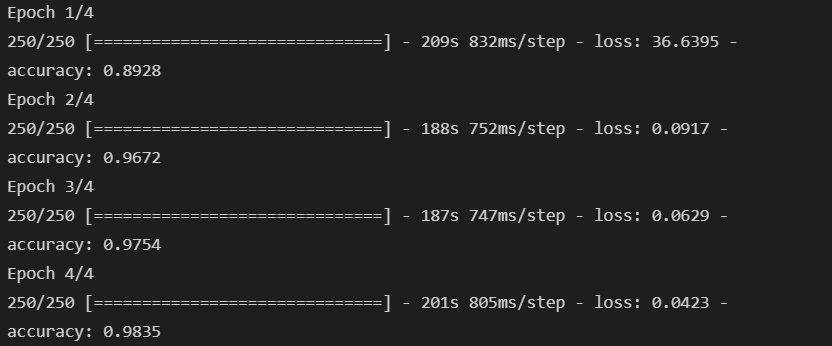
- 모델 평가
- val 데이터를 이용해 평가
model.evaluate(X_val, y_val)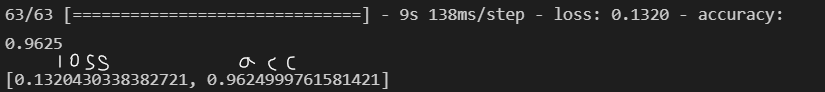
- classification_report, confusion_matrix 확인
prediction = (model.predict(X_val) > 0.5).astype("int32")

print(classification_report(y_val, prediction))
print(confusion_matrix(y_val, prediction))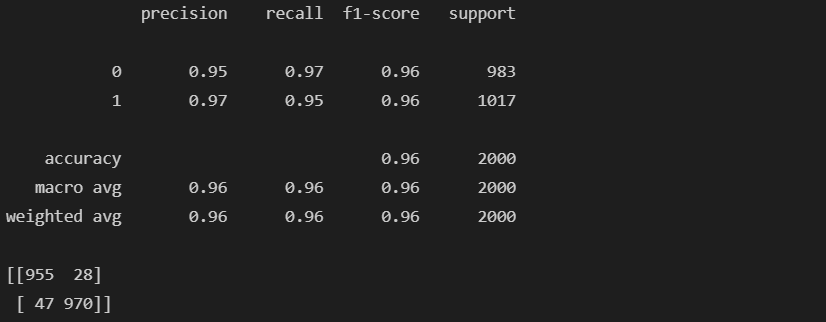
- 잘못 예측한 데이터 확인
- 잘못 예측한 경우 추출
wrong_result = []

for n in range(0, len(y_val)):
    if prediction[n] != y_val[n]:
        wrong_result.append(n)

len(wrong_result)
- 잘못 예측한 경우의 이미지 출력
import random

samples = random.choices(population=wrong_result, k = 6)

plt.figure(figsize=(14, 12))
for idx, n in enumerate(samples):
    plt.subplot(2, 3, idx + 1)
    plt.imshow(X_val[n].reshape(150, 150), interpolation="nearest")
    plt.title(prediction[n])
    plt.axis('off')
plt.show()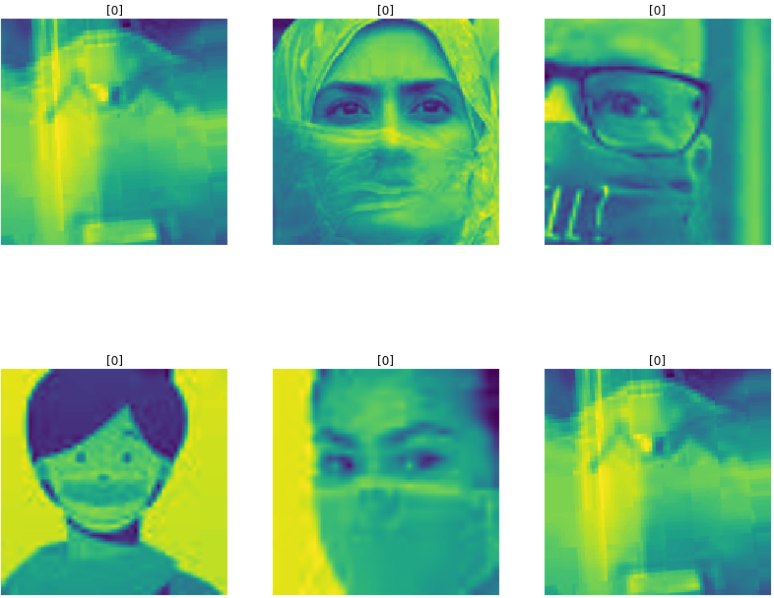

후라이드 치킨