◼import
import pandas as pd
import numpy as np
import matplotlib.pyplot as plt

from matplotlib import rc
%matplotlib inline
plt.rcParams["axes.unicode_minus"] = False
rc('font', family='Malgun Gothic')

from bs4 import BeautifulSoup
from urllib.request import urlopen
from tqdm import notebook
◼개요
- 네이버 영화 메인 페이지 링크
- 영화랭킹 평점순(현재상영영화) 링크
- https://movie.naver.com/movie/sdb/rank/rmovie.naver?sel=cur&date=20210926
date=날짜: 날짜를 변경하여 다른 날짜에 접근할 수 있다.
◼데이터 분석 시작
- 테스트 : 20180315로 접근
url = "https://movie.naver.com/movie/sdb/rank/rmovie.naver?sel=cur&date=20180315"
page = urlopen(url)

soup = BeautifulSoup(page, "html.parser")
print(soup.prettify())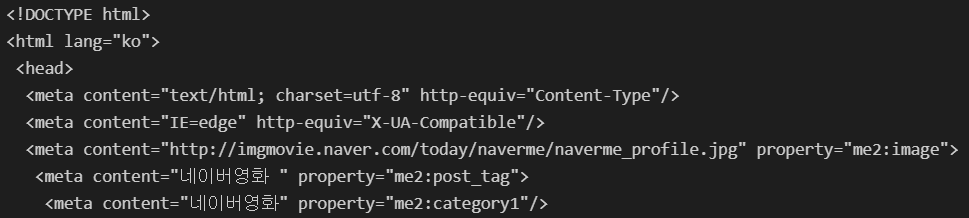
- 개발자 도구를 활용해 태그 확인
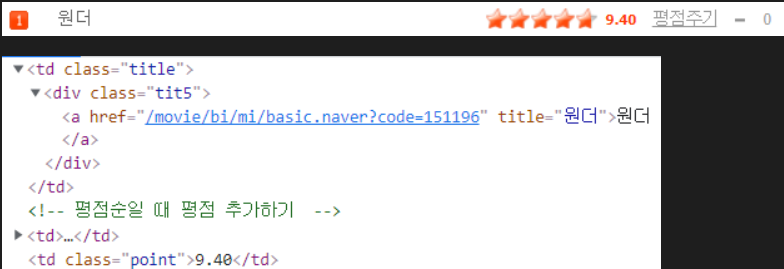
- 영화 제목 :
<td class = "title"> > <div class = "tit5"> > <a> - 영화 평점 :
<td class = "point">
- 영화 제목 :
- 영화 제목 확인
# 영화 제목 확인
len(soup.find_all("div", class_="tit5")), soup.find_all("div", class_="tit5")[:5]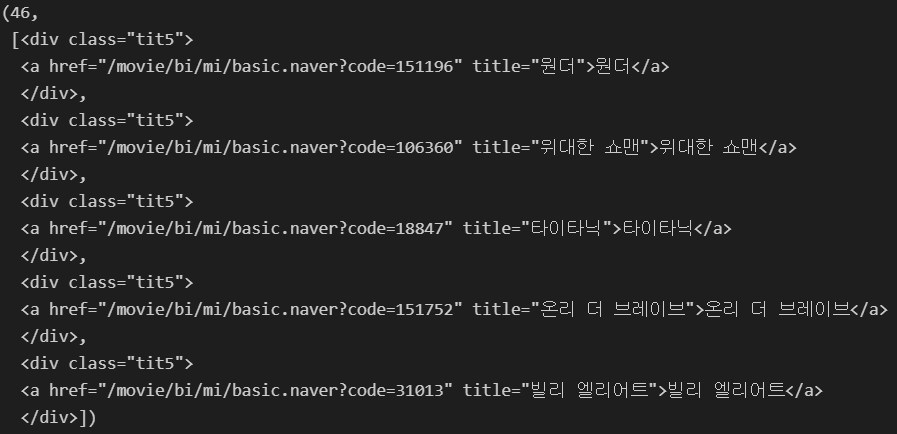
# div 태그안의 a 태그 확인 => a 태그로 접근
soup.find_all("div", class_="tit5")[0].a

# string, text, get_text()로 텍스트 추출
soup.find_all("div", class_="tit5")[0].a.string

- 영화 평점 확인
len(soup.find_all("td", class_="point")), soup.find_all("td", class_="point")[:5]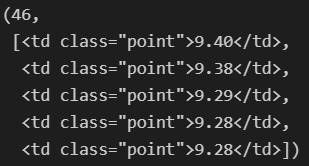
- 매 페이지마다 영화의 수가 다르므로 수를 확인하고 for문을 사용한다.
# 영화 제목 리스트
end = len(soup.find_all('div', class_='tit5'))
movie_name = [soup.find_all('div', class_='tit5')[n].a.string for n in range(0, end)]
# 데이터 확인
len(movie_name), movie_name[:5]

# 영화 평점 리스트
end = len(soup.find_all('td', class_='point'))
movie_point = [soup.find_all('td', class_='point')[n].string for n in range(0, end)]
# 데이터 확인
len(movie_point), movie_point[:5]

◼데이터 확보
- 여러 날짜의 데이터 확보
pd.date_range: 원하는 날짜를 얻을 수 있다.
# 날짜 생성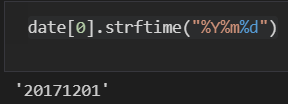
date = pd.date_range("2017.12.01", periods=100, freq="D")strftime("형식"): 날짜 데이터 출력 변경%Y: 년 /%m: 월 /%d: 일
- 데이터 확보
import time

movie_date = []
movie_name = []
movie_point = []

for today in notebook.tqdm(date):
    html = "https://movie.naver.com/movie/sdb/rank/rmovie.naver?sel=cur&date={day}"
    response = urlopen(html.format(day=today.strftime("%Y%m%d")))
    soup = BeautifulSoup(response, "html.parser")

    end = len(soup.find_all("td", class_='point'))

    movie_date.extend([today for n in range(0, end)])
    movie_name.extend([soup.find_all("div", class_='tit5')[n].a.string for n in range(0, end)])
    movie_point.extend([soup.find_all("td", class_='point')[n].string for n in range(0, end)])
    # 속도 조절을 위해 사용
    time.sleep(0.5)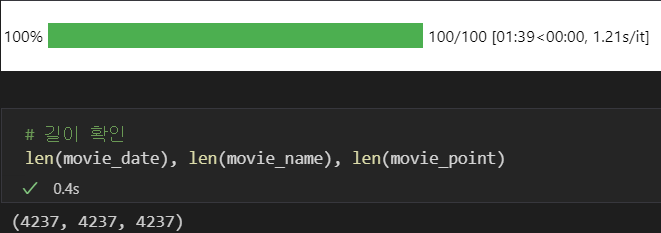
- 데이터 추가
movie = pd.DataFrame({
	"date" : movie_date,
    "name" : movie_name,
    'point' : movie_point}
)
movie.head()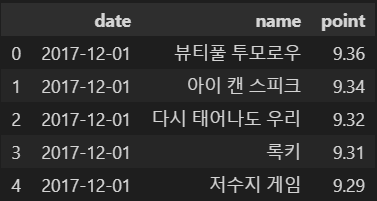
- 데이터 프레임 확인
- point가 object임을 확임
astype: 타입 변경
movie["point"] = movie["point"].astype(float)
movie.info()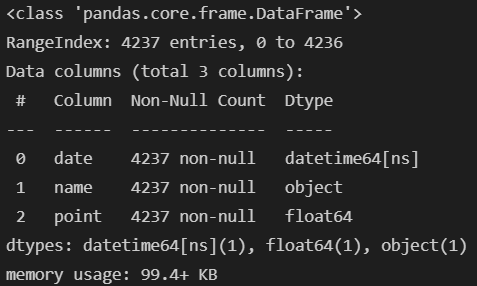
- 데이터 저장
movie.to_csv("../data/03/03. naver_movie_raw_data.csv", sep=',', encoding="utf-8")◼데이터 정리 및 시각화
- 데이터 읽기
movie = pd.read_csv("../data/03. naver_movie_raw_data.csv", encoding='utf-8', index_col=0)
movie.head()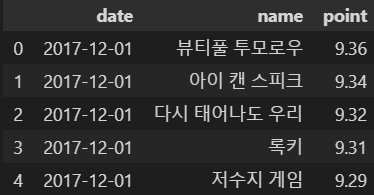
- 영화 이름을 기준으로 데이터 정리
- pivot_table
- 영화 이름 기준, 평점 합산
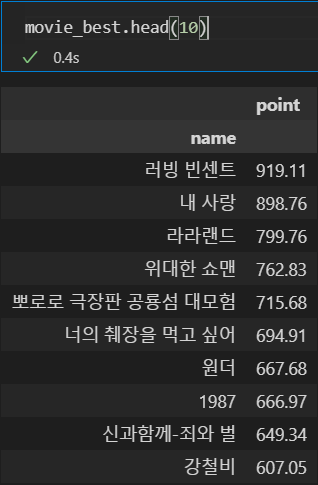
movie_unique = pd.pivot_table(movie, index=["name"], aggfunc=np.sum)
movie_best = movie_unique.sort_values(by="point", ascending=False)
movie_best.head(10)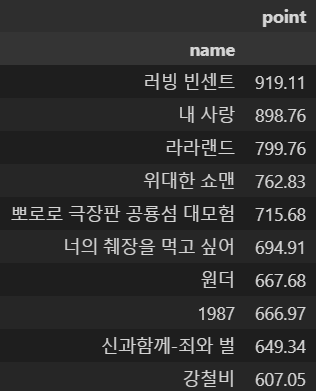
query(): DataFrame 검색 명령
tmp = movie.query('name==["강철비"]')
tmp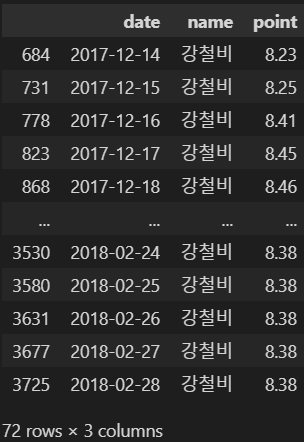
- 강철비 날짜별 시각화
# 강철비의 날짜별 평점 그래프
plt.figure(figsize=(20, 8))
plt.plot(tmp['date'], tmp.get('point')) # 선 그래프 x축 날짜, y축 평점
plt.title("날짜별 평점")
plt.xlabel('날짜')
plt.ylabel('평점')
plt.xticks(rotation="vertical")
plt.legend(labels=["평점 추이"], loc="best")
plt.grid(True)
plt.show()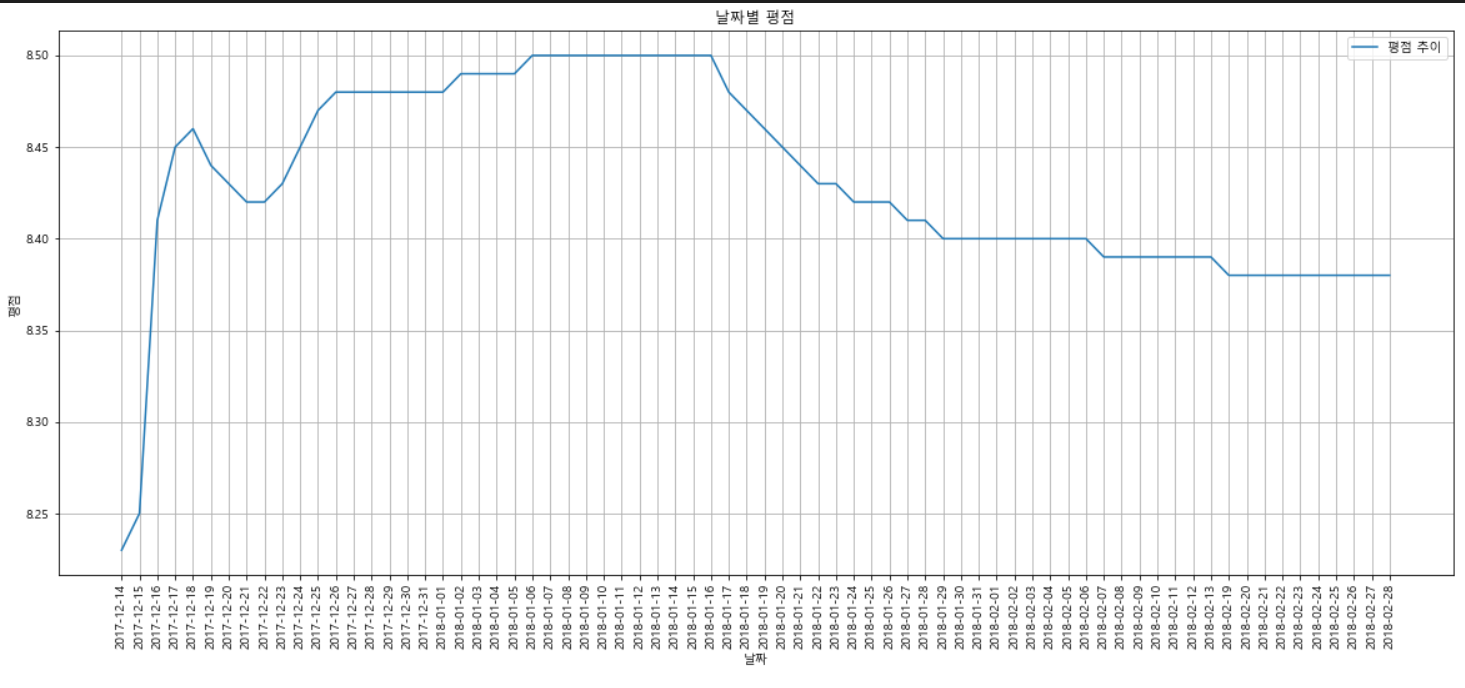
- 평점 합계 top10
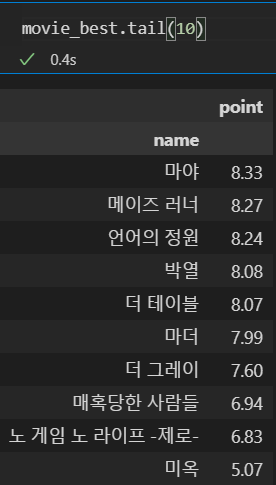
- 평점 합계 worst 10
- 날짜별 기준으로 정렬
- pivot_table
- 날짜 기준, 영화 이름 컬럼, 평점 값
movie_pivot = pd.pivot_table(movie, index=["date"], columns=["name"], values=["point"])
movie_pivot.head(2)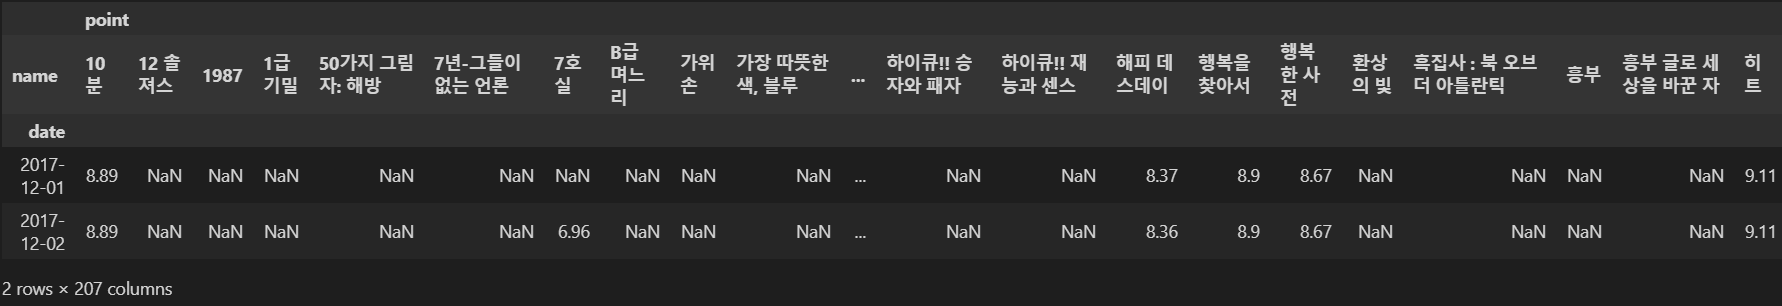
- 데이터 저장
movie_pivot.to_excel("../data/03/03. movie_pivot.xlsx")- 몇 가지의 영화 시각화
target_col = ["신과함께-죄와 벌", "1987", "너의 췌장을 먹고 싶어", "공범자들", "범죄도시"]

plt.figure(figsize=(20, 8))
plt.title("날짜별 평점")
plt.xlabel('날짜')
plt.ylabel('평점')
plt.plot(movie_pivot[target_col])
plt.xticks(rotation="vertical")
plt.legend(labels=target_col, loc="best")
plt.grid(True)
plt.tick_params(bottom="off", labelbottom="off")
plt.show()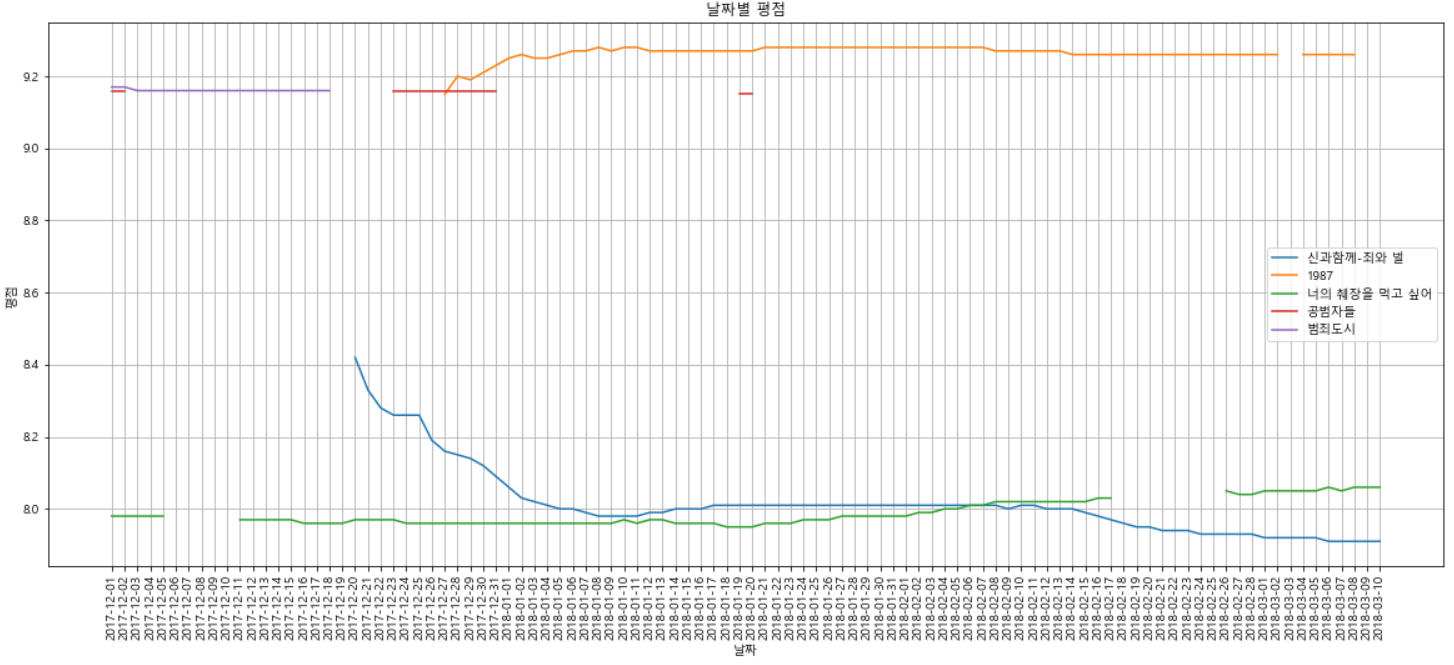

후라이드 치킨