CloudNet@에서 진행하는 Istio Study 6주차 11장 내용입니다.
📕 This chapter cover
- Understanding the factors of control-plane performance
- How to monitor performance
- What are the key performance metrics
- Understanding how to optimize performance
11.1 The control plane’s primary goal
성능 저하될 때 발생하는 흔한 증상을 ‘유령 워크로드 phantom workload’ 라고 하는데, 이미 사라진 엔드포인트로 트래픽을 라우팅하도록 서비스가 설정돼 있으므로 요청이 실패한다.
- 아래 그림은 유령 워크로드 개념
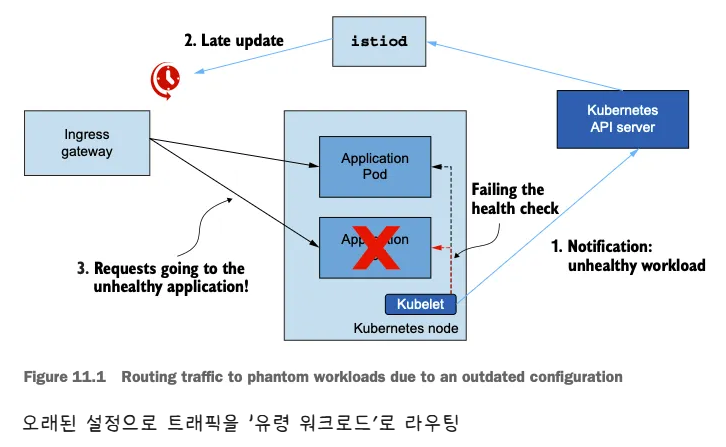
- 비정상이 된 워크로드가 이벤트를 트리거한다.
- 업데이트가 지연되면 서비스가 낡은 설정을 지니게 된다.
- 오래된? 설정 때문에 서비스가 트래픽이 존재하지 않은 워크로드로 라우팅한다.
11.1.1 Understanding the steps of data-plane synchronization
디바운스와 스로틀링
- 데이터 플레인을 원하는 상태로 동기화하는 과정은 여러 단계로 수행된다.
- 컨트롤 플레인은 쿠버네티스에서 이벤트를 수신한다.
- 이벤트는 엔보이 설정으로 변환돼 데이터 플레인의 서비스 프록시로 푸시된다.
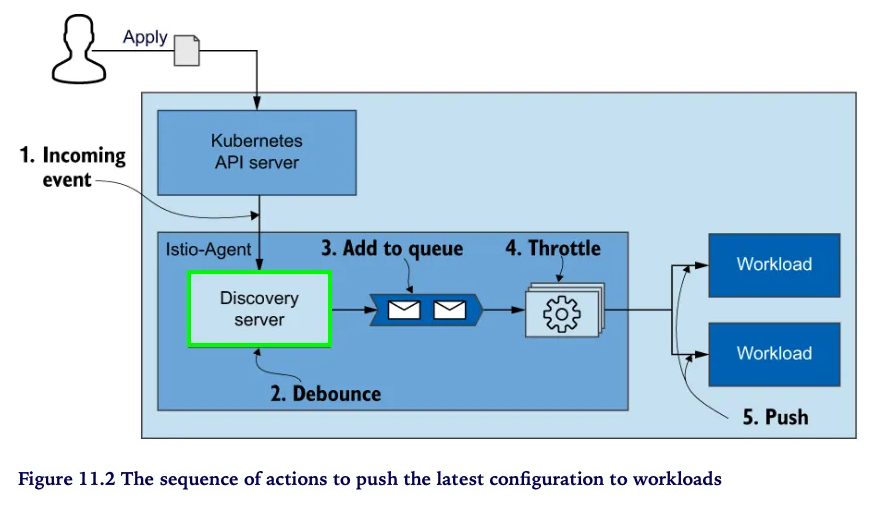
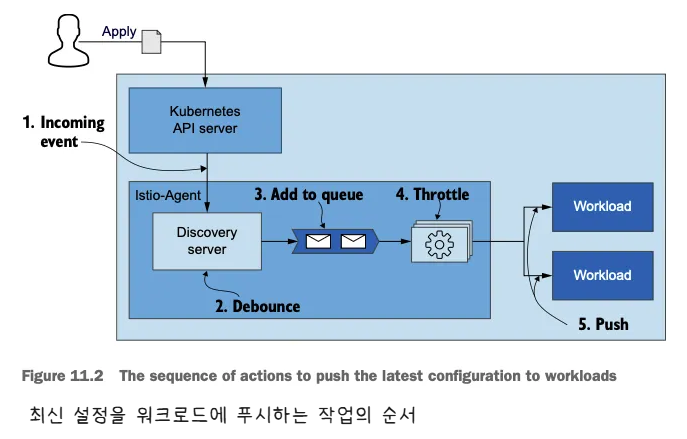
- 아래 그림은 들어오는 변경 사항에 맞춰 데이터 플레인을 동기화하는 단계를 순서대로 보여준다.
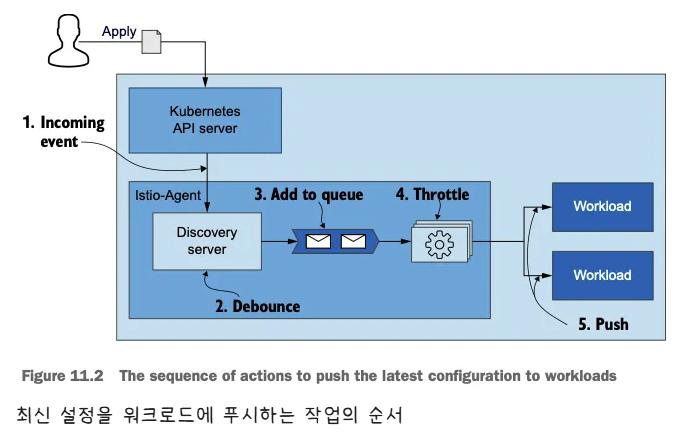
- 들어오는 이벤트가 동기화 과정을 시작한다.
- istiod 의 DiscoveryServer 구성 요소가 이 이벤트들을 수신한다.
- 성능을 향상시키기 위해, 푸시 대기열에 이벤트를 추가하는 작업을 일정 시간 미루고 그 동안의 후속 이벤트를 병합해 일괄 처리한다.
- 이를 ‘디바운스 debounce 한다’고 말하는데, 디바운스는 시간을 잡아먹는 작업이 너무 자주 실행되지 않도록 해준다.
- 지연 시간이 만료되면, DiscoveryServer가 병합된 이벤트를 푸시 대기열에 추가한다. 푸시 대기열은 처리 대기 중인 푸시 목록을 유지 관리한다.
- istiod 서버는 동시에 처리되는 푸시 요청 개수를 제한 throttle 하는데, 이는 처리 중인 항목이 더 빨리 처리되도록 보장하고 CPU 시간이 작업 간 콘텍스트 스위칭에 낭비되는 것을 방지한다.
- 처리된 항목은 엔보이 설정으로 변환돼 워크로드로 푸시된다.
11.1.2 Factors that determine performance
변경 속도, 할당된 리소스, 업데이트할 워크로드 개수, 설정 크기
- 동기화 프로세스를 잘 이해하면, 컨트롤 플레인의 성능에 영향을 미치는 요소를 자세히 설명할 수 있다.
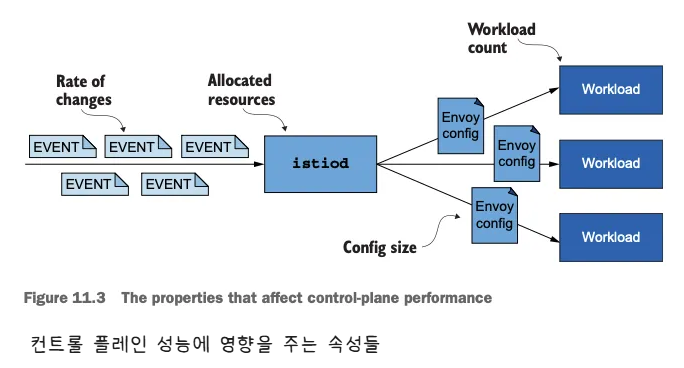
- 변경 속도 The rate of changes
- 변경 속도가 빠를수록 데이터 플레인을 동기화 상태로 유지하는 데 더 많은 처리가 필요하다.
- 할당된 리소스
- 수요가 istiod에 할당된 리소스를 넘어서면 작업을 대기열에 넣어야하므로 업데이트 배포가 느려진다.
- 업데이트할 워크로드 개수
- 더 많은 워크로드에 업데이트를 배포하려면 네트워크 대역폭과 처리 능력이 더 많이 필요하다.
- 설정 크기
- 더 큰 엔보이 구성을 배포하려면 처리 능력과 네트워크 대역폭이 더 많이 필요하다.
11.2 Monitoring the control plane
11.2.1 The four golden signals of the control plane (실습)
- 컨트롤 플레인 확인
# 실습 환경 준비
kubectl -n istioinaction apply -f services/catalog/kubernetes/catalog.yaml
kubectl -n istioinaction apply -f ch11/catalog-virtualservice.yaml
kubectl -n istioinaction apply -f ch11/catalog-gateway.yaml

# 확인
kubectl get deploy,gw,vs -n istioinaction

# 반복 설정 해두기
while true; do curl -s http://catalog.istioinaction.io:30000/items ; date "+%Y-%m-%d %H:%M:%S" ; sleep 1; echo; done


# 컨트롤 플레인 메트릭 확인
kubectl exec -it -n istio-system deploy/istiod -- curl localhost:15014/metrics
# HELP citadel_server_csr_count The number of CSRs received by Citadel server.
# TYPE citadel_server_csr_count counter
citadel_server_csr_count 3
...
# 지연 시간: 데이터 플레인을 업데이트하는 데 필요한 시간
- 이스티오 컨트롤 플레인에서 지연 시간은 컨트롤 플레인이 데이터 플레인에 업데이트를 얼마나 빠릴 배포하는지로 측정한다.
- 지연 시간을 측정하는 주요 메트릭은
pilot_proxy_convergence_time이다. - 그러나 동기화 절차 중 대부분의 시간을 소비하는 단계의 이해를 돕는 보조 메트릭도 두 가지 있는데, 하나는
pilot_proxy_queue_time이고 다른 하나는pilot_xds_push_time이다.
- 아래 그림은 동기화 단계 중 이 메트릭이 다루는 부분
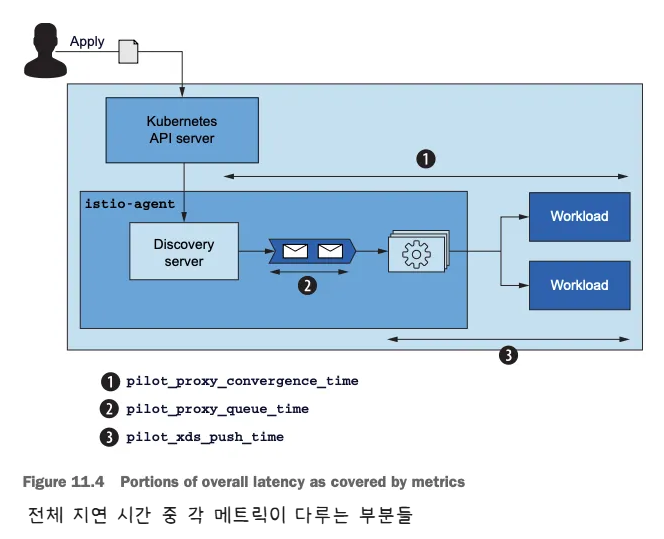
pilot_proxy_convergence_time은 프록시 푸시 요청이 대기열에 안착한 순간부터 워크로드에 배포되기까지 전체 과정의 지속 시간을 측정한다.pilot_proxy_queue_time은 워커가 처리할 때까지 푸시 요청이 대기열에서 기다린 시간을 측정한다.pilot_xds_push_time은 엔보이 설정을 워크로드로 푸시하는 데 필요한 시간을 측정한다. 시간이 늘어나면, 전송되는 데이터양 때문에 네트워크 대역폭이 과부하된 것이다.
-
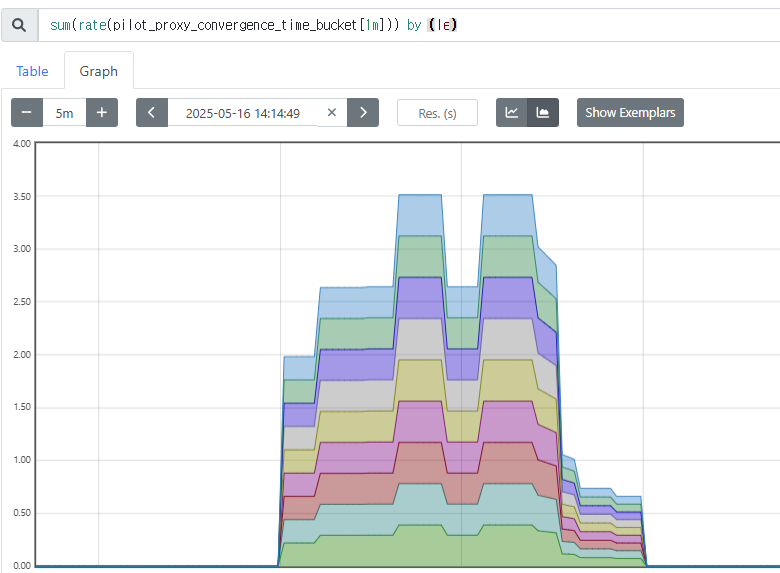
프로메테우스 쿼리 : le (누적 카운트) “less than or equal”
-
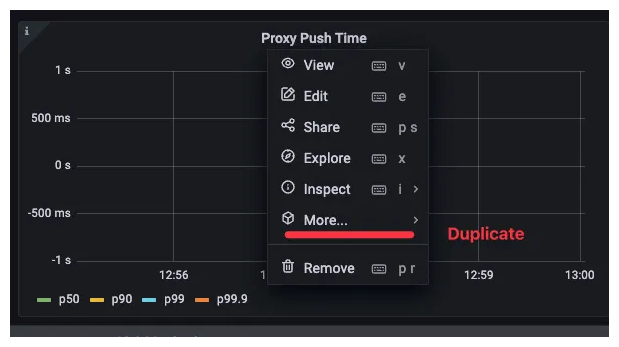
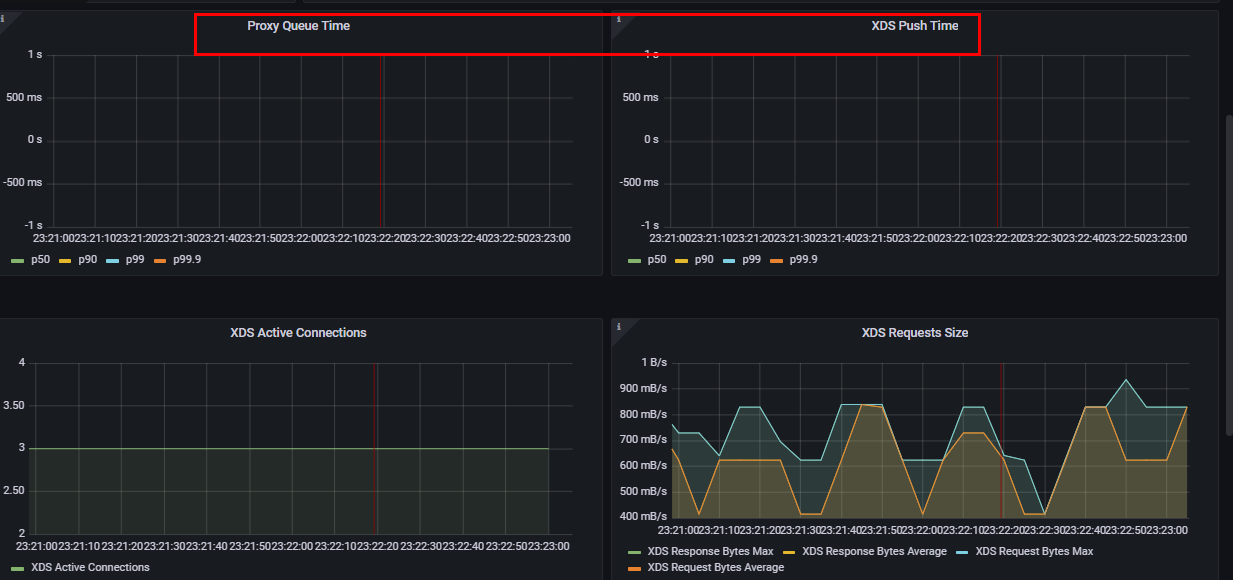
그라파나 대시보드에 2개의 패널(메트릭) 추가 하자

-
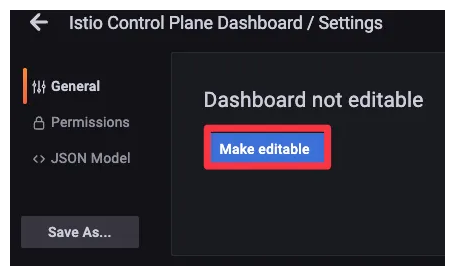
대시보드 편집 설정
-
기존 Proxy Push Time 패널 복제 하기
- Proxy Queue Time : PromQL -
pilot_proxy_queue_timehistogram_quantile(0.5, sum(rate(**pilot_proxy_queue_time_bucket**[1m])) by (le)) histogram_quantile(0.9, sum(rate(pilot_proxy_queue_time_bucket[1m])) by (le)) histogram_quantile(0.99, sum(rate(pilot_proxy_queue_time_bucket[1m])) by (le)) histogram_quantile(0.999, sum(rate(pilot_proxy_queue_time_bucket[1m])) by (le)) - XDS Push Time : PromQL -
pilot_xds_push_time_buckethistogram_quantile(0.5, sum(rate(**pilot_xds_push_time_bucket**[1m])) by (le)) histogram_quantile(0.9, sum(rate(pilot_xds_push_time_bucket[1m])) by (le)) histogram_quantile(0.99, sum(rate(pilot_xds_push_time_bucket[1m])) by (le)) histogram_quantile(0.999, sum(rate(pilot_xds_push_time_bucket[1m])) by (le))
- 허용할 수 있는 임계값은 정의하고 지연 시간이 허용할 수 있는 한계를 넘어가면 얼럿을 트리거해야 한다.
- 다음 기준으로 임계값을 고려하는 것을 권장
- Warning : 10초 이상 동안 지연 시간이 1초를 초과하는 경우
- Critical : 10초 이상 동안 지연 시간이 2초를 초과하는 경우
# 포화도: 컨트롤 플레인이 얼마나(CPU, MEM 리소스) 가득 차 있는가?
-
포하도 메트릭은 리소스 사용량을 보여준다.
-
포화는 보통 가장 제한적인 리소스 때문에 일어난다. istiod는 CPU 집중적이므로, 보통은 CPU가 가장 먼저 포화된다. CPU 사용률을 측정한다.
-
container_cpu_usage_seconds_total : 쿠버네티스 컨테이너가 보고하는 (istiod 파드) CPU 사용률을 측정한다
# Cumulative cpu time consumed by the container in core-seconds
container_cpu_usage_seconds_total
container_cpu_usage_seconds_total{container="discovery"}
container_cpu_usage_seconds_total{container="discovery", pod=~"istiod-.*|istio-pilot-.*"}
sum(irate(container_cpu_usage_seconds_total{container="discovery", pod=~"istiod-.*|istio-pilot-.*"}[1m]))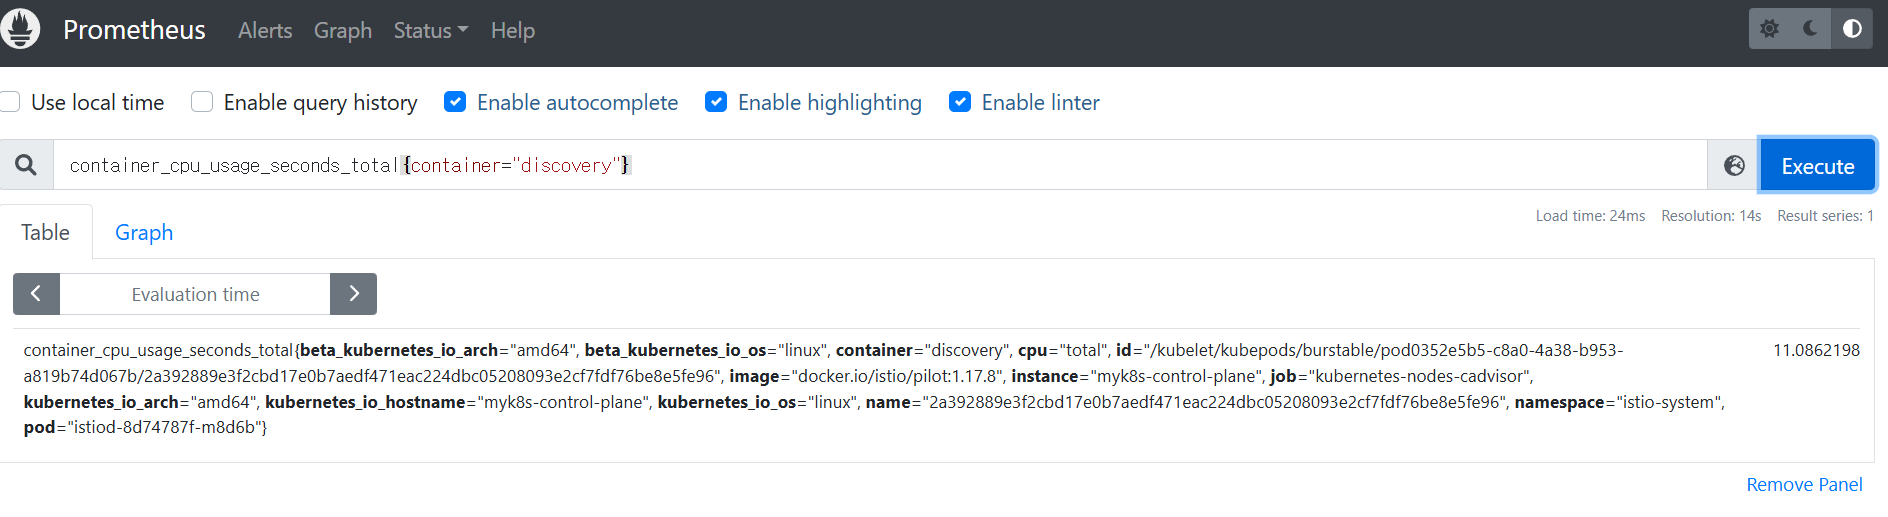
- process_cpu_seconds_total : istiod 계측이 보고하는 (istiod 파드) CPU 사용률을 측정.
# Total user and system CPU time spent in seconds
process_cpu_seconds_total{app="istiod"}
irate(process_cpu_seconds_total{app="istiod"}[1m])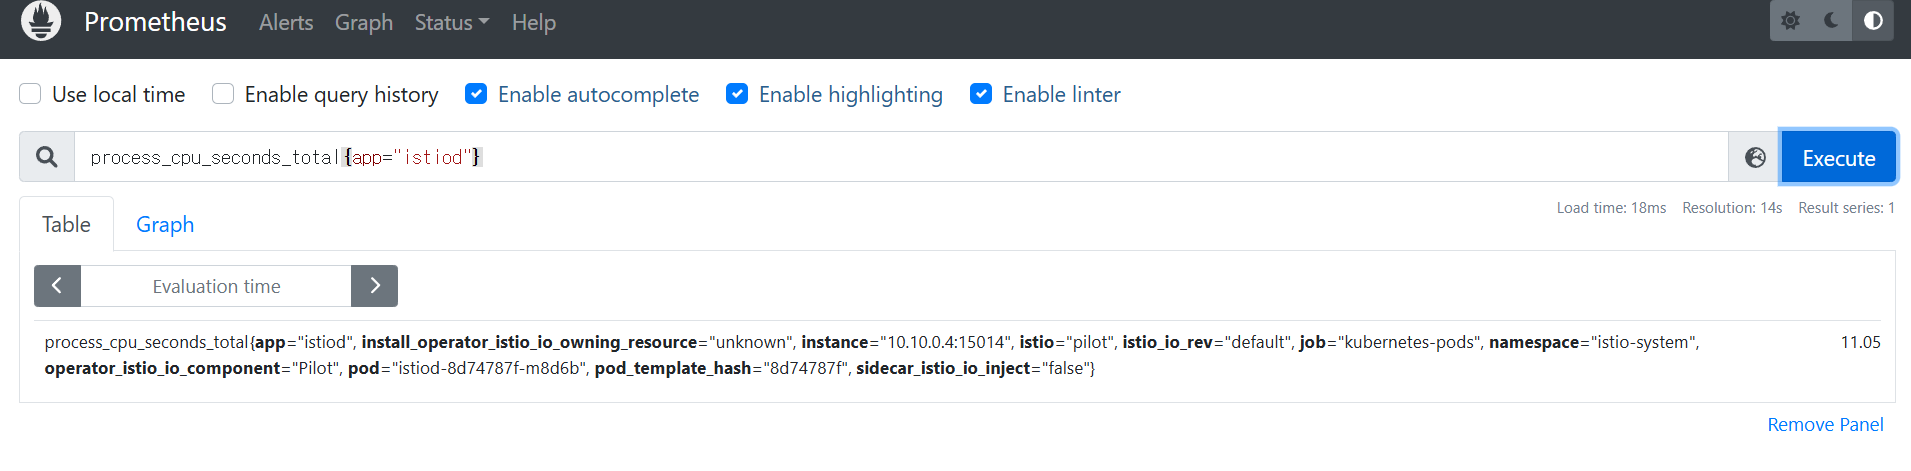
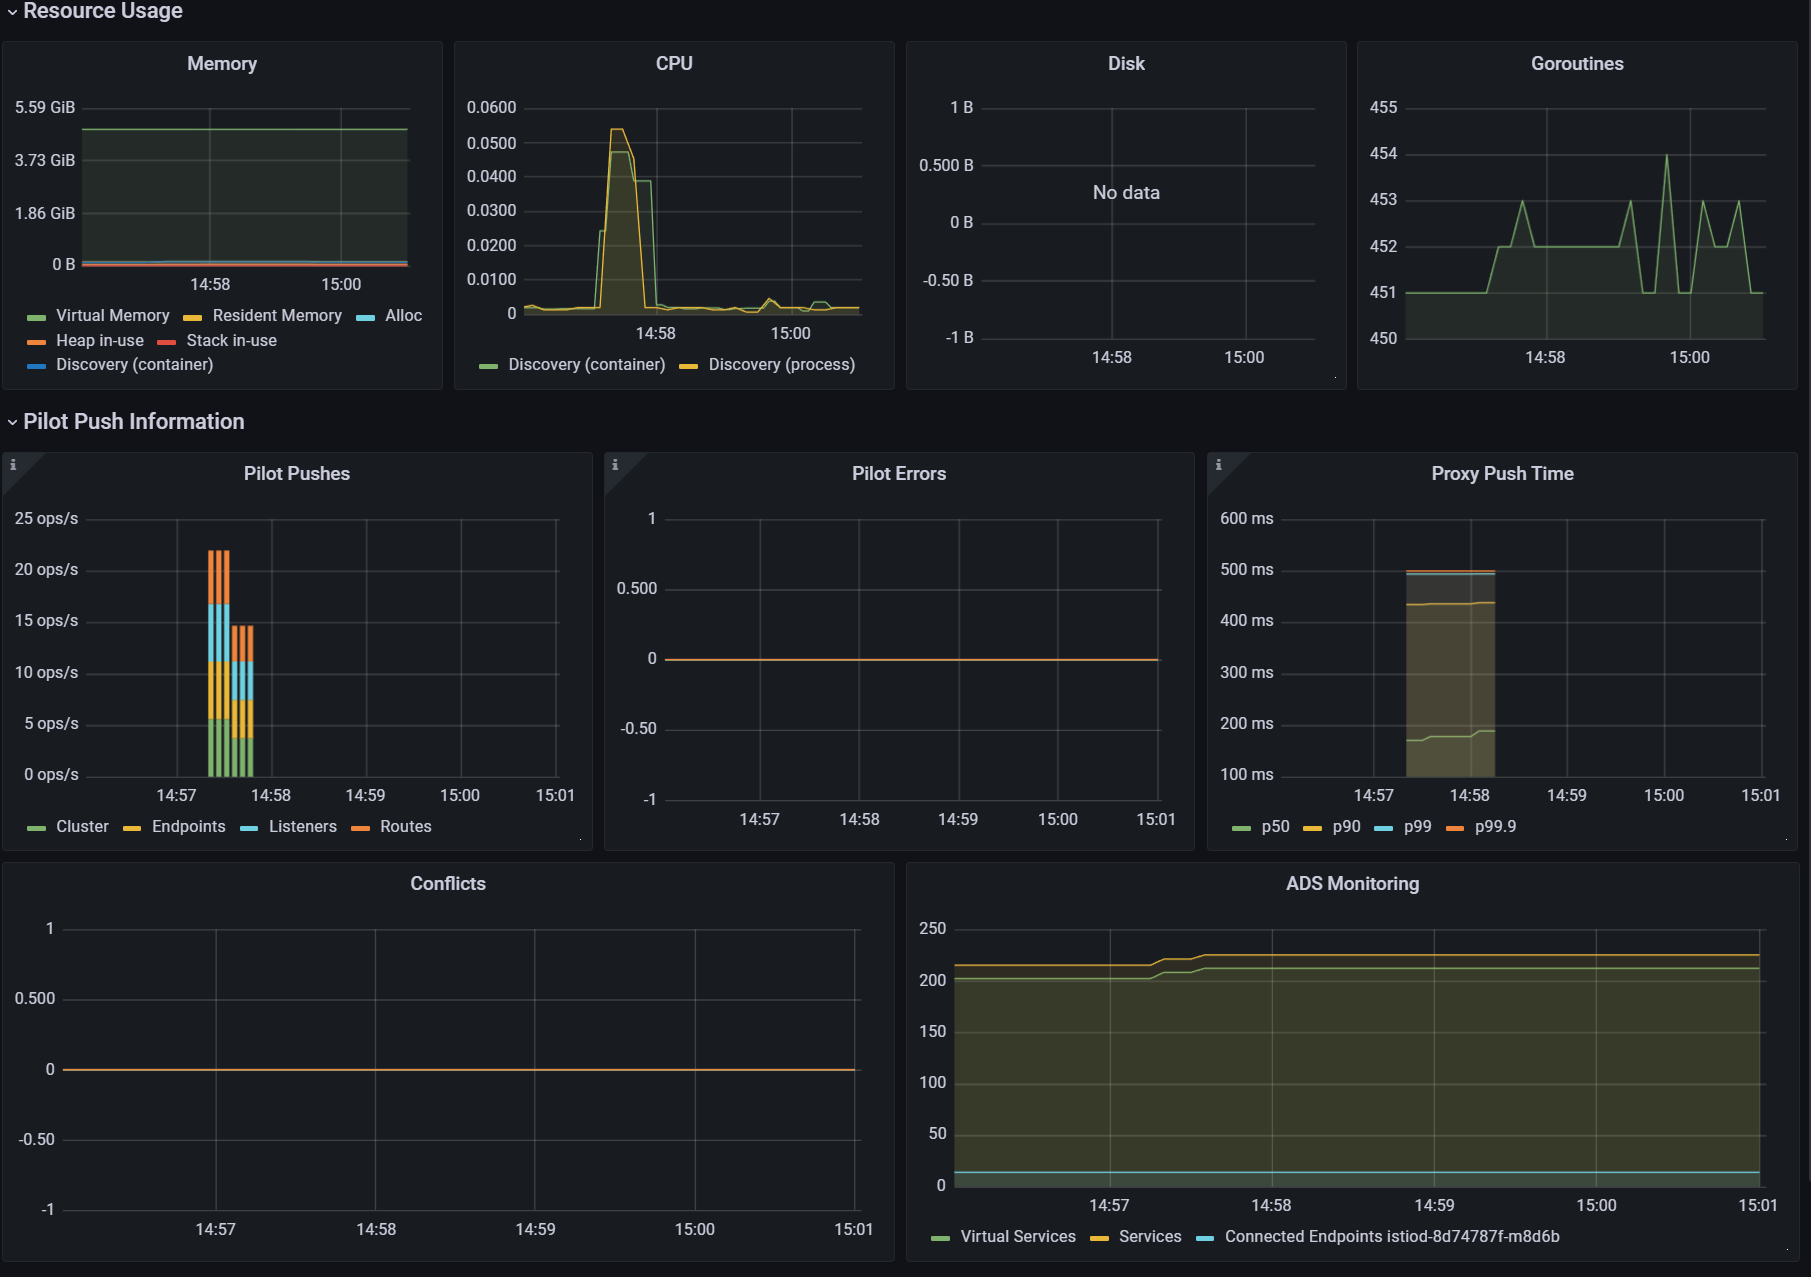
- 아래 그림은 CPU 사용률 메트릭 그래프
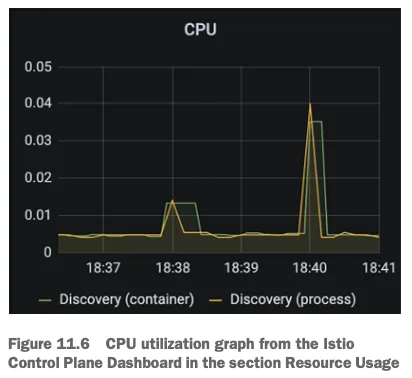
이 그래프는 istiod 에서 가장 일반적인 사용 패턴을 나타내는데, 대부분의 시간이 유휴 idle 시간이다.
서비스가 배포될 때 컴퓨팅 요청이 급증하는데, istiod가 엔보이 설정을 생성해 모든 워크로드로 푸시하기 때문이다.
이에 컨트롤 플레인 동작을 최적화하기 위해 다른 접근법을 시도했었다면, 리소스를 늘리는 것이 최선의 선택이다.
# 트래픽: 컨트롤 플레인의 부하는 어느 정도인가?
- 트래픽은 시스템이 겪는 부하를 측정한다.
- 예를 들어, 웹 애플리케이션에서 부하는 초당 요청 수 (rps) 로 정의한다.
- 한편, 이스티오의 컨트롤 플레인에는 수신 트래픽(설정 변경 형태)과 송신 트래픽(데이터 플레인으로 변경 푸시)이 있다.
- 성능을 제한하는 요인을 찾으려면 양방향 트래픽을 모두 측정해야 한다.
- 수신 트래픽에 대한 메트릭은 다음과 같다.
pilot_inbound_updates- 각 istiod 인스턴스가 설정 변경 수신 횟수를 보여준다.
- 해당 메트릭을 사용하는 대시보드와 패널은 어디?
pilot_push_triggers- 푸시를 유발한 전체 이벤트 횟수다.
- 푸시 원인은 서비스, 엔드포인트, 설정 중 한다. 여기서 설정이란 Gateway나 VirtualService 같은 이스티오 커스텀 리소스를 말한다.
- 해당 메트릭을 사용하는 대시보드와 패널은 어디?
pilot_services- 파일럿이 인지하고 있는 서비스 개수를 측정한다.
avg(pilot_virt_services{app="istiod"})   # istio vs 개수: kubectl get vs -A --no-headers=true | wc -l
avg(pilot_services{app="istiod"}) # k8s service 개수: kubectl get svc -A --no-headers=true | wc -l- 발신 트래픽에 대한 메트릭은 다음과 같다.
pilot_xds_pushes- 리스너, 루트, 클러스터, 엔드포인트 업데이트와 같이 컨트롤 플레인이 수행하는 모든 유형의 푸시를 측정한다.
sum(irate(pilot_xds_pushes{type="cds"}[1m]))
sum(irate(pilot_xds_pushes{type="eds"}[1m]))
sum(irate(pilot_xds_pushes{type="lds"}[1m]))
sum(irate(pilot_xds_pushes{type="rds"}[1m]))pilot_xds- 워크로드로의 전체 커넥션 개수를 파일럿 인스턴스별로 보여준다.
avg(pilot_virt_services{app="istiod"})   # istio vs 개수: kubectl get vs -A --no-headers=true | wc -l
avg(pilot_services{app="istiod"})        # k8s service 개수: kubectl get svc -A --no-headers=true | wc -l

# docker exec -it myk8s-control-plane istioctl proxy-status
pilot_xds
pilot_xds{app="istiod"}
sum(pilot_xds{app="istiod"})
sum(pilot_xds{app="istiod"}) by (pod)- envoy_cluster_upstream_cx_tx_bytes_total
- 네트워크로 전송된 설정 크기를 측정한다.
# rx
max(rate(envoy_cluster_upstream_cx_rx_bytes_total{cluster_name="xds-grpc"}[1m]))
quantile(0.5, rate(envoy_cluster_upstream_cx_rx_bytes_total{cluster_name="xds-grpc"}[1m]))

# tx
max(rate(envoy_cluster_upstream_cx_tx_bytes_total{cluster_name="xds-grpc"}[1m]))
quantile(.5, rate(envoy_cluster_upstream_cx_tx_bytes_total{cluster_name="xds-grpc"}[1m]))
# 오류: 컨트롤 플레인의 실패율은 어떻게 되는가?
오류는 isiotd의 실패율을 나타내며, 보통은 서비스가 포화 상태에 이르러 성능이 저하됐을 때 발생한다.
# 각 쿼리 패턴에 Legend 확인
Legend(Rejected CDS Configs) : sum(pilot_xds_cds_reject{app="istiod"}) or (absent(pilot_xds_cds_reject{app="istiod"}) - 1)
Legend(Rejected EDS Configs) : sum(pilot_xds_eds_reject{app="istiod"}) or (absent(pilot_xds_eds_reject{app="istiod"}) - 1)
Legend(Rejected RDS Configs) : sum(pilot_xds_rds_reject{app="istiod"}) or (absent(pilot_xds_rds_reject{app="istiod"}) - 1)
Legend(Rejected LDS Configs) : sum(pilot_xds_lds_reject{app="istiod"}) or (absent(pilot_xds_lds_reject{app="istiod"}) - 1)
Legend(Write Timeouts) : sum(rate(pilot_xds_write_timeout{app="istiod"}[1m]))
Legend(Internal Errors) : sum(rate(pilot_total_xds_internal_errors{app="istiod"}[1m]))
Legend(Config Rejection Rate) : sum(rate(pilot_total_xds_rejects{app="istiod"}[1m]))
Legend(Push Context Errors) : sum(rate(pilot_xds_push_context_errors{app="istiod"}[1m]))
Legend(Push Timeouts) : sum(rate(pilot_xds_write_timeout{app="istiod"}[1m]))| 메트픽 | 설명 |
|---|---|
| pilot_total_xds_rejects | 설정 푸시 거부 횟수 |
| pilotxds’cds/lds/rds/cds’_reject | pilot_total_xds_rejects 메트릭의 부분집합. 어느 API 푸시가 거부됐는지 수사망을 좁히는 데 유용함 |
| pilot_xds_write_timeout | push를 시작할 때 발생한 오류와 타임아웃의 합계 |
| pilot_xds_push_context_errors | 엔보이 설정을 생성하는 동안 발생한 이스티오 파일럿 오류 횟수. 주로 이스티오 파일럿의 버그와 관련 |
11.3 Tuning performance
11.3.1 Setting up the workspace
- istiod에게 관리할 워크로드를 주기 위해 catalog 워크로드와 더미 워크로드 10개 생성
kubectl -n istioinaction apply -f services/catalog/kubernetes/catalog.yaml
kubectl -n istioinaction apply -f ch11/catalog-virtualservice.yaml
kubectl -n istioinaction apply -f ch11/catalog-gateway.yaml
kubectl get deploy,gw,vs -n istioinaction

# 반복 설정 해두기
while true; do curl -s http://catalog.istioinaction.io:30000/items ; date "+%Y-%m-%d %H:%M:%S" ; sleep 1; echo; done

# 모니터링
while true; do kubectl top pod -n istio-system -l app=istiod --containers=true ; date "+%Y-%m-%d %H:%M:%S" ; sleep 1; echo; done
POD                     NAME        CPU(cores)   MEMORY(bytes)
istiod-8d74787f-cqhs2   discovery   7m           65Mi
2025-05-11 15:04:34

POD                     NAME        CPU(cores)   MEMORY(bytes)
istiod-8d74787f-cqhs2   discovery   27m          82Mi
2025-05-11 15:04:36
...


# 더미 워크로드 10개 생성
cat ch11/sleep-dummy-workloads.yaml
...
apiVersion: v1
kind: Service
...
spec:
  ports:
  - port: 80
    name: http
  selector:
    app: sleep
---
apiVersion: apps/v1
kind: Deployment
...
    spec:
      serviceAccountName: sleep
      containers:
      - name: sleep
        image: governmentpaas/curl-ssl
        command: ["/bin/sleep", "3650d"]
        imagePullPolicy: IfNotPresent
...

kubectl -n istioinaction apply -f ch11/sleep-dummy-workloads.yaml


# 확인
kubectl get deploy,svc,pod -n istioinaction
...

docker exec -it myk8s-control-plane istioctl proxy-status
NAME                                                   CLUSTER        CDS        LDS        EDS        RDS          ECDS         ISTIOD                    VERSION
catalog-6cf4b97d-5jtzt.istioinaction                   Kubernetes     SYNCED     SYNCED     SYNCED     SYNCED       NOT SENT     istiod-8d74787f-cqhs2     1.17.8
istio-egressgateway-85df6b84b7-m4699.istio-system      Kubernetes     SYNCED     SYNCED     SYNCED     NOT SENT     NOT SENT     istiod-8d74787f-cqhs2     1.17.8
istio-ingressgateway-6bb8fb6549-k4ln6.istio-system     Kubernetes     SYNCED     SYNCED     SYNCED     SYNCED       NOT SENT     istiod-8d74787f-cqhs2     1.17.8
sleep-6f8cfb8c8f-2nfrm.istioinaction                   Kubernetes     SYNCED     SYNCED     SYNCED     SYNCED       NOT SENT     istiod-8d74787f-cqhs2     1.17.8
...

#
docker exec -it myk8s-control-plane istioctl proxy-config cluster deploy/catalog.istioinaction --fqdn sleep.istioinaction.svc.cluster.local
docker exec -it myk8s-control-plane istioctl proxy-config endpoint deploy/catalog.istioinaction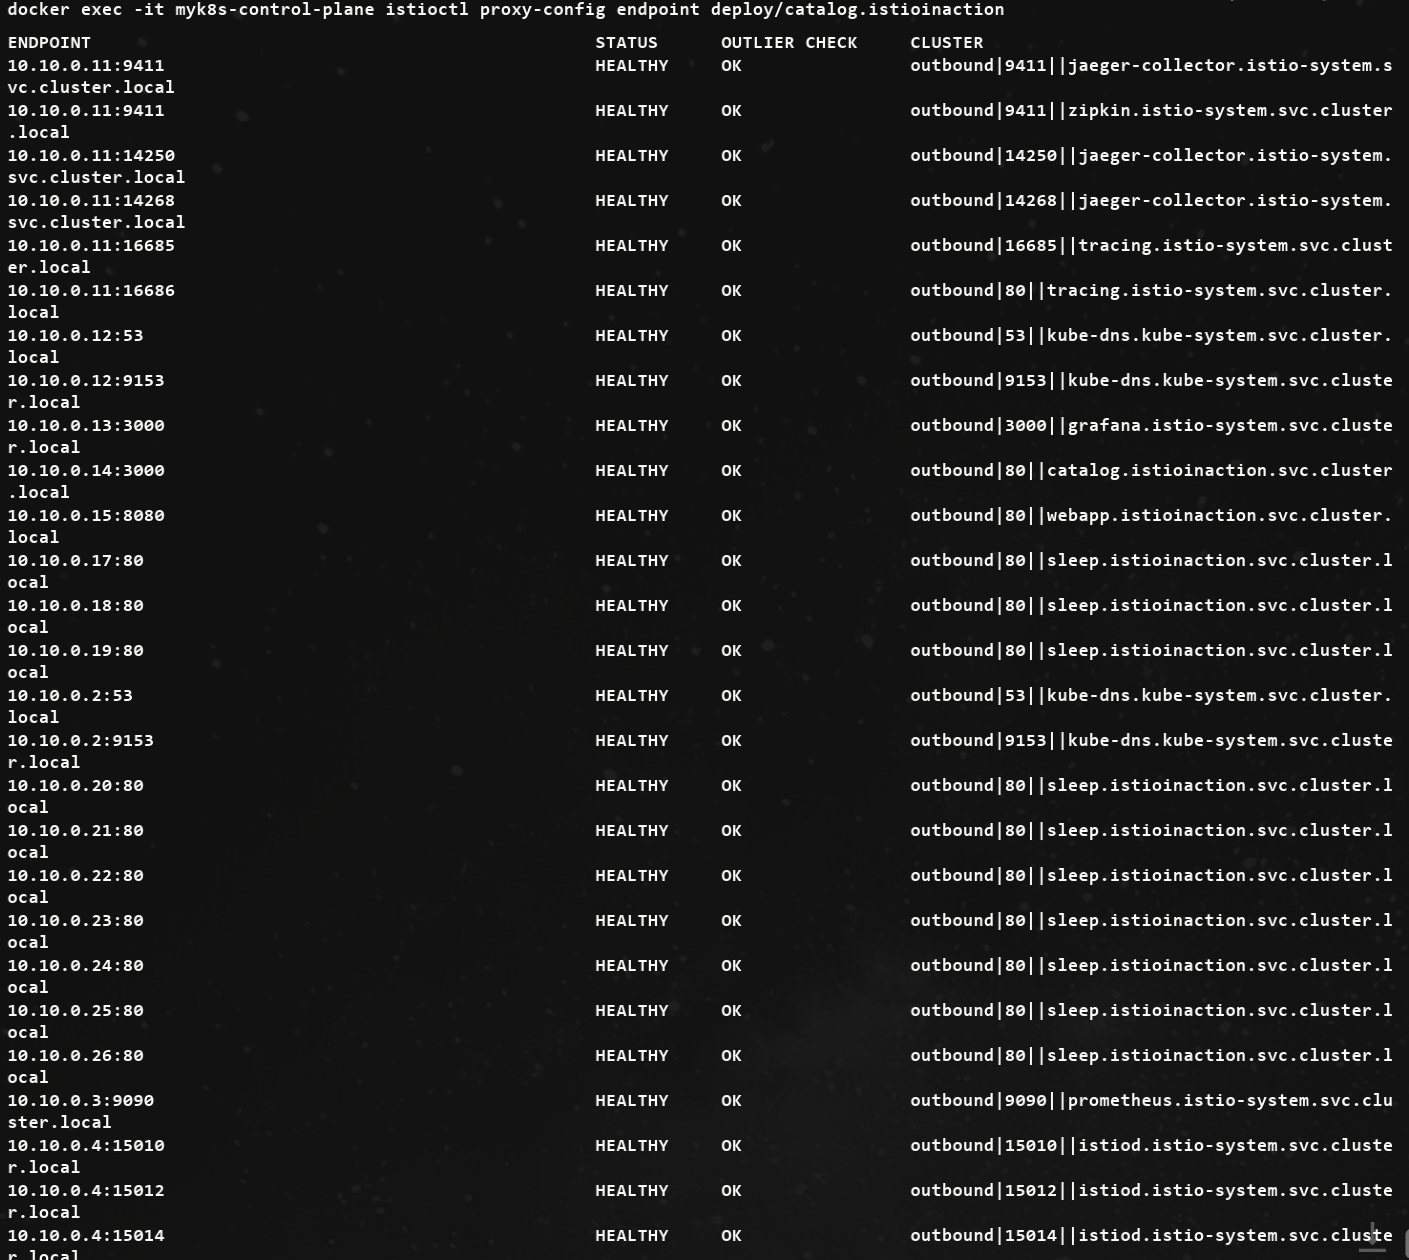
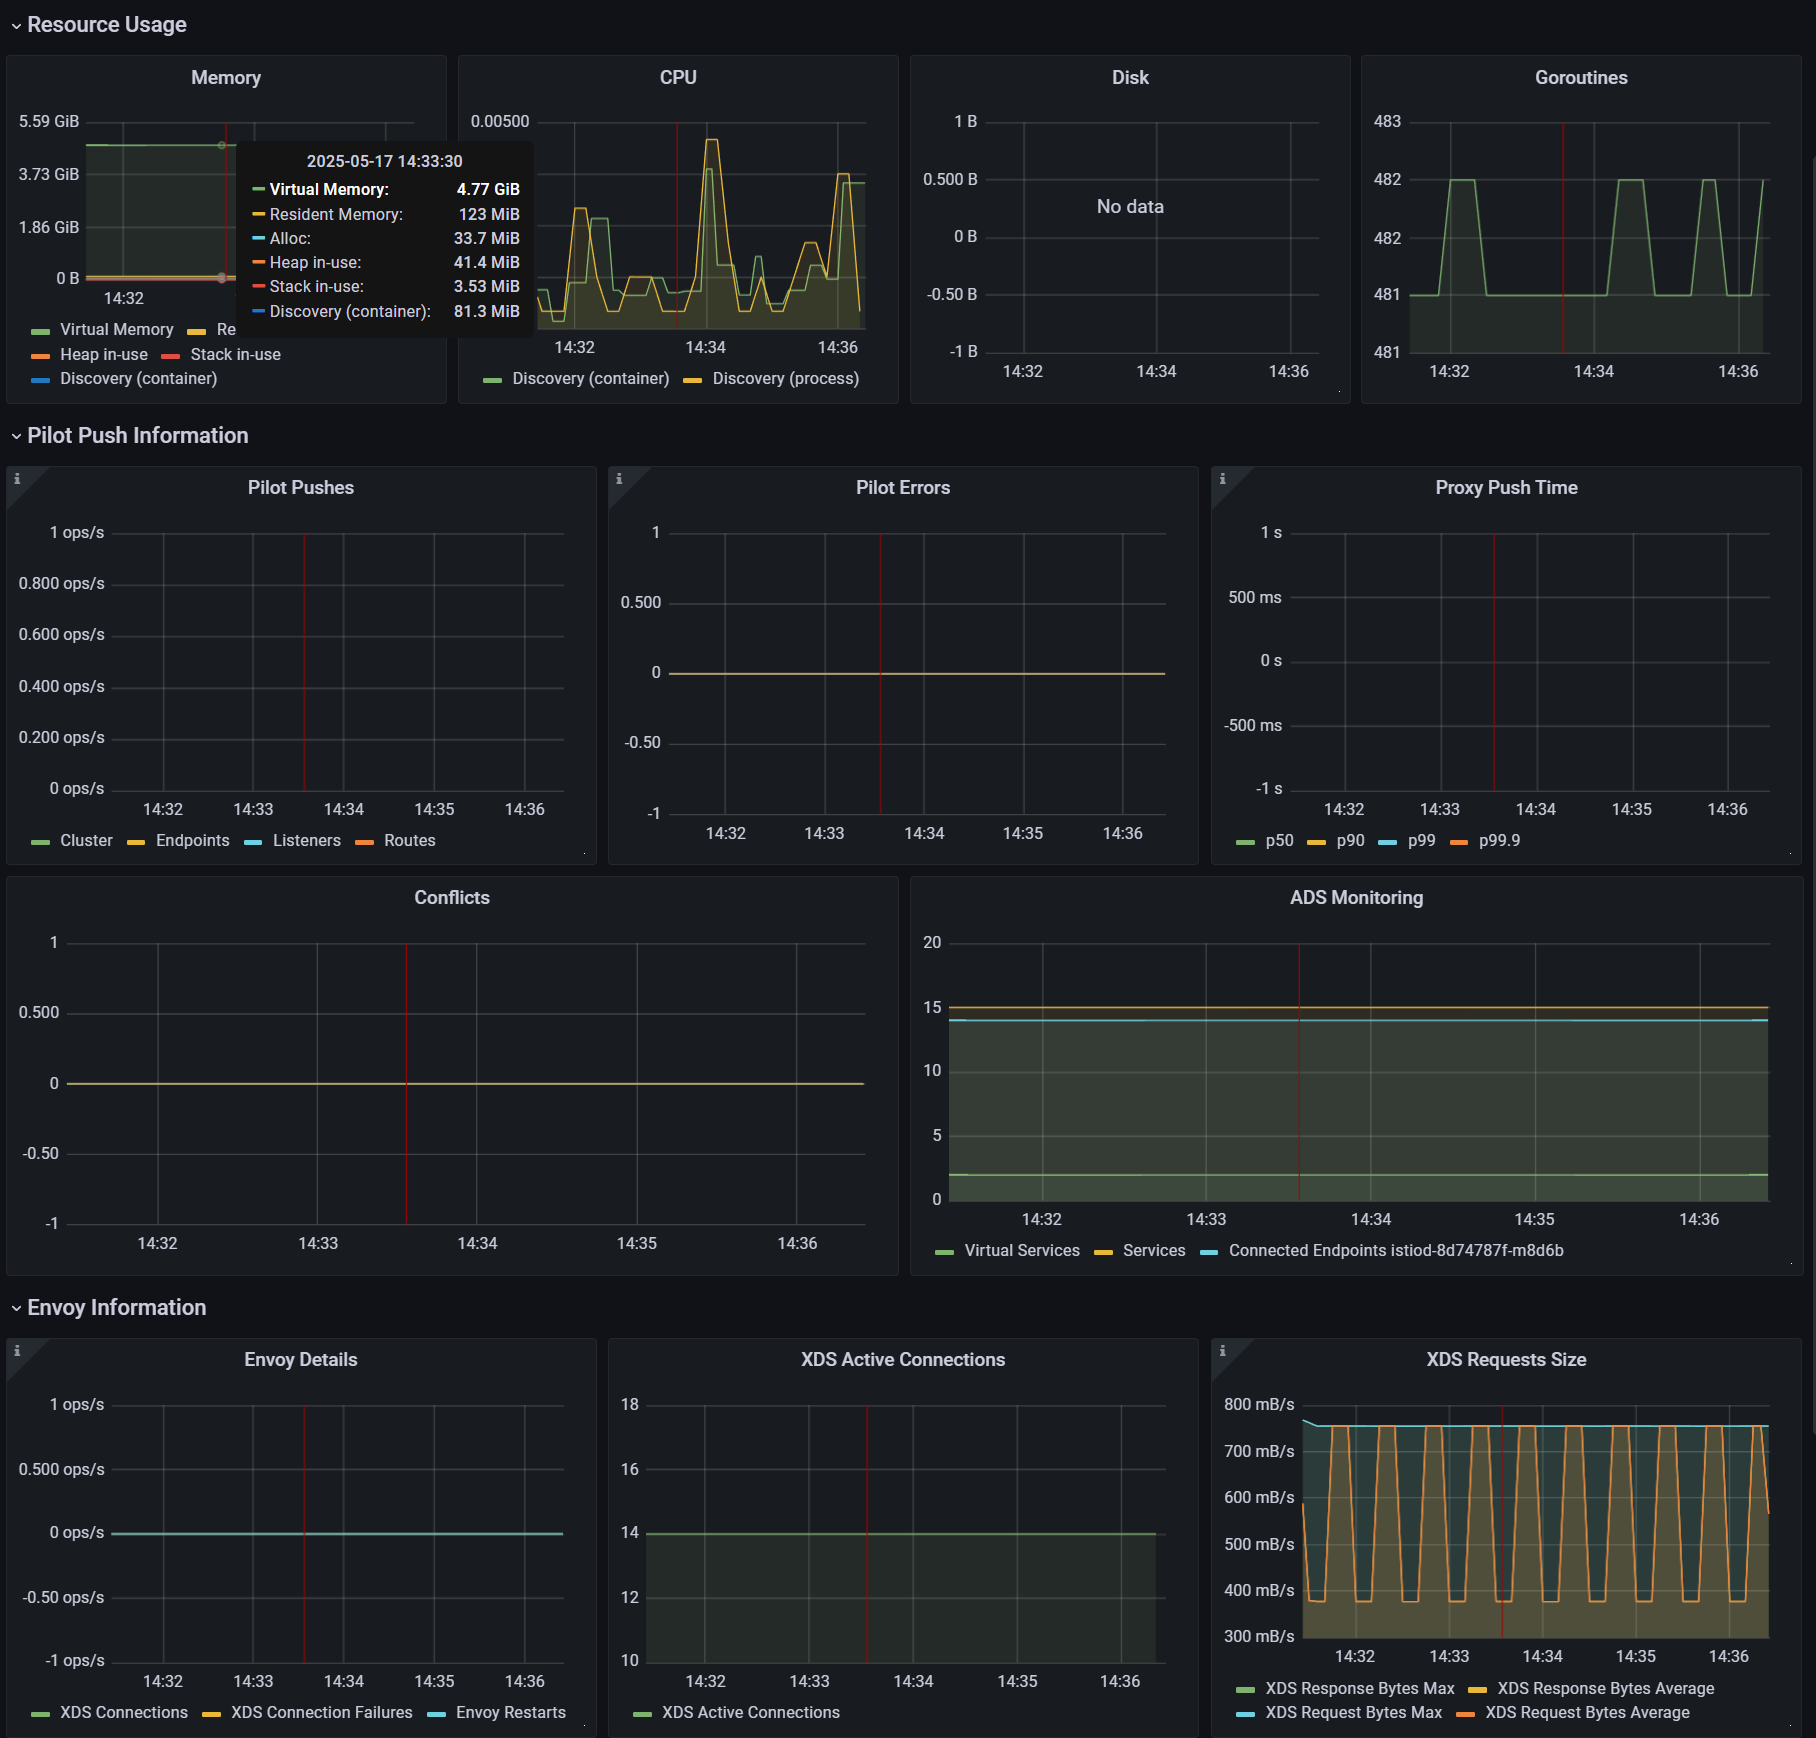
- 그라파나 대시보드 : Last 5 minutes
- 엔보이 설정을 부풀려 상황을 악화시키기
cat ch11/resources-600.yaml
cat ch11/resources-600.yaml | wc -l
    9200

# 각각 200개
cat ch11/resources-600.yaml | grep 'kind: Service' | wc -l
cat ch11/resources-600.yaml | grep 'kind: Gateway' | wc -l
cat ch11/resources-600.yaml | grep 'kind: VirtualService' | wc -l
     200

# 배포 : svc 200개, vs 200개, gw 200개
kubectl -n istioinaction apply -f ch11/resources-600.yaml


# 확인
kubectl get deploy,svc,pod -n istioinaction
...

# k8s service 개수 202개
kubectl get svc -n istioinaction --no-headers=true | wc -l
     202

kubectl get gw,vs -n istioinaction
...

#
docker exec -it myk8s-control-plane istioctl proxy-status
docker exec -it myk8s-control-plane istioctl proxy-config listener deploy/catalog.istioinaction
docker exec -it myk8s-control-plane istioctl proxy-config route deploy/catalog.istioinaction
docker exec -it myk8s-control-plane istioctl proxy-config cluster deploy/catalog.istioinaction
docker exec -it myk8s-control-plane istioctl proxy-config endpoint deploy/catalog.istioinaction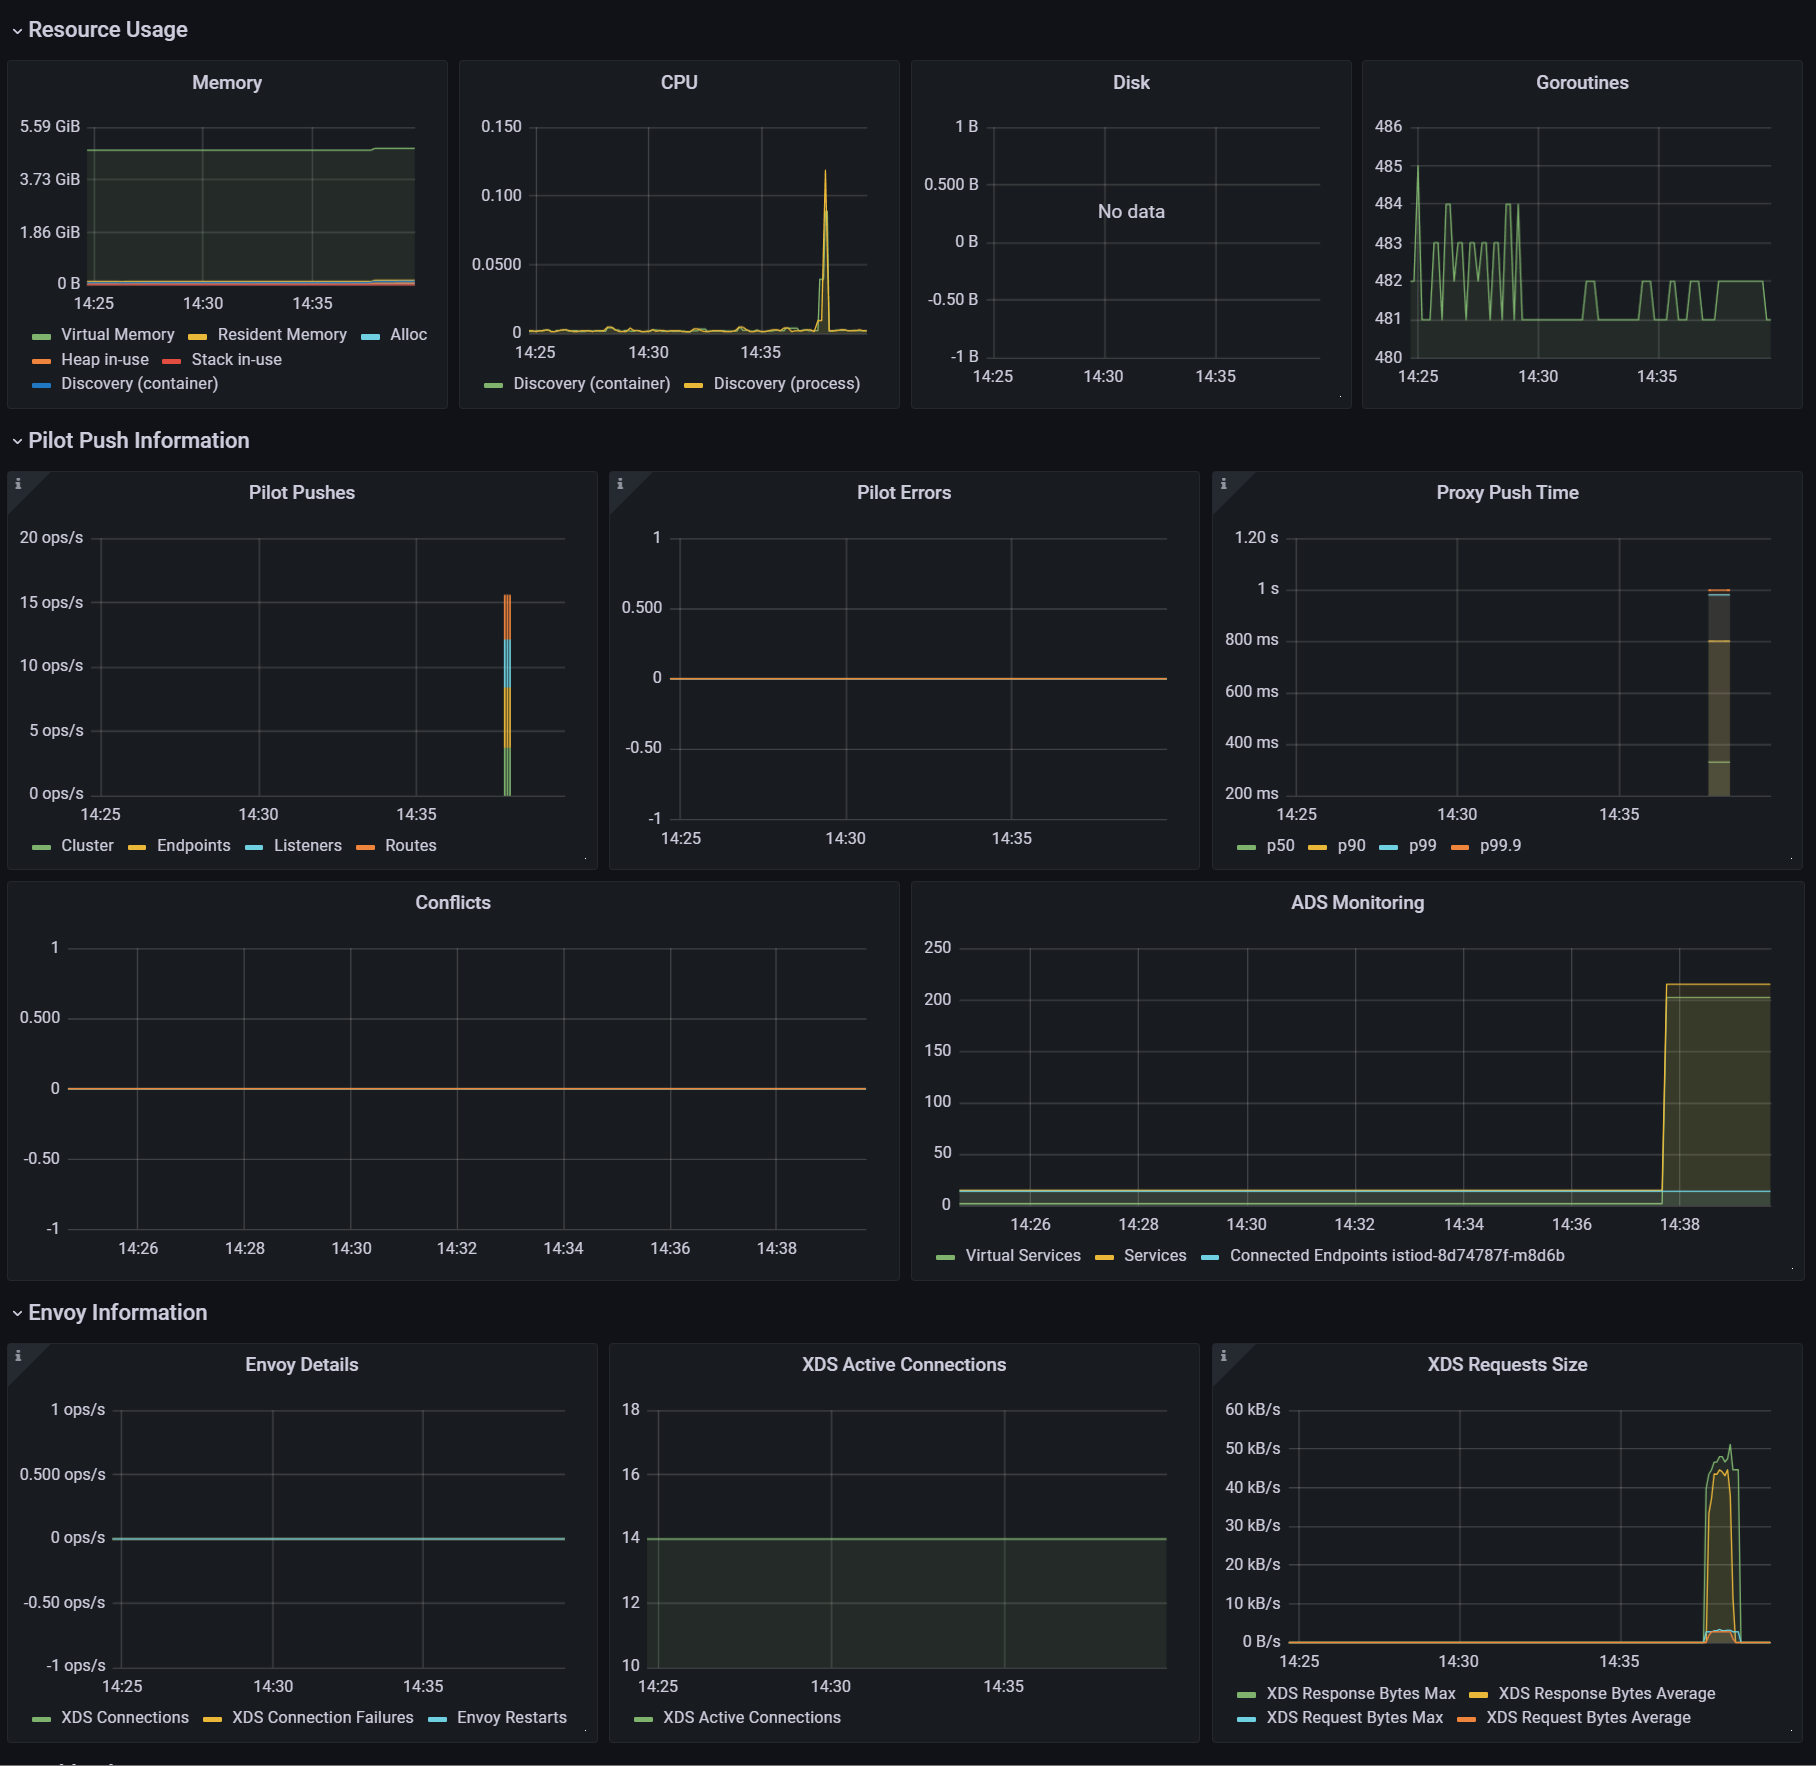
istiod 인스턴스 하나가 인그레스 및 이그레스 게이트웨이를 포함해 워크로드(istio-proxy 동작)를 13개 관리하며, 서비스는 총 600개(svc + vs + gw)
11.3.2 Measuring performance before optimizations Sidecar
테스트는 서비스를 반복적으로 만들어 부하를 생성하고, 프록시에 설정을 업데이트하는 데 걸리는 지연 시간과 P99 값과 푸시 개수를 측정한다.
P99 이해하기
P99(또는 percentile 백분위 99)는 업데이트 전파 중 가장 빠른 99%의 최대 지연 시간을 측정한다.
예를 들어 ‘P99 지연 시간이 80ms이다’는 요청 중 99%가 80ms 보다 빠르게 전파됐음을 말한다!
각 요청이 정확히 어떻게 분포하는지는 알지 못하며, 대부분은 수 ms 범위일 수 있다.
그러나 가장 빠른 99%만을 고려할 때 가장 느린 요청도 80ms안에 처리됐음을 알 수 있다.
- 테스트를 10회 반복하되, 반복 사이에 2.5초 간격
- 여러 개의 임의 서비스 리소스를 생성 → Istio의 xDS Push 횟수 증가량 측정, Prometheus에서 프록시 구성 수렴 시간(latency) 확인 ⇒ 최종적으로 Push 성능과 latency를 평가
curl -H "Host: catalog.istioinaction.io" localhost:30000/items

# 확인
kubectl get svc -n istioinaction --no-headers=true | wc -l
kubectl get gw -n istioinaction --no-headers=true | wc -l
kubectl get vs -n istioinaction --no-headers=true | wc -l

# :30000 포트 정보 추가해둘것!
cat bin/performance-test.sh
...
Poor Man's Performance Test creates Services, Gateways and VirtualServices and measures Latency and Push Count needed to distribute the updates to the data plane.
       --reps         The number of services that will be created. E.g. --reps 20 creates services [0..19]. Default '20'
       --delay        The time to wait prior to proceeding with another repetition. Default '0'
       --gateway      URL of the ingress gateway. Defaults to 'localhost'
       --namespace    Namespace in which to create the resources. Default 'istioinaction'
       --prom-url     Prometheus URL to query metrics. Defaults to 'prom-kube-prometheus-stack-prometheus.prometheus:9090'
...

# 성능 테스트 스크립트 실행!
./bin/performance-test.sh --reps 10 --delay 2.5 --prom-url prometheus.istio-system.svc.cluster.local:9090
Pre Pushes: 335
...
ateway.networking.istio.io/service-00a9-9 created
service/service-00a9-9 created
virtualservice.networking.istio.io/service-00a9-9 created
==============

Push count: 510 # 변경 사항을 적용하기 위한 푸시 함수
Latency in the last minute: 0.45 seconds # 마지막 1분 동안의 지연 시간


# 확인
kubectl get svc -n istioinaction --no-headers=true | wc -l
kubectl get gw -n istioinaction --no-headers=true | wc -l
kubectl get vs -n istioinaction --no-headers=true | wc -l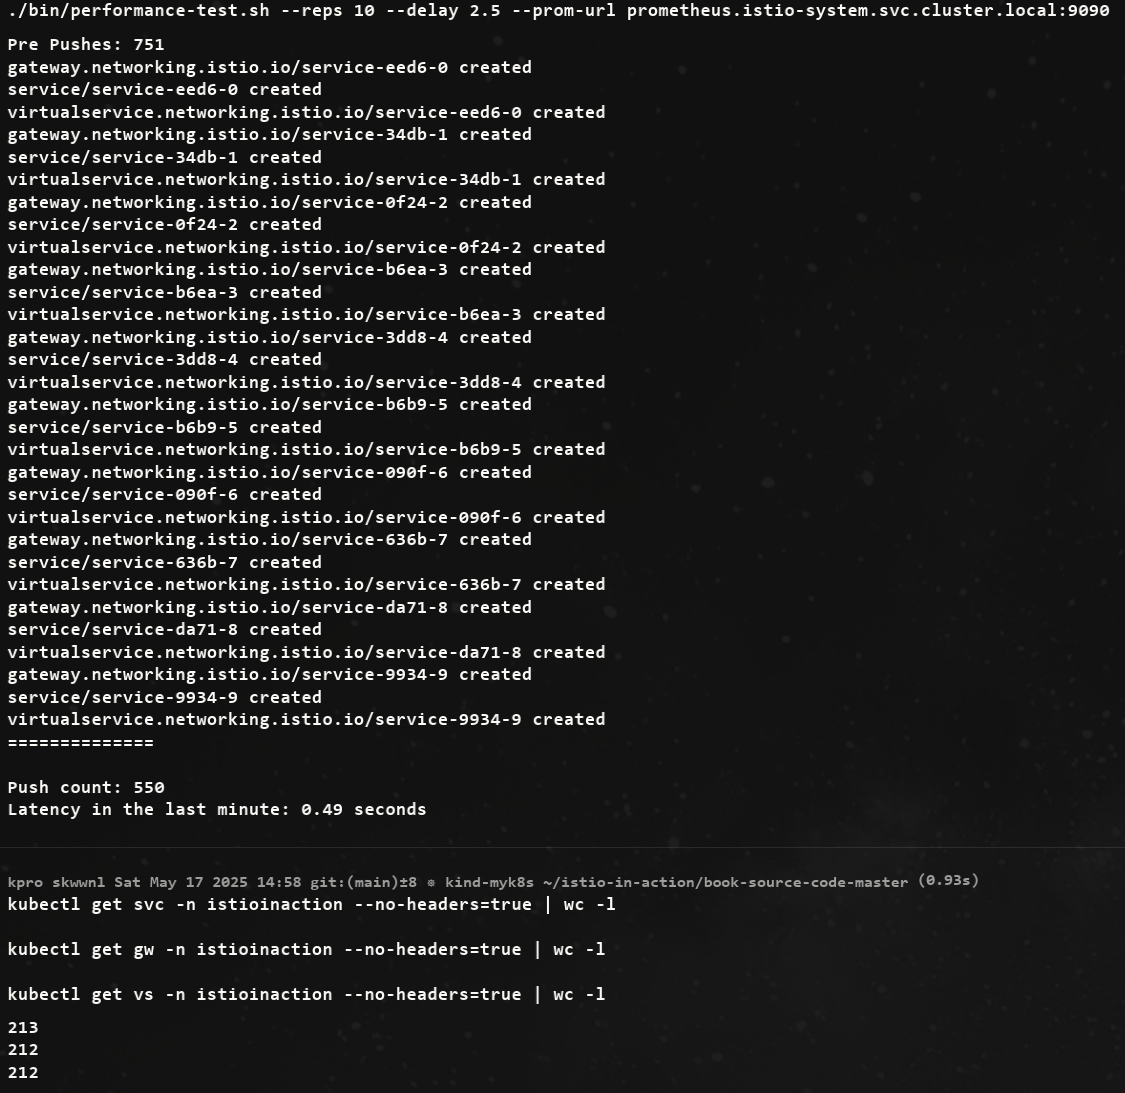
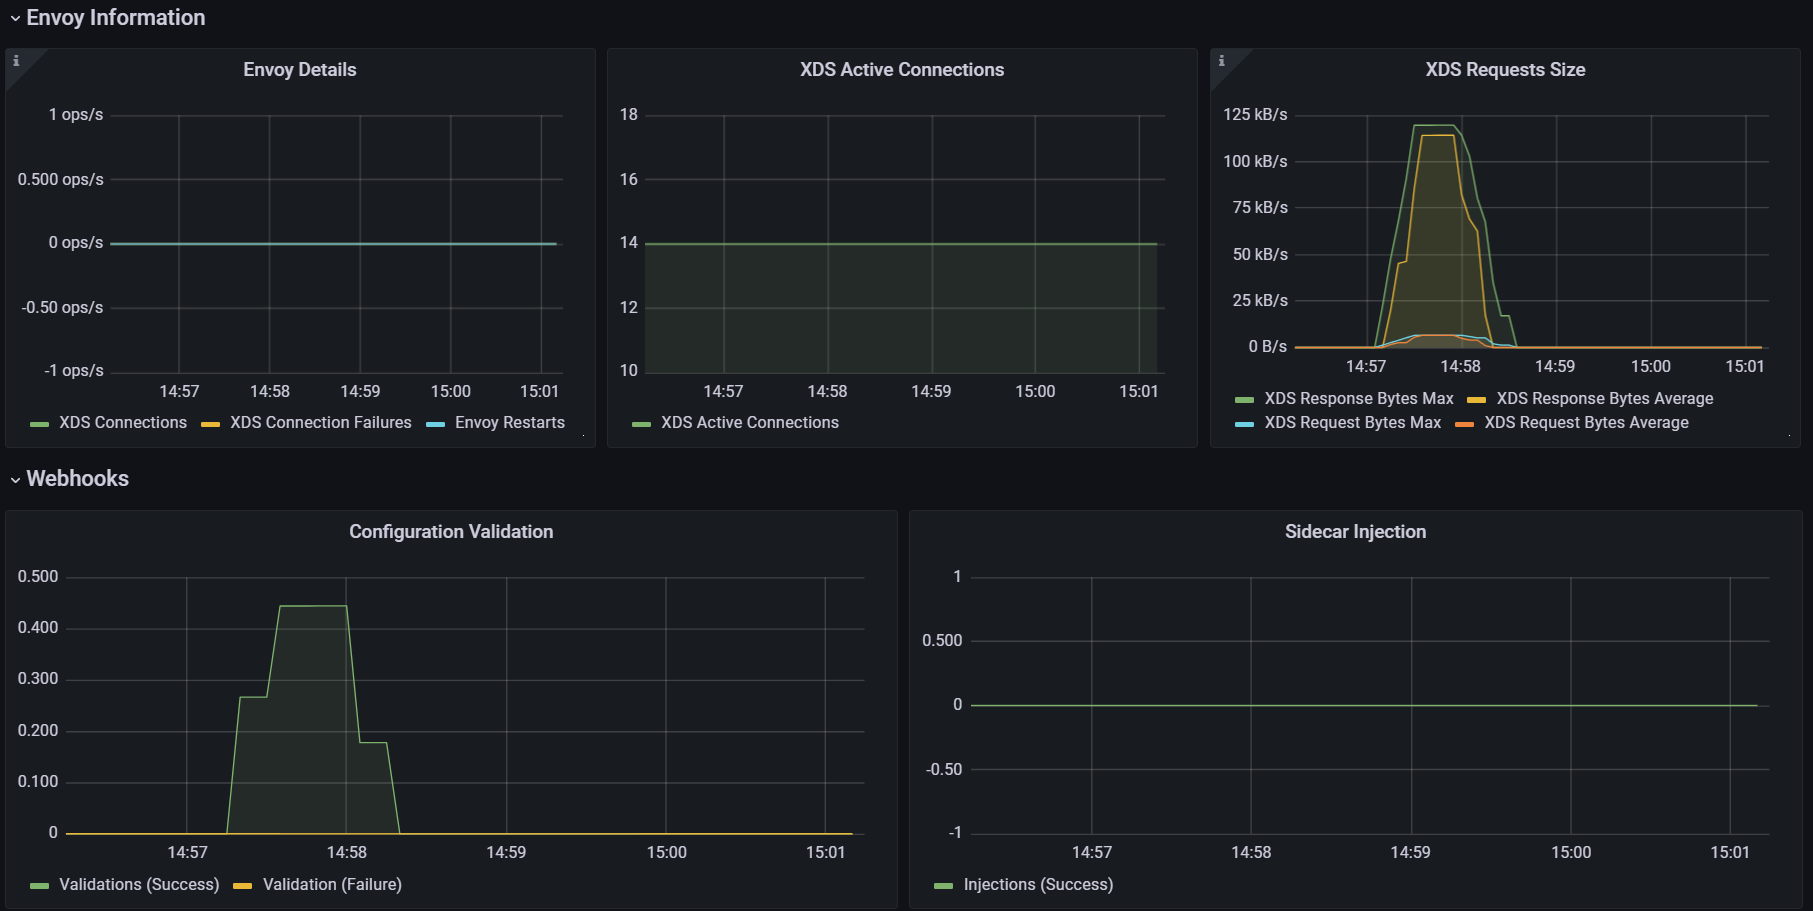
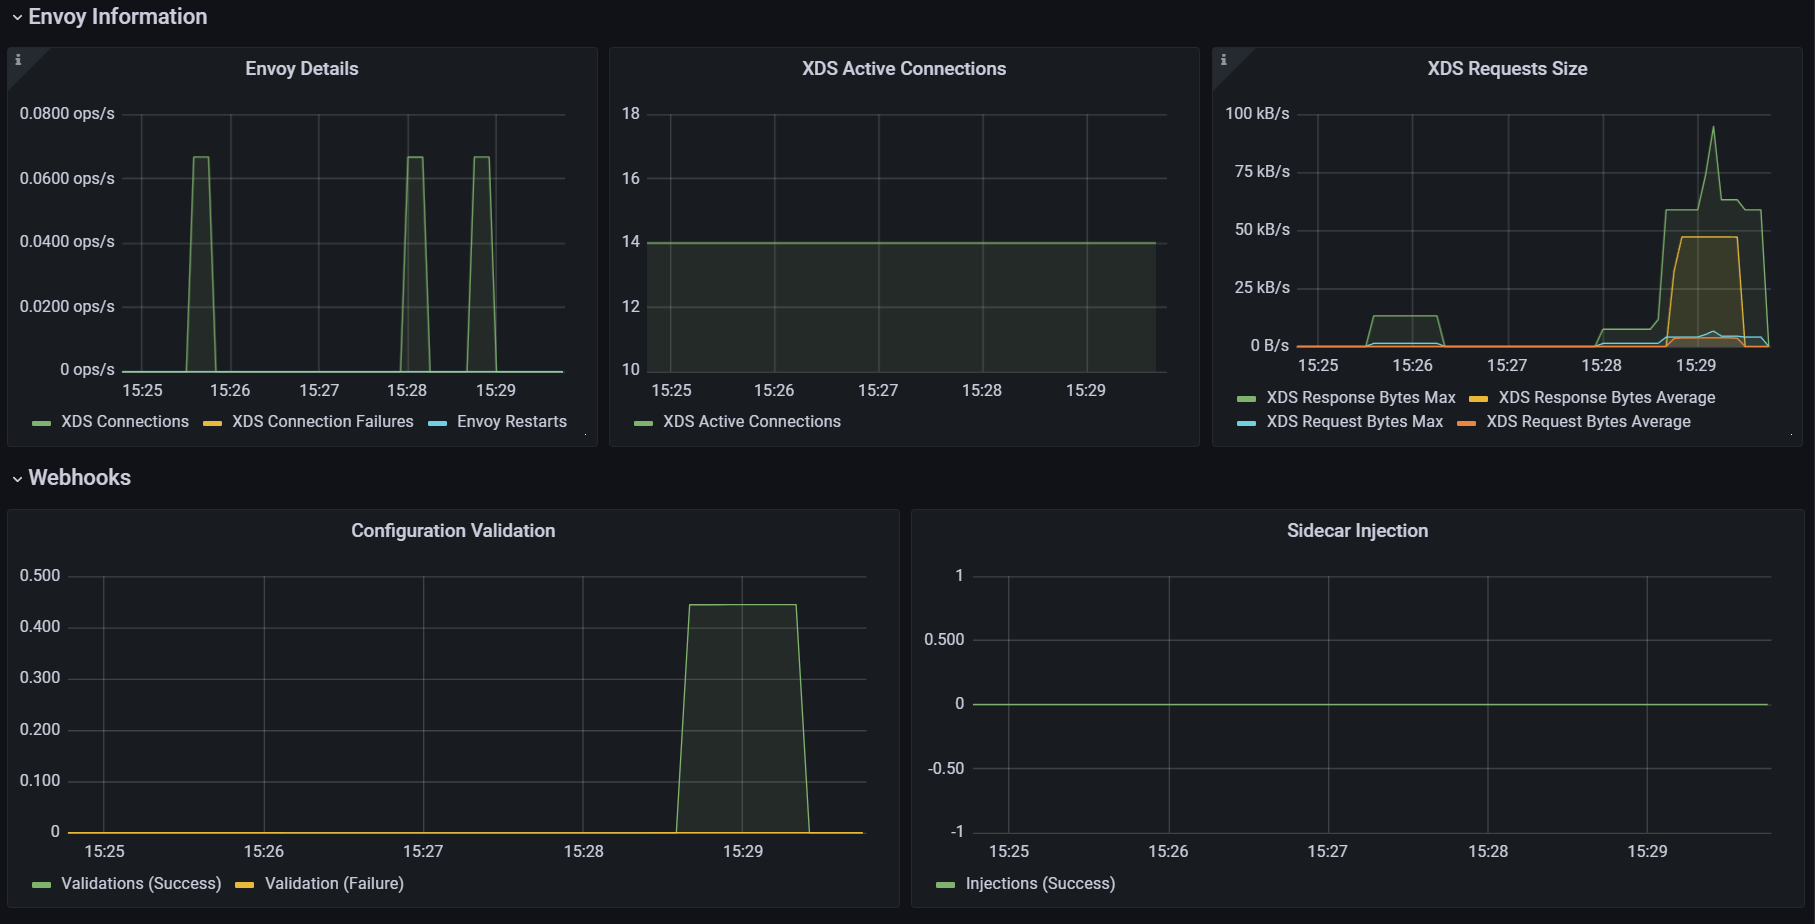
- 그라파나 : Last 5분
2. 딜레이 없이 실행
# 성능 테스트 스크립트 실행 : 딜레이 없이
./bin/performance-test.sh --reps 10 --prom-url prometheus.istio-system.svc.cluster.local:9090
Push count: 51
Latency in the last minute: 0.47 seconds

# 확인
kubectl get svc -n istioinaction --no-headers=true | wc -l
kubectl get gw -n istioinaction --no-headers=true | wc -l
kubectl get vs -n istioinaction --no-headers=true | wc -l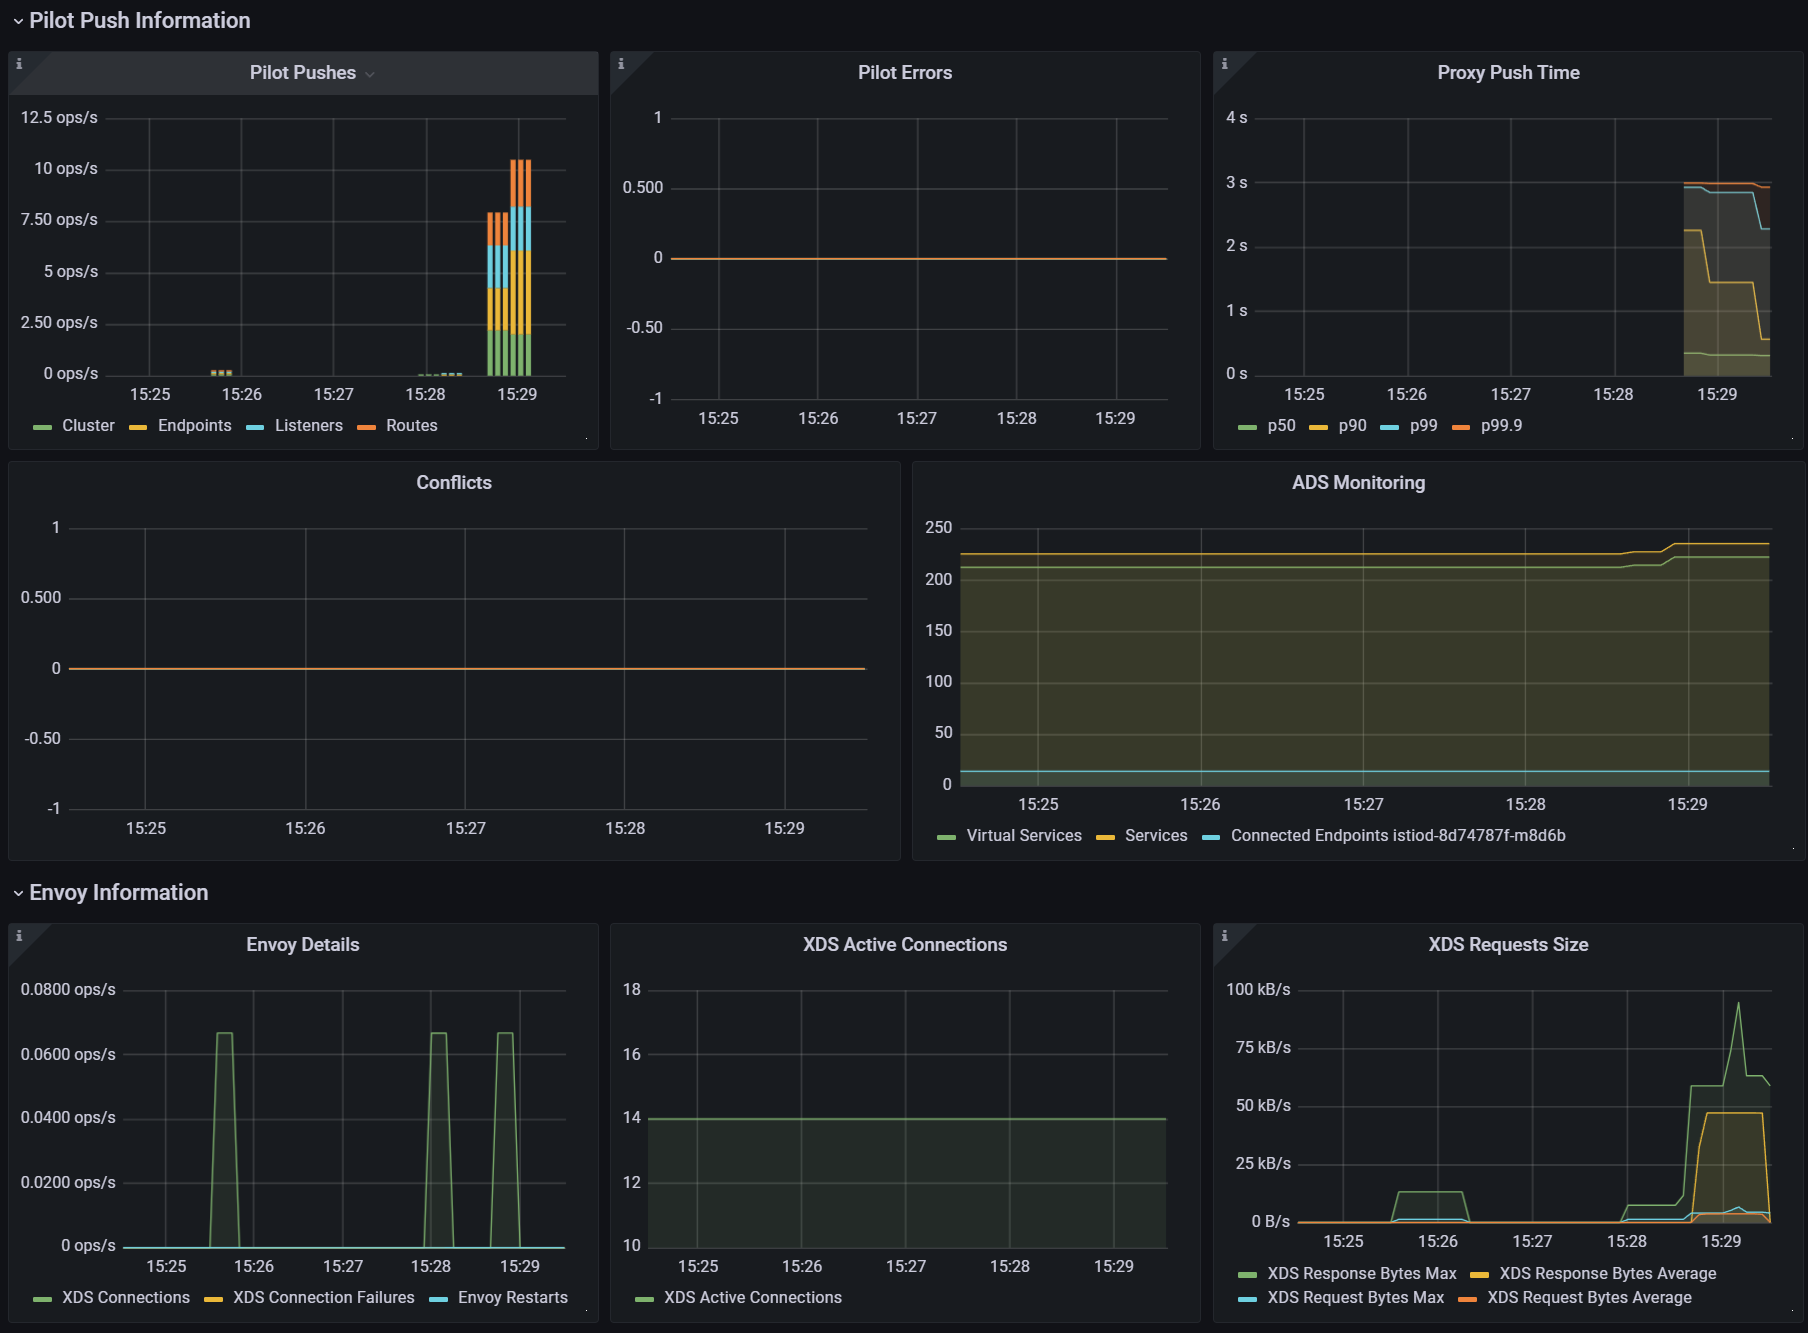
3. 딜레이 추가로 늘려서 실행
# 성능 테스트 스크립트 실행 : 딜레이 없이
./bin/performance-test.sh --reps 10 --delay 5 --prom-url prometheus.istio-system.svc.cluster.local:9090
Push count: 510
Latency in the last minute: 0.43 seconds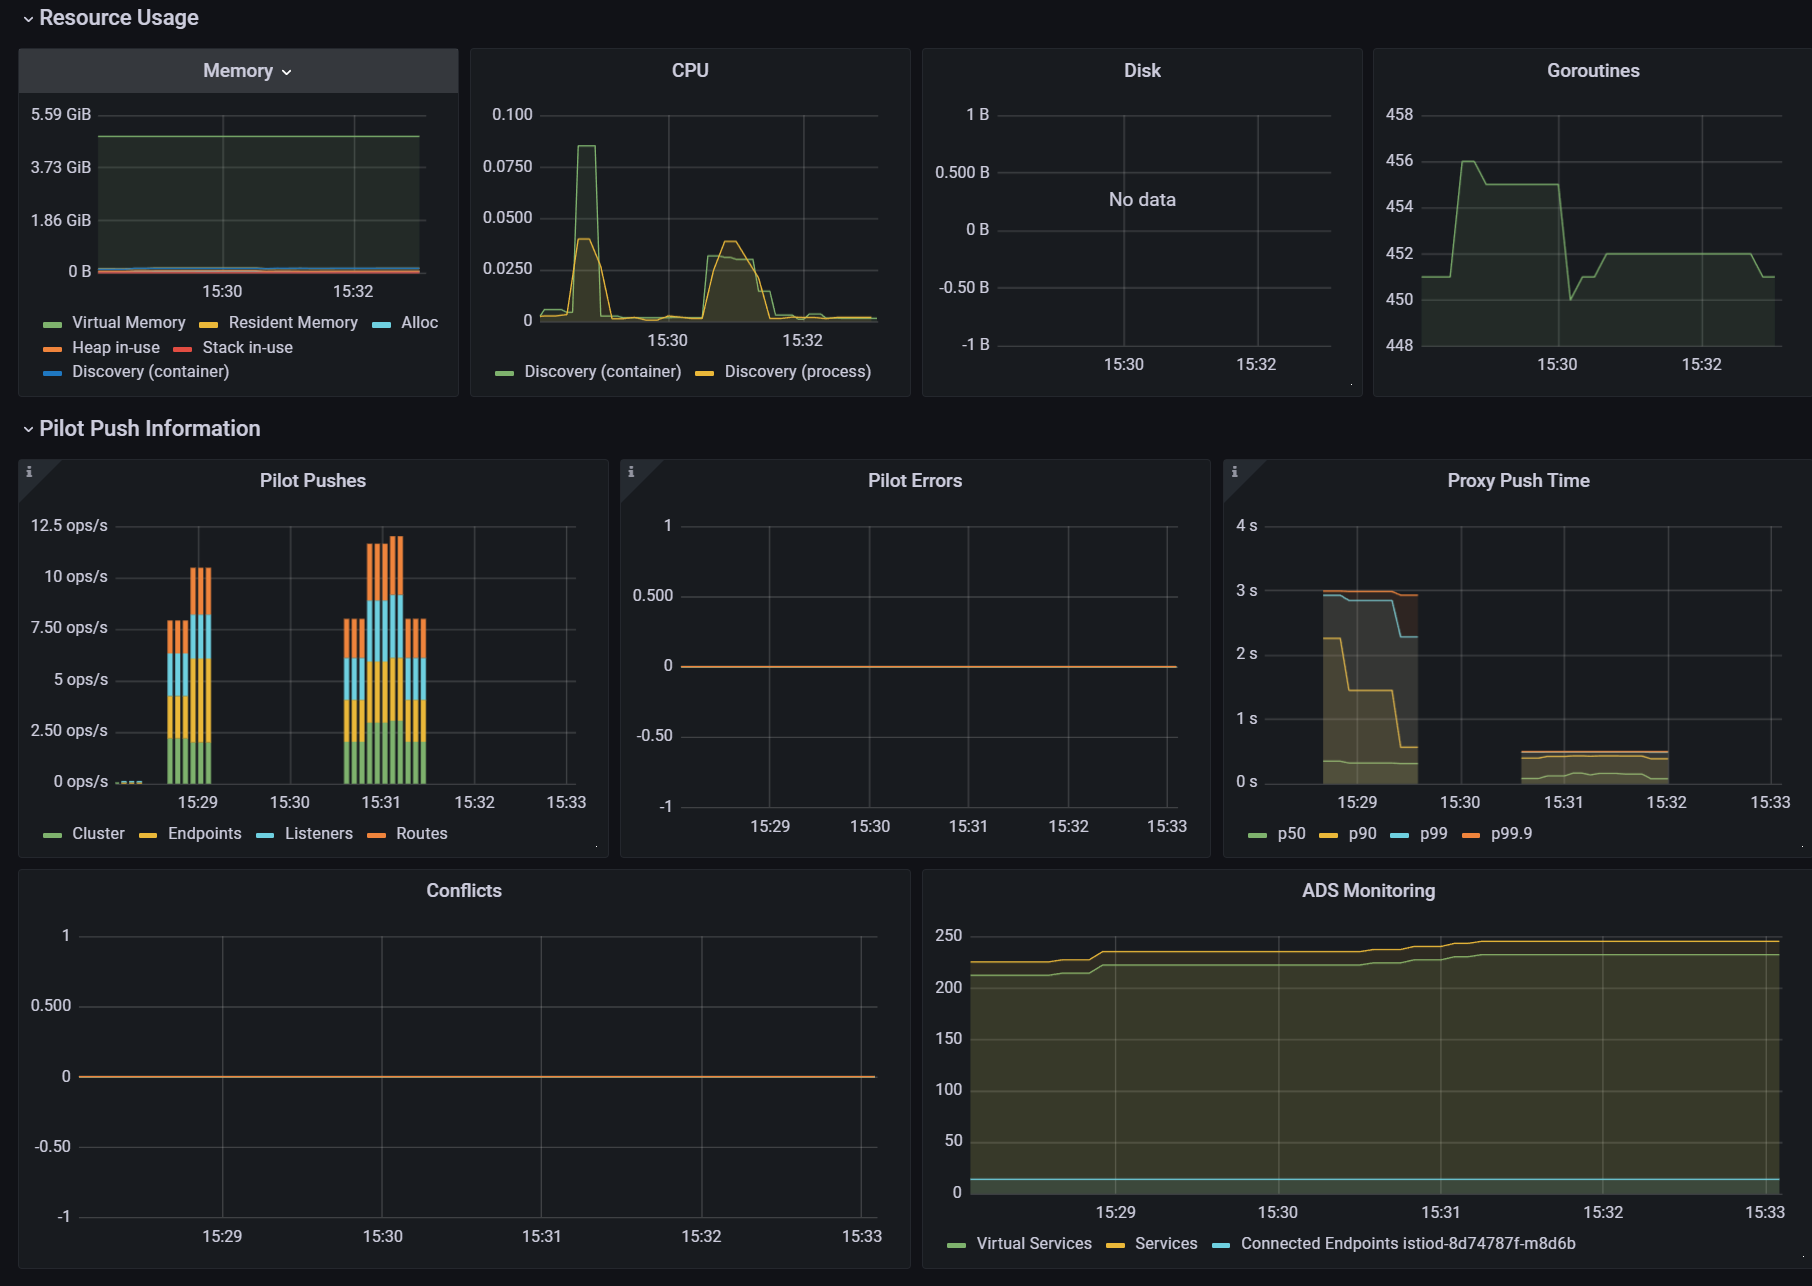
테스트 정리
- (첫 번째) 테스트에 따르면, 현재 설정으로는 510회의 푸시가 P99 지연 시간 0.45초로 수행됐다.
***Push count: 510 # 변경 사항을 적용하기 위한 푸시 함수 Latency in the last minute: 0.45 seconds # 마지막 1분 동안의 지연 시간, 책은 ms로 표기..*** - (두 번째) 테스트에 따르면, 서비스 간의 간격을 없애면, 푸시 횟수와 지연 시간 모두 떨어지는 것을 볼 수 있다. 이는 이벤트가 배치 처리돼서 더 적은 작업량으로 처리되기 때문이다.
*Push count: **51**
Latency in the last minute: **0.47 seconds***
# 사이드카를 사용해 푸시 횟수 및 설정 크기 줄이기
기본적으로 Istio는 각 서비스가 어떤 접근이 필요한지 알 수 없으므로, 기본값은 모든 서비스 프록시가 메시의 모든 워크로드를 알도록 합니다.
#
CATALOG_POD=$(kubectl -n istioinaction get pod -l app=catalog -o jsonpath={.items..metadata.name} | cut -d ' ' -f 1)
kubectl -n istioinaction exec -ti $CATALOG_POD -c catalog -- curl -s localhost:15000/config_dump > /tmp/config_dump
du -sh /tmp/config_dump
1.9M    /tmp/config_dump

#
docker exec -it myk8s-control-plane istioctl proxy-config listener deploy/catalog.istioinaction
docker exec -it myk8s-control-plane istioctl proxy-config route deploy/catalog.istioinaction
docker exec -it myk8s-control-plane istioctl proxy-config cluster deploy/catalog.istioinaction

#
docker exec -it myk8s-control-plane istioctl proxy-config endpoint deploy/catalog.istioinaction
docker exec -it myk8s-control-plane istioctl proxy-config endpoint deploy/catalog.istioinaction | wc -l
275- 워크로드가 200개인 중간 클러스터만 돼도 엔보이 설정이 400MB로 늘어나며, 이로 인해 연산 성능, 네트워크 대역폭, 메모리가 더 많이 필요하다.
- 이 설정이 모든 사이드카 프록시에 저장되기 때문이다.
# Sidecar 리소스
Sidecar 리소스를 사용해 사이드카 프록시에 드나드는 트래픽의 설정을 세밀하게 조정할 수 있다.
apiVersion: networking.istio.io/v1beta1
kind: Sidecar
metadata:
  name: default
  namespace: istioinaction
spec:
  workloadSelector:
    labels:
      app: foo
  egress:
  -hosts:
   - "./bar.istioinaction.svc.cluster.local"
   - "istio-system/*"
  outboundTrafficPolicy:
mode: REGISTRY_ONLYworkloadSelector- 사이드카 설정을 적용할 워크로드를 제한한다
ingress- 애플리케이션에 들어오는 트래픽 처리를 지정한다.
- 생략하면, 이스티오는 파드 정의를 조회해 서비스 프록시를 자동으로 설정한다.
egress- 사이드카를 거치는 외부 서비스로의 송신 트래픽 처리를 지정한다.
- 생략되면, 설정은 좀 더 일반적인 사이드카에서 egress 설정을 상속한다 (있는 경우).
- 없으면, 다른 모든 서비스에 접근할 수 있도록 설정하는 기본 동작으로 대처한다.
outboundTrafficPolicy: 송신 트래픽 처리 시 모드 지정.- REGISTRY_ONLY 모드 : 워크로드가 설정한 서비스에만 트래픽을 보낼 수 있게 한다.
- ALLOW_ANY 모드 : 어디로든 트래픽 송신을 허용한다.
Sidecar 리소스를 워크로드에 적용하면, 컨트롤 플레인은 egress 필드를 사용해 워크로드가 어떤 서비스들에 접근해야 하는지 판단한다.
덕분에 컨트롤 플레인은 관련 있는 설정과 업데이트를 파악하고 해당 프록시로만 보낼 수 있다.
결과, 다른 모든 서비스에 도달하는 방법에 대한 설정을 모두 생성하고 배포하는 일을 방지해 ‘CPU, 메모리, 네트워크 대역폭 소모’를 줄일 수 있다.
# 메시 범위 사이드카 설정으로 더 나은 기본값 정의하기
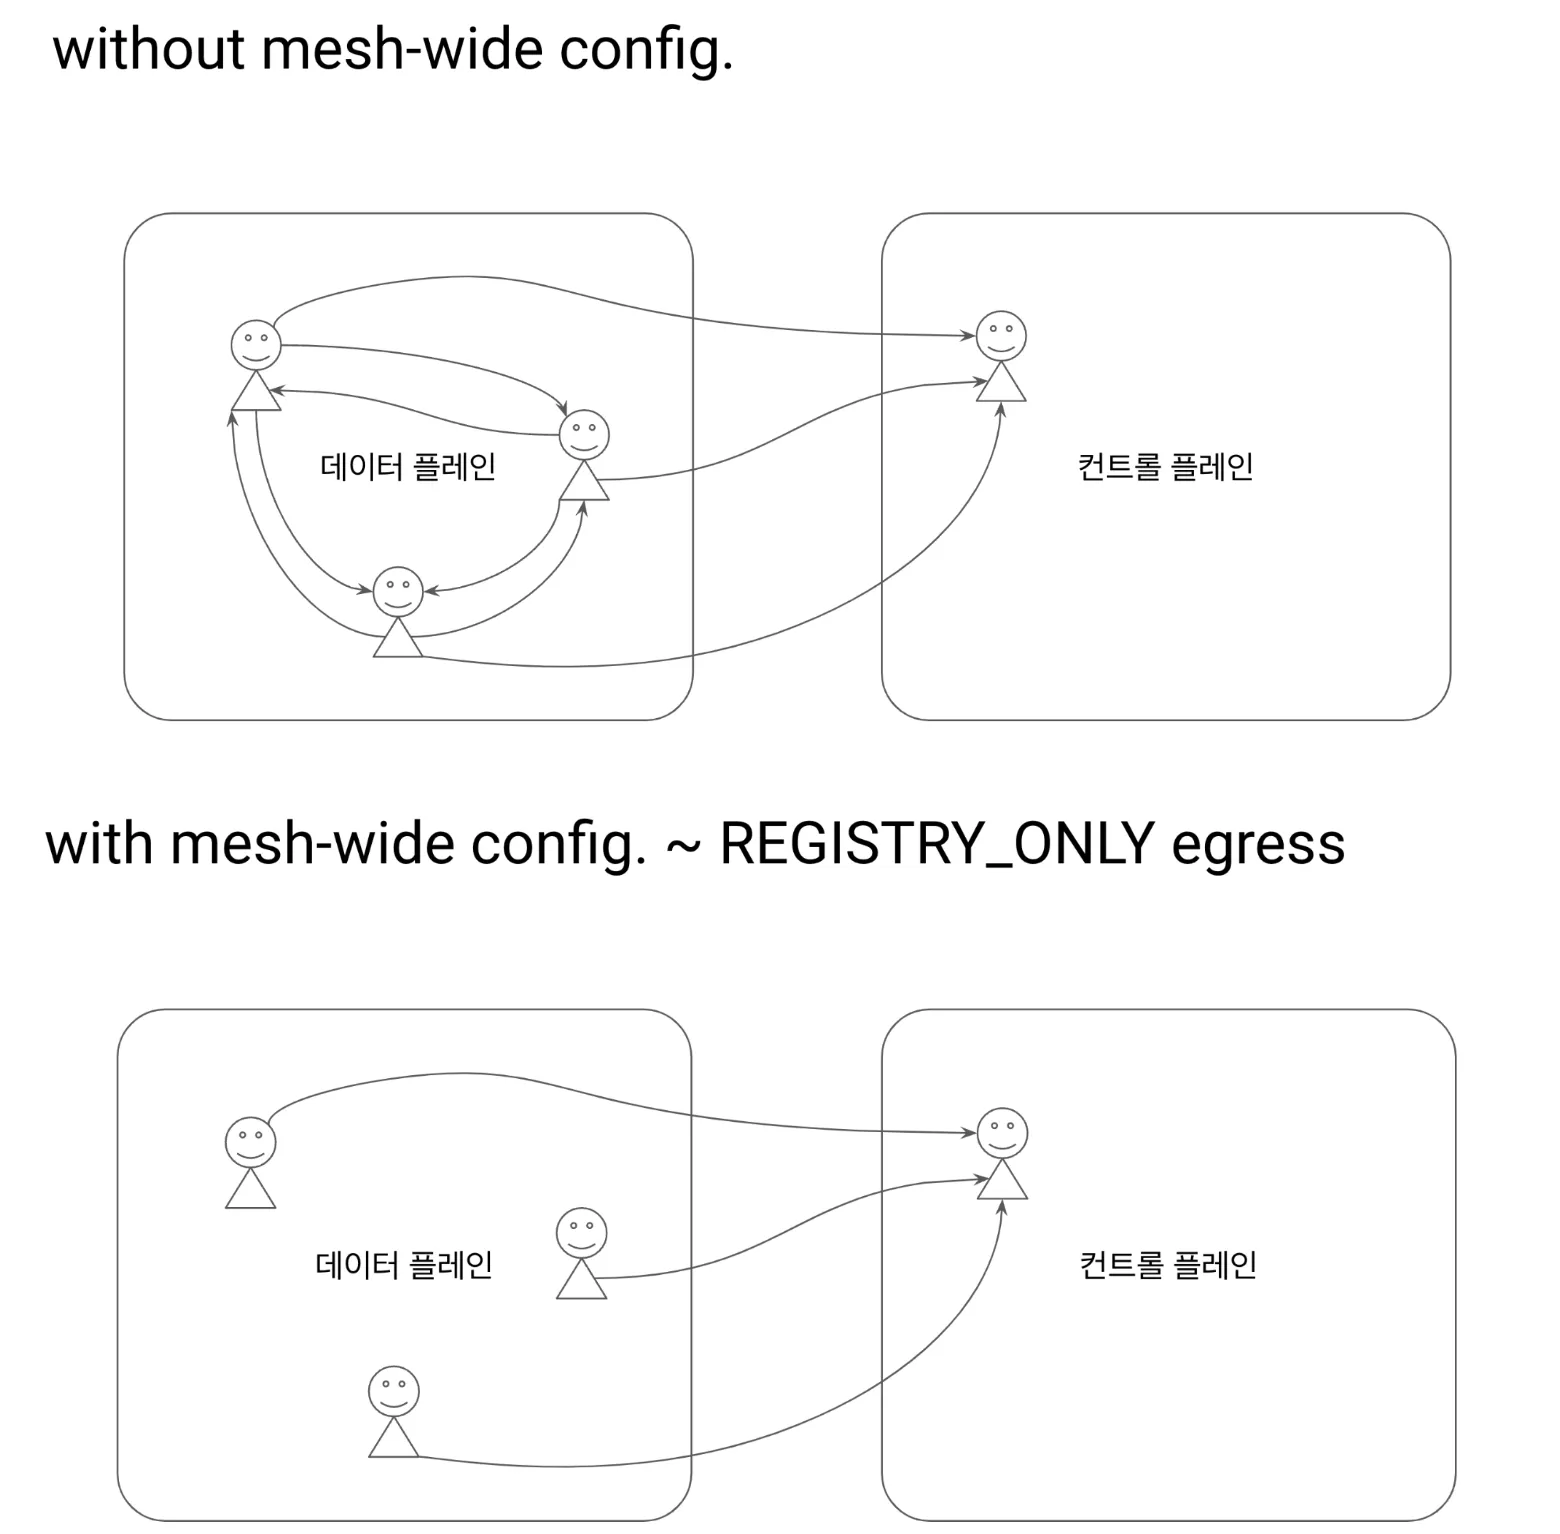
그림 출처 https://netpple.github.io/docs/istio-in-action/Istio-ch11-performance
- 모든 서비스 프록시로 전송되는 엔보이 설정을 줄여 컨트롤 플레인 성능을 개선할 수 있는 가장 쉬운 방법은 트래픽 송신을 istio-system 네임스페이스의 서비스로만 허용하는 사이드카 설정을 메시 범위로 정의하는 것이다.
- 기본값을 이렇게 정의하면, 최소 설정으로 메시 내 모든 프록시가 컨트롤 플레인에만 연결하도록 하고 다른 서비스로의 연결 설정은 모두 삭제할 수 있다.
- 이 방식은 서비스 소유자를 올바른 길로 유도하는데, 워크로드용 사이드카 정의를 좀 더 구체적으로 정의하고 서비스에 필요한 트래픽 송신을 모두 명시적으로 기술함게 함(강제 유도?)으로써 워크로드가 프로세스에 필요한 관련 설정을 최소한으로 수신할 수 있게 한다.
다음 사이드카 정의를 사용하면, 메시 내 모든 서비스 사이트가가 istio-system 네임스페이스에 있는 이스티오 서비스로만 연결하도록 설정할 수 있다.
# cat ch11/sidecar-mesh-wide.yaml
apiVersion: networking.istio.io/v1beta1
kind: Sidecar
metadata:
  name: default # istio-system 네임스페이스의 사이드카는 메시 전체에 적용된다.
  namespace: istio-system # 위 설명 동일.
spec:
  egress:
  - hosts:
    - "istio-system/*" # istio-system 네임스페이스의 워크로드만 트래픽 송신을 할 수 있게 설정한다.
    - "prometheus/*"   # 프로메테우스 네임스페이스도 트래픽 송신을 할 수 있게 설정한다.
  outboundTrafficPolicy:
    mode: REGISTRY_ONLY # 모드는 사이드카에 설정한 서비스로만 트래픽 송신을 허용한다
# 테스트를 위해 샘플 nginx 배포
cat << EOF | kubectl apply -f -
apiVersion: apps/v1
kind: Deployment
metadata:
name: nginx
labels:
app: nginx
spec:
replicas: 1
selector:
matchLabels:
app: nginx
template:
metadata:
labels:
app: nginx
spec:
containers:
- name: nginx
image: nginx:alpine
ports:
- containerPort: 80
---
apiVersion: v1
kind: Service
metadata:
name: nginx
spec:
selector:
app: nginx
ports:
- protocol: TCP
port: 80
targetPort: 80
type: ClusterIP
EOF
# catalog 에서 nginx 서비스 접속 확인
docker exec -it myk8s-control-plane istioctl proxy-config route deploy/catalog.istioinaction | grep nginx
docker exec -it myk8s-control-plane istioctl proxy-config cluster deploy/catalog.istioinaction | grep nginx
docker exec -it myk8s-control-plane istioctl proxy-config endpoint deploy/catalog.istioinaction | grep nginx
10.10.0.26:80 HEALTHY OK outbound|80||nginx.default.svc.cluster.local
kubectl exec -it deploy/catalog -n istioinaction -- curl nginx.default | grep title
<title>Welcome to nginx!</title>
# istio-system, prometheus 네임스페이스만 egress 허용 설정
kubectl -n istio-system apply -f ch11/sidecar-mesh-wide.yaml
kubectl get sidecars -A
# catalog 에서 nginx 서비스 접속 확인
docker exec -it myk8s-control-plane istioctl proxy-config route deploy/catalog.istioinaction | grep nginx
docker exec -it myk8s-control-plane istioctl proxy-config cluster deploy/catalog.istioinaction | grep nginx
docker exec -it myk8s-control-plane istioctl proxy-config endpoint deploy/catalog.istioinaction | grep nginx
kubectl exec -it deploy/catalog -n istioinaction -- curl nginx.default | grep title
# envoy config 크기 다시 확인!
CATALOG_POD=$(kubectl -n istioinaction get pod -l app=catalog -o jsonpath={.items..metadata.name} | cut -d ' ' -f 1)
kubectl -n istioinaction exec -ti $CATALOG_POD -c catalog -- curl -s localhost:15000/config_dump > /tmp/config_dump
du -sh /tmp/config_dump
500K /tmp/config_dump설정 크기가 줄어, 컨트롤 플에인은 Push를 더 적게 할 것이다.
- 성능 테스트
# 성능 테스트 스크립트 실행!
./bin/performance-test.sh --reps 10 --delay 2.5 --prom-url prometheus.istio-system.svc.cluster.local:9090
...
Push count: 88 # 변경 사항을 적용하기 위한 푸시 함수
Latency in the last minute: 0.10 seconds # 마지막 1분 동안의 지연 시간

# 확인
kubectl get svc -n istioinaction --no-headers=true | wc -l
kubectl get gw -n istioinaction --no-headers=true | wc -l
kubectl get vs -n istioinaction --no-headers=true | wc -l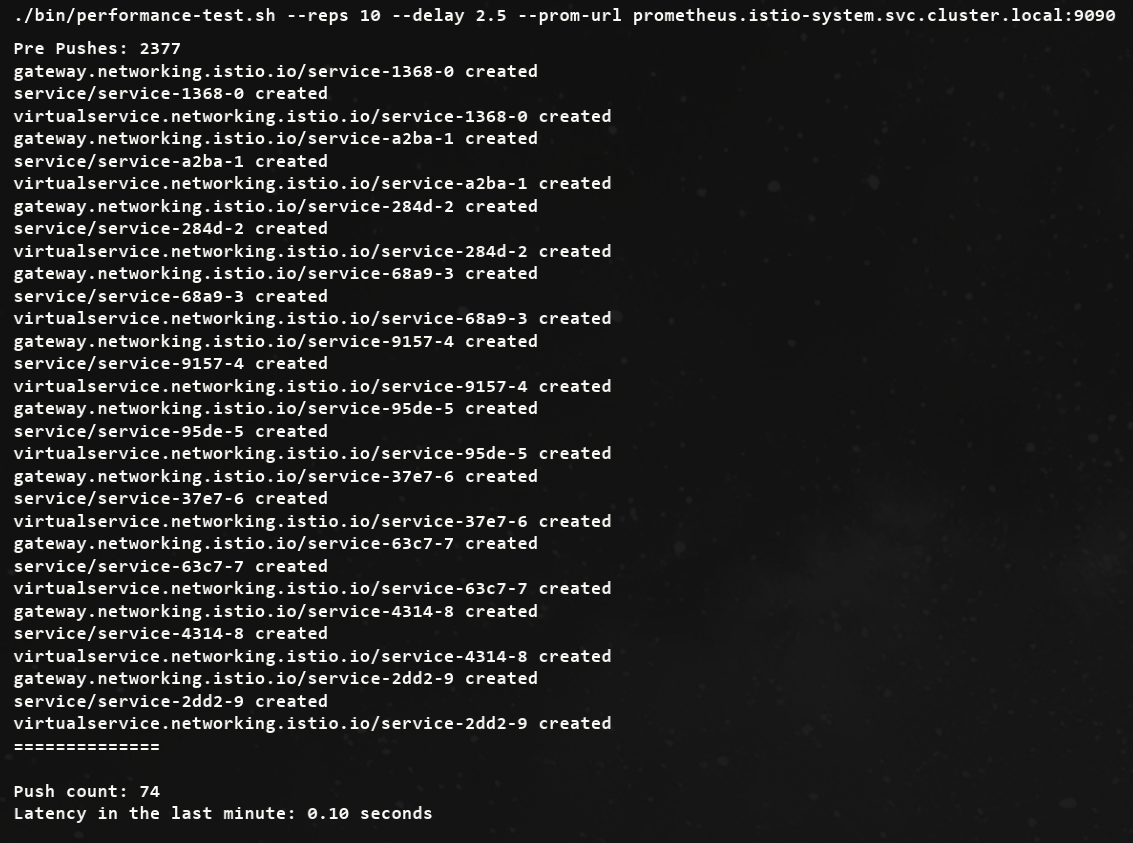
이 성능 향상은 메시 범위 Sidecar 리소스를 정의하는 것이 얼마나 중요한지 보여준다.
사이드카 설정 범위
사이드카 설정은 PeerAuthentication 리소스와 비슷하게 다양한 범위에서 적용할 수 있다.
- mesh-wide 메시 범위 사이드카는 메시 내 모든 워크로드에 적용돼 기본값을 정의할 수 있다. 다른 규칙을 명시적으로 지정하지 않는 한 트래픽 송신을 제한하는 식이다. 메시 범위 사이트카 설정을 만들려면, 이스티오를 설치한 네임스페이스(우리의 경우 istio-system)에 적용하면 된다. 메시 범위 사이드카의 이름 컨벤션은 default이다.
- namespace-wide 네임스페이스 범위 사이드카 설정은 좀 더 구체적이며 메시 범위 설정을 덮어 쓴다. 네임스페이스 범위 사이드카 설정을 만들려면, workloadSelector 필드를 정의하지 않고 원하는 네임스페이스에 적용하자. 네임스페이스 범위 사이드카의 이름 컨벤션은 default이다.
- workload-specific 워크로드별 사이트카 설정은 workloadSelector 속성에 부합하는 특정 워크로드를 목표로 한다. 가장 구체적인 설정으로, 메시 범위와 네임스페이스 범위 설정 모두를 덮어 쓴다.
11.3.3 Ignoring events: Reducing the scope of discovery using discovery selectors
이스티오 컨트롤 플레인이 기본적으로 K8S 모든 네임스페이스의 파드, 서비스와 기타 리소스의 생성 이벤트를 감지한다는 것
-
대규모 클러스터는 컨트롤 플레인에 부담되어, 줄이기 위해
Istio 1.10에는 네임스페이스 디스커비리 셀렉터 discovery selector 라는 기능이 새로이 추가돼 istiod 컨트롤 플레인이 감시할 이벤트를 세밀하게 조정할 수 있다. -
다음과 같이 IstioOperator 파일을 사용해 시작 시 디스커버리 설렉터 기능을 활성화할 수 있다.
apiVersion: install.istio.io/v1alpha1
kind: IstioOperator
metadata:
  namespace: istio-system
spec:
  meshConfig:
    discoverySelectors: # 디스커버리 셀렉터 활성화
      - matchLabels:
istio-discovery: enabled # 사용할 레이블 지정- 네임스페이스 대부분을 포함하고 소규모만 제외하려는 경우에는 레이블 비교 표현식을 사용해 어떤 네임스페이스를 포함하지 않을 수 있다.
apiVersion: install.istio.io/v1alpha1
kind: IstioOperator
metadata:
  namespace: istio-system
spec:
  meshConfig:
    discoverySelectors:
      - matchExpressions:
        - key: istio-exclude
          operator: NotIn
          values:
- "true"- 모든 항목을 살피는 기존 동작을 방해하지 않고 istio-exclude: true 레이블이 있는 네임스페이스만 제외하도록 다음과 같이 업데이트할 수 있다.
cat ch11/istio-discovery-selector.yaml

#
docker exec -it myk8s-control-plane cat /istiobook/ch11/istio-discovery-selector.yaml
docker exec -it myk8s-control-plane istioctl install -y -f /istiobook/ch11/istio-discovery-selector.yaml

#
kubectl get istiooperators.install.istio.io -A -o json
...
                "meshConfig": {
                    "accessLogEncoding": "JSON",
                    "accessLogFile": "/dev/stdout",
                    "defaultConfig": {
                        "proxyMetadata": {}
                    },
                    "discoverySelectors": [
                        {
                            "matchExpressions": [
                                {
                                    "key": "istio-exclude",
                                    "operator": "NotIn",
                                    "values": [
                                        "true"
...
실습
#
kubectl create ns new-ns
kubectl label namespace new-ns istio-injection=enabled
kubectl get ns --show-labels

# 테스트를 위해 샘플 nginx 배포
cat << EOF | kubectl apply -n new-ns -f -
apiVersion: apps/v1
kind: Deployment
metadata:
  name: nginx
  labels:
    app: nginx
spec:
  replicas: 1
  selector:
    matchLabels:
      app: nginx
  template:
    metadata:
      labels:
        app: nginx
    spec:
      containers:
      - name: nginx
        image: nginx:alpine
        ports:
        - containerPort: 80
---
apiVersion: v1
kind: Service
metadata:
  name: nginx
spec:
  selector:
    app: nginx
  ports:
  - protocol: TCP
    port: 80
    targetPort: 80
  type: ClusterIP
EOF

# 확인
kubectl get deploy,svc,pod -n new-ns
docker exec -it myk8s-control-plane istioctl proxy-config endpoint deploy/istio-ingressgateway.istio-system | grep nginx
10.10.0.26:80                                           HEALTHY     OK                outbound|80||nginx.default.svc.cluster.local
10.10.0.27:80                                           HEALTHY     OK                outbound|80||nginx.new-ns.svc.cluster.local

# 설정
kubectl label ns new-ns istio-exclude=true
kubectl get ns --show-labels

# 다시 확인
docker exec -it myk8s-control-plane istioctl proxy-config endpoint deploy/istio-ingressgateway.istio-system | grep nginx
10.10.0.26:80                                           HEALTHY     OK                outbound|80||nginx.default.svc.cluster.loca
11.3.4 Event-batching and push-throttling properties
디바운스 기반
-
데이터 플레인 설정을 바꾸는 런타임 환경 이벤트는 보통 운영자가 제어할 수 없는 것이다.
-
새로운 서비스가 온라인 상태가 되는 것, 복제본 스케일 아웃, 서비스가 비정상이 되는 것 같은 이벤트들은 모두 컨트롤 플레인이 감지해 데이터 플레인 프록시를 조정한다.
-
그래도 업데이트를 얼마나 지연해서 배치 처리할지 정도는 어느 정도 제어할 수 있다.
-
배치 처리하면, 이벤트를 한 묶음으로 처리함으로써 엔보이 설정을 한 번만 만들어 데이터 플레인 프록시로 한 번에 푸시할 수 있다는 이점이 있다.
-
그림 11.9의 순서도는 이벤트 수신이 서비스 프록시로 변경 사항을 푸시하는 작업을 어떻게 지연시키는지(디바운스)를 보여준다.
-
디바운스 기반을 더 늘리면, 지연 기간에서 제외됐던 마지막 이벤트도 배치에 포함시켜 모든 이벤트를 하나의 배치로 합침으로써 하나의 요청으로 푸시할 수 있게된다.
워크로드에 최신 설정을 Push하기 위한 동작 과정
- 그러나 푸시를 너무 미루면 데이터 플레인 설정이 오래돼 최신 상태가 아니게 될 수 있는데, 상술한 것처럼 이런 상황 역시 원하는 바가 아니다.
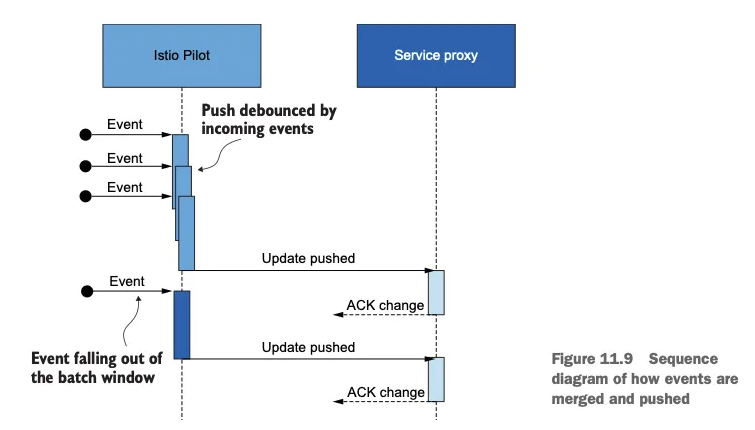
이벤트가 어떻게 병합돼 푸시되는지를 보여주는 순서도
# 배치 기간과 푸시 스로틀링을 정의하는 환경 변수
-
PILOT_DEBOUNCE_AFTER
- 이벤트를 푸시 대기열에 추가하는 디바운스할 시간을 지정한다.
- 기본값은 100ms인데, 그 의미는 컨트롤 플레인이 이벤트를 받았을 때 푸시 대기열에 추가하는 행동을 100ms 디바운스한다는 것이다.
- 이 기간 동안에 추가로 발생하는 이벤트는 앞서 발생한 이벤트에 통합돼 작업이 다시 디바운스한다.
- 이 기간 동안 이벤트가 발생하지 않으면, 결과 배치가 푸시 대기열에 추가돼 처리할 준비가 된다.
- 예) 100ms (기본값) 이내에 새로운 이벤트가 없으면 queue에 추가하고, 있으면 merge 후 다시 100ms 동안 대기 + 단, 최대 PILOT_DEBOUNCE_MAX 이내에서 허용
-
PILOT_DEBOUNCE_MAX
- 이벤트 디바운스를 허용할 최대 시간을 지정한다.
- 이 시간이 지나면 현재 병합된 이벤트가 푸시 대기열에 추가된다. 이 변수의 기본값은 10초다.
-
PILOT_ENABLE_EDS_DEBOUNCE
-
엔드포인트 업데이트가 디바운스 규칙을 준수할지, 우선권을 줘 푸시 대기열에 즉시 배치할지를 지정한다.
-
이 변수의 기본값은 true이며, 엔드포인트 업데이트도 디바운스된다는 의미다.
-
-
PILOT_PUSH_THROTTLE
- istiod가 동시에 처리하는 푸시 요청 개수를 지정한다.
- 이 변수의 기본값은 100개의 동시 푸시다. CPU 사용률이 낮은 경우, 스로틀 값을 높여서 업데이트를 더 빠르게 할 수 있다.
# 배치 기간 늘리기
배치의 효과를 보여주기 위해 PILOT_DEBOUNCE_AFTER 값을 말도 안 되게 높은 값인 2.5초로 지정
# myk8s-control-plane 진입 후 설치 진행
docker exec -it myk8s-control-plane bash
-----------------------------------
# demo 프로파일 컨트롤 플레인 배포 시 적용
istioctl install --set profile=demo --set values.pilot.env.PILOT_DEBOUNCE_AFTER="2500ms" --set values.global.proxy.privileged=true --set meshConfig.accessLogEncoding=JSON -y
exit
-----------------------------------

#
kubectl get deploy/istiod -n istio-system -o yaml
...
        - name: PILOT_DEBOUNCE_AFTER
          value: 2500ms
...

# 성능 테스트 스크립트 실행!
./bin/performance-test.sh --reps 10 --delay 2.5 --prom-url prometheus.istio-system.svc.cluster.local:9090
Push count: 21 # 변경 사항을 적용하기 위한 푸시 함수
Latency in the last minute: 0.10 seconds # 마지막 1분 동안의 지연 시간
엔보이 설정을 만들고 워크로드로 푸시하는 추가 작업을 모두 피해 CPU 사용률과 네트워크 대역폭 소모가 줄어든다.
설정을 변경할 때는 컨트롤 플레인의 성능에 부정적인 영향을 줄 수 있는 큰 변화 대신에 조금씩 조절하는 것이 더 안전하다.
# 지연 시간 메트릭은 디바운스 기간을 고려하지 않는다!
- 지연 시간 메트릭이 측정하는 기간은 푸시 요청이 푸시 대기열에 추가된 시점부터 시작됨을 기억하자.
- 즉, 이벤트들이 디바운드되는 동안 업데이트는 전달되지 않았다.
- 따라서 업데이트를 푸시하는 시간은 늘어났지만, 이는 지연 시간 메트릭에서는 나타나지 않는다
데이터 플레인은 보통 늦은 엔드포인트 업데이트에 영향을 받는다.
환경 변수 PILOT_ENABLE_EDS_DEBOUNCE를 false로 설정하면 엔드포인트 업데이트가 디바운스 기간을 건너뛰어 지연되지 않음을 보장할 수 있다.
# 컨트롤 플레인에 리소스 추가 할당하기
- Sidecar 리소스를 정의하고 discovery selectors를 사용하고 배치를 설정한 후, 성능을 향상 시킬 수 있는 유일한 방법은 컨트롤 플레인에 리소스를 더 할당하는 것이다.
- 리소스를 더 할당할 때는 istiod 인스턴스를 추가해 스케일 아웃하거나, 모든 istiod 인스턴스에 리소스를 추가로 제공해 스케일 업할 수 있다.
- 스케일 업
kubectl get pod -n istio-system -l app=istiod
kubectl describe pod -n istio-system -l app=istiod
...
    Requests:
      cpu:      10m
      memory:   100Mi
...

kubectl resource-capacity -n istio-system -u -l app=istiod
NODE                  CPU REQUESTS   CPU LIMITS   CPU UTIL   MEMORY REQUESTS   MEMORY LIMITS   MEMORY UTIL
myk8s-control-plane   10m (0%)       0m (0%)      8m (0%)    100Mi (0%)        0Mi (0%)        90Mi (0%)


# myk8s-control-plane 진입 후 설치 진행
docker exec -it myk8s-control-plane bash
-----------------------------------
# demo 프로파일 컨트롤 플레인 배포 시 적용
istioctl install --set profile=demo \
--set values.pilot.resources.requests.cpu=1000m \
--set values.pilot.resources.requests.memory=1Gi \
--set values.pilot.replicaCount=2 -y

exit
-----------------------------------

#
kubectl get pod -n istio-system -l app=istiod
NAME                      READY   STATUS    RESTARTS   AGE
istiod-5485dd8c48-6ngdc   1/1     Running   0          11s
istiod-5485dd8c48-chjsz   1/1     Running   0          11s

kubectl resource-capacity -n istio-system -u -l app=istiod
NODE                  CPU REQUESTS   CPU LIMITS   CPU UTIL    MEMORY REQUESTS   MEMORY LIMITS   MEMORY UTIL
myk8s-control-plane   2000m (25%)    0m (0%)      119m (1%)   2048Mi (17%)      0Mi (0%)        107Mi (0%)

kubectl describe pod -n istio-system -l app=istiod
...
    Requests:
      cpu:      1
      memory:   1Gi
...
# Istiod 디플로이먼트 오토스케일링
- 오토스케일링은 일반적으로 리소스 소모를 최적화할 수 있는 좋은 아이디어다. 이스티오 컨트롤 플레인과 같이 부하가 급증할 수 있는 워크로드의 경우에는 특히 그렇다.
- 현재로서는 istiod에 효과적이지 않은데, isiotd가 워크로드와 30분 커넥션을 시작하기 때문이다. 이 커넥션은 ADS로 프록시를 설정하고 업데이트하는 데 사용하는 것이다.
- 새로이 생성된 istiod 복제본은 서비스 프록시와 종전 파일럿 사이의 커넥션이 만료될 때까지는 아무런 부하를 받지 않는다.
- 아무런 부하를 받지 않으니 새 istiod 복제본은 축소된다.
- 이론 인해 아래 그림과 같이 디플로이먼트가 반복적으로 확장됐다가 축소되는 퍼덕거림(flapping)이 일어나게 된다.
11.4 Performance tuning guidelines
1. 성능 문제인지 확인하자. 다음과 같은 질문이 있다.
- 데이터 플레인에서 컨트롤 플레인으로 연결이 제대로 이뤄지고 있는가?
- 플랫폼 문제인가? 이를테면 쿠버네티스에서 API 서버가 정상인가?
- 변경 범위를 지정하도록 Sidecar 리소스를 정의했는가?
2. 성능 병목 지점을 파악
수집된 지연 시간, 포화도, 트래픽에 대한 메트릭을 사용해 튜닝 결정이 필요
- 컨트롤 플레인이 포화 상태도 아닌데 지연 시간이 증가하면 리소스가 최적으로 활용되지 않고 있다는 것을 나타낸다.
- 사용률은 낮지만 부하가 걸렸을 때 빠르게 포화 상태가 되면 변경 사항이 매우 폭발적임을 나타낸다.
- 변경은 점진적으로 수행.
- 안전은 최우선으로 생각하자.
- 버스트 가능한 burstable 가상머신을 사용하는 것을 고려하자.
Summary
- 컨트롤 플레인의 주요 목표는 데이터 플레인을 원하는 상태로 동기화하는 것이다.
- 이스티오 파일럿 성능에 영향을 주는 요소에는 변경 속도, 파일럿에 할당한 리소스양, 파일럿이 관리하는 워크로드 개수, 설정 크기가 있다.
- 기반 플랫폼에서 받는 변경 속도는 우리가 제어할 수 없다. 그러나 이벤트를 배치 처리할 기간을 정의해 데이터 플레인을 업데이트할 작업량을 줄일 수는 있다.
- istiod에는 리소스를 관대하게 할당하자. default 운영 환경 프로필은 좋은 출발점이다.
- 항상 sidecar 커스텀 리소스를 사용해 변경 범위를 지정하자. 그렇게 하면 다음과 같은 효과를 얻는다.
- 한 이벤트에서 업데이트하는 워크로드가 적어진다.
- 관련 설정만 보내기 때문에 엔보이 설정 크기가 줄어든다.
- discovery selectors 를 사용해 메시와 성관없는 네임스페이스의 이벤트는 무시하자.
- 컨트롤 플레인 튜닝 방법을 결정하는 데 그라파나의 Istio Control Plane 대시보드를 사용하자.
