CloudNet@에서 진행하는 Istio Study 4주차 8장 내용입니다.
📕 This chapter cover
- Using Grafana to observe metrics visually
- Distributed tracing instrumentation with Jaeger
- Visualizing the network call graph with Kiali
8.1 Using Grafana to visualize Istio service and control-plane metrics
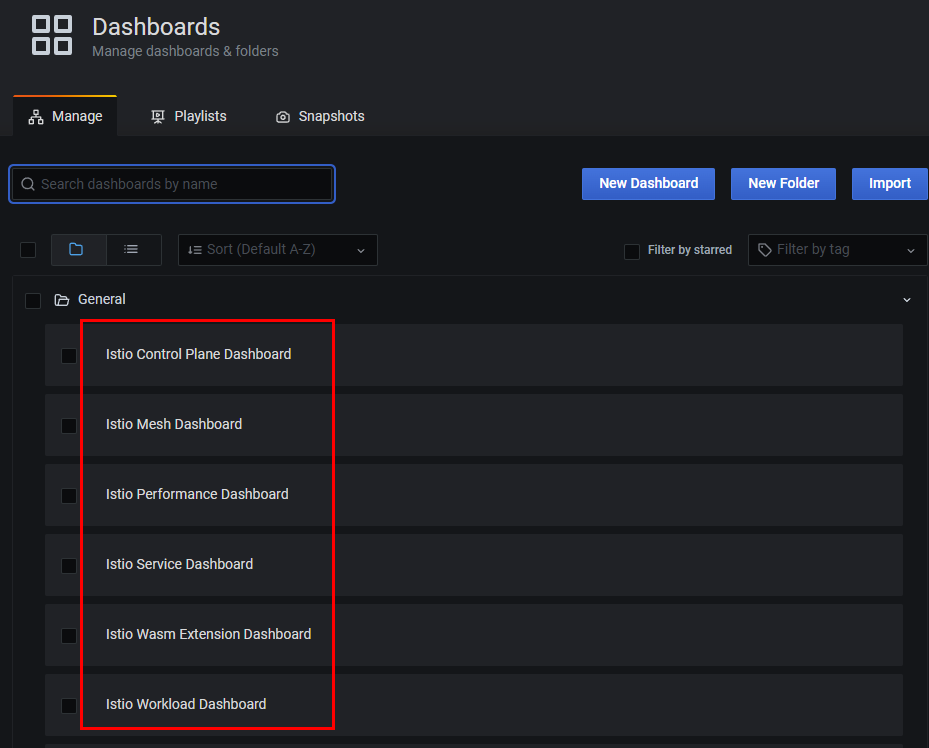
8.1.1 Setting up Istio’s Grafana dashboards
- 책 제공 소스 코드에 대시보드를 추가 설정
#
cd ch8

kubectl -n prometheus create cm istio-dashboards \
--from-file=pilot-dashboard.json=dashboards/\
pilot-dashboard.json \
--from-file=istio-workload-dashboard.json=dashboards/\
istio-workload-dashboard.json \
--from-file=istio-service-dashboard.json=dashboards/\
istio-service-dashboard.json \
--from-file=istio-performance-dashboard.json=dashboards/\
istio-performance-dashboard.json \
--from-file=istio-mesh-dashboard.json=dashboards/\
istio-mesh-dashboard.json \
--from-file=istio-extension-dashboard.json=dashboards/\
istio-extension-dashboard.json

# 확인
cd ..
kubectl describe cm -n prometheus  istio-dashboards

# Grafana (오퍼레이터)가 configmap(istio-dashboards)을 마운트(인식) 하도록 레이블 지정
kubectl label -n prometheus cm istio-dashboards grafana_dashboard=1

# (참고) Grafana 대시보드 추가
kubectl stern -n prometheus prom-grafana
prom-grafana-d7f5cb646-555zp grafana-sc-dashboard [2025-04-27 05:58:21] File in configmap istio-extension-dashboard.json ADDED
prom-grafana-d7f5cb646-555zp grafana-sc-dashboard [2025-04-27 05:58:21] File in configmap istio-mesh-dashboard.json ADDED
prom-grafana-d7f5cb646-555zp grafana-sc-dashboard [2025-04-27 05:58:21] File in configmap istio-performance-dashboard.json ADDED
prom-grafana-d7f5cb646-555zp grafana-sc-dashboard [2025-04-27 05:58:21] File in configmap istio-service-dashboard.json ADDED
prom-grafana-d7f5cb646-555zp grafana-sc-dashboard [2025-04-27 05:58:21] File in configmap istio-workload-dashboard.json ADDED
prom-grafana-d7f5cb646-555zp grafana-sc-dashboard [2025-04-27 05:58:21] File in configmap pilot-dashboard.json ADDED
...
8.1.2 Viewing control-plane metrics
- 그라파나 대시보드 → Istio Control Plane Dashboard 선택 : 앞 장에서 컨트롤 플레인을 긁어가도록 ServiceMonitor 리소스 설정
- CPU, 메모리, 고루틴 같은 정보뿐 아니라 컨트롤 플레인 오류, 설정 동기화 문제, 활성 데이터 플레인 커넥션 갯수 등에 대한 데이터도 보인다.
- 아래 그림 처럼 그래프 중 하나의 세부 사항을 누르고 Explore 로 그래프를 만들어내는 데 사용하는 원본 쿼리를 살펴보자.
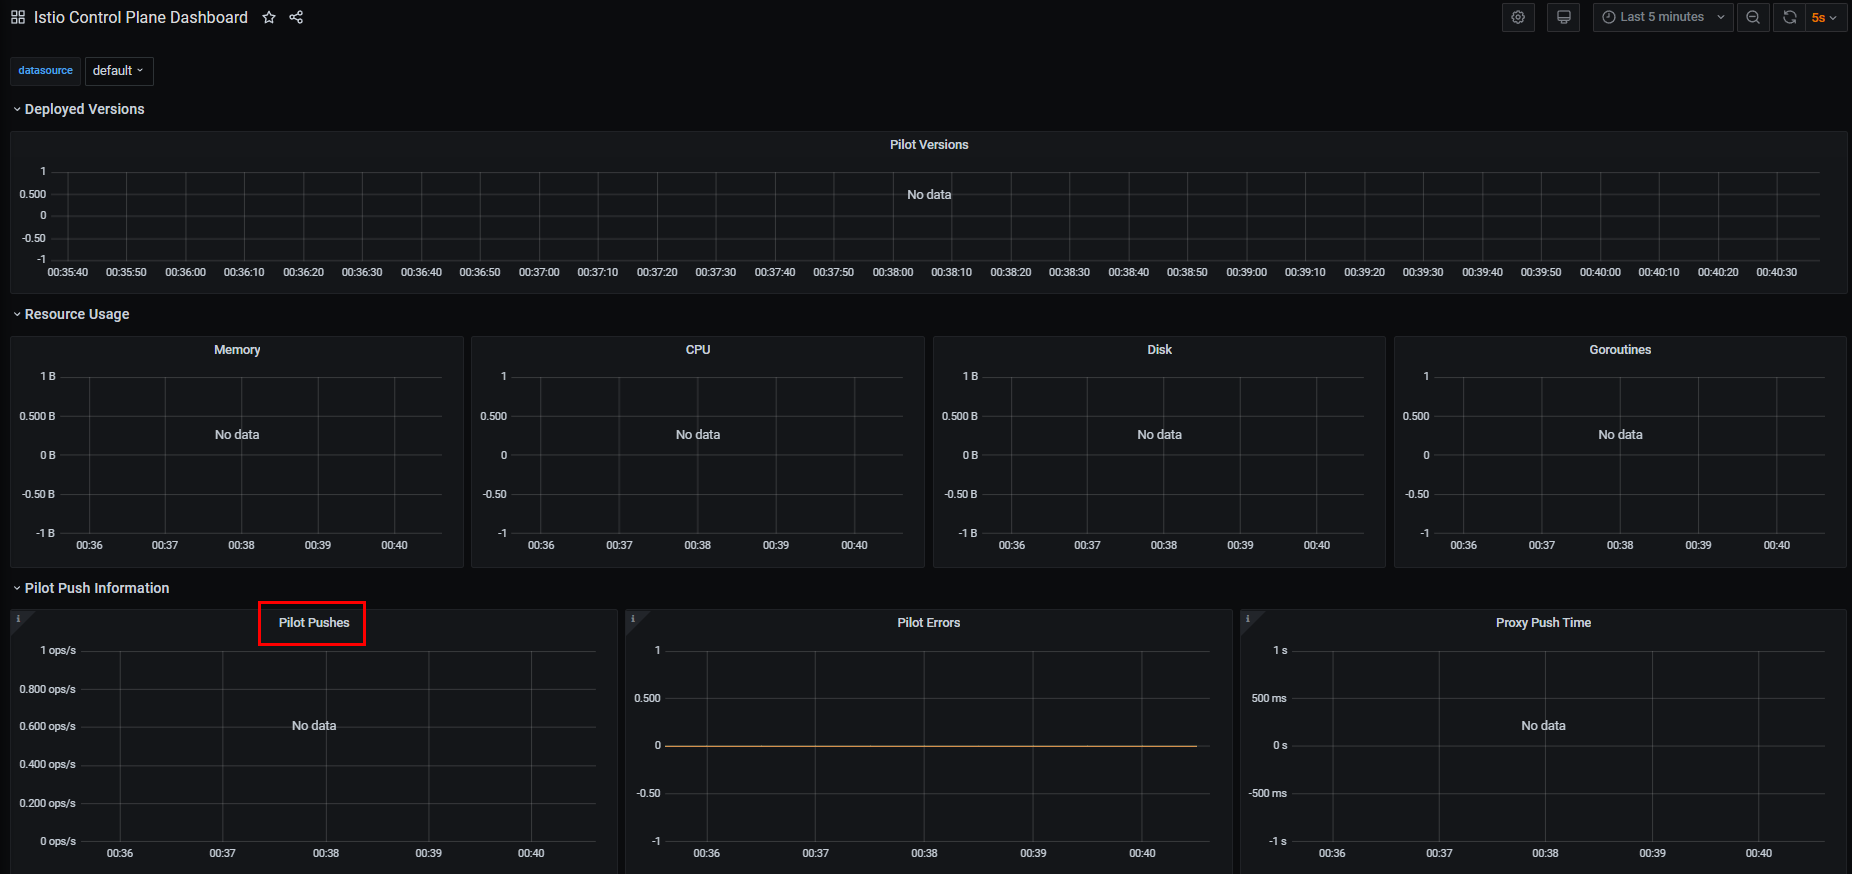
sum(irate(pilot_xds_pushes{type="rds"}[1m]))8.1.3 Viewing data-plane metrics
8.2 Distributed tracing
# 분산 트레이싱의 필요성
- 더 많은 애플리케이션을 마이크로서비스로 구축할수록, 그림 8.6처럼 비즈니스 목표를 달성하기 위해 협업하는 분산 구성 요소의 네트워크를 만들어가는 것이다.
- 요청 경로에서 문제가 발생하기 시작하면, 무슨 일이 일어나고 있는지 이해하는 것은 매우 중요하다.
- 그래야 빠르게 진단하고 고칠 수 있기 때문이다.
- 이때 붙이는 주석은 서비스 간 호출을 나타내는 상관관계 correlation ID와 서비스 간 호출 그래프를 거치는 특정 요청을 나타내는 트레이스 trace ID 이다.
- 이스티오의 데이터 플레인은 요청이 데이터 플레인을 통과할 때 이런 메타데이터를 요청에 추가할 수 있다 (그리고 인식할 수 없거나 외부 개체에서 온 메타데이터는 제거한다는 점이 중요하다)
OpenTelemetry?
커뮤니티 주도 프레임워크로, 오픈트레이싱을 포함한다.
- 여기서 오픈트레이싱 OpenTracing 이란 분산 트레이싱과 관련된 개념 및 API를 정의하는 사양을 말한다.
분산 트레이싱은 어느 정도 개발자에게 의존하는데, 코드를 계측하는 작업이나 애플리케이션에서 요청을 처리하고 다른 시스템으로 새로운 요청을 보낼 때 요청에 주석을 붙이는 작업이 필요하기 때문이다.
- 모니터링을 위한 코드(instrumenting code) 삽입
- 요청에 어노테이션 (correlation id, trace Id 등) 추가
Istio를 사용하면, 개발자가 직접 구현해야 하는 부담을 크게 덜어줄 수 있으며 분산 트레이싱을 서비스 메시의 일부로 제공할 수 있다.
8.2.1 How does distributed tracing work?
-
가장 단순한 형태의 오픈트레이싱을 활용한 분산 트레이싱은 애플리케이션이 스팬을 생성하고, 이를 오픈트레이싱 엔진과 공유하며, 뒤이어 호출하는 서비스로 트레이스 콘텍스트를 전파하는 것으로 이뤄진다.
-
스팬 span 이란 서비스나 구성 요소 내에서 작업 단위를 나타내는 데이터 모음
-
작업 시작 시각, 종료 시각, 작업 이름, 태그 및 로그 집합 등이 포함
-
업스트림 서비스도 동일한 작업을 수행
-
요청 중 자신이 처리하는 부분을 나타내는 스팬을 만들고, 이를 오픈트레이싱 엔진에 보내고, 트레이스 콘텍스트를 다른 서비스로 전파
-
분산 트레이싱 엔진은 이런 스팬과 트레이스 콘텍스트를 사용해 트레이스를 구축할 수 있다.
트레이스란 서비스 간의 인과 관계를 말하며 방향, 타이밍과 기타 디버깅 정보를 보여준다.
-
스팬에는 스팬 ID와 트레이스 ID가 있다.
-
ID들은 서비스 간의 작업 상관관계를 파악하는 데 사용되며 서비스 간에 전파돼야 한다.
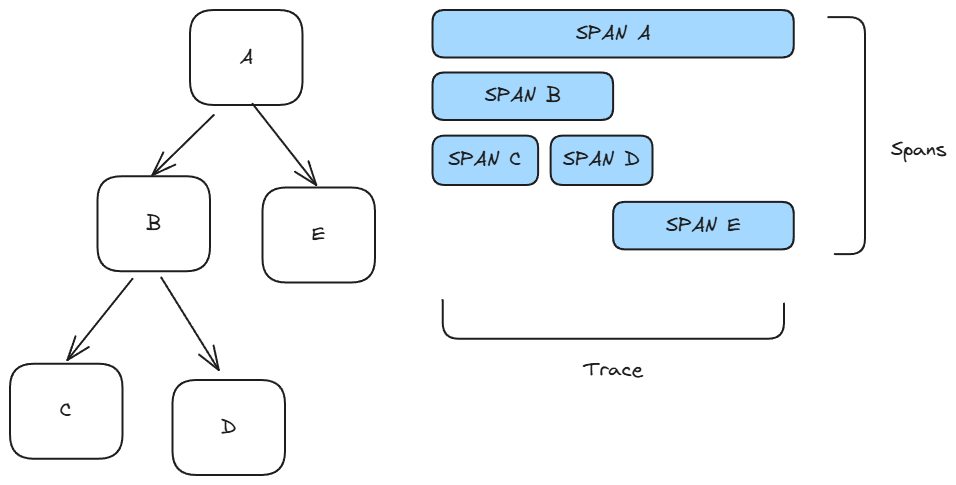
분산 트레이싱을 사용하면, 네트워크 홉마다 스팬을 수집하고 이를 종합적인 트레이스에 담아 호출 그래프 내의 문제를 디버깅하는 데 사용할 수 있다.
오픈트레이싱 구현체에는 다음과 같은 시스템들이 있다.
- Jaeger
- Zipkin
- Lightstep
- Instana
- Istio는 스팬을 분산 트레이싱 엔진으로 보낼 수 있으므로, 이 작업을 위해 언어 전용 라이브러리나 애플리케이션 전용 설정이 필요 없다.
- 후속 스팬을 전체 트레이스에 연관 짓는데 사용할 수 있도록, 보통 집킨 트레이싱 헤더 Zipkin tracing header 라고 하는 HTTP 헤더를 요청에 덧붙인다.
- Istio와 분산 트레이싱 기능에서 사용하는 집킨 트레이싱 헤더는 다음과 같다.
- x-request-id
- x-b3-traceid
- x-b3-spanid
- x-b3-parentspanid
- x-b3-sampled
- x-b3-flags
- x-ot-span-context
Istio가 제공하는 분산 트레이싱 기능이 요청 호출 그래프 전체에 걸쳐 작동하려면, 각 애플리케이션이 이 헤더들이 자신이 하는 모든 호출에 전파해야 한다. (아래 그림 참고)
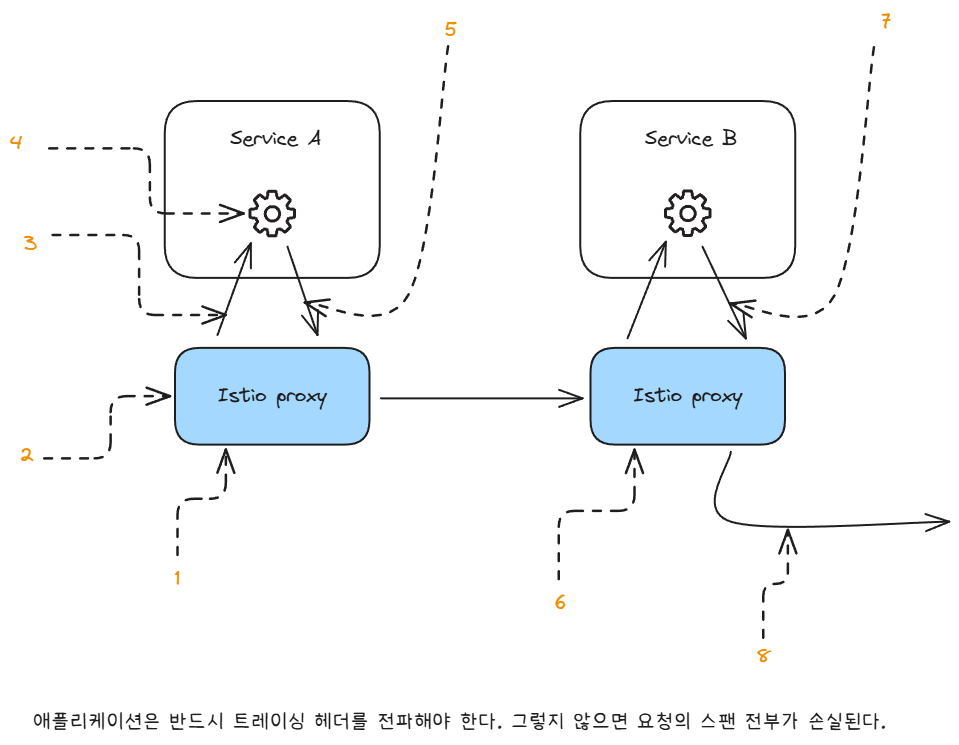
1. 요청이 들어온다.
2. 오! 트레이싱 헤더가 없는 것을 보니 새로운 요청이다.
- 요청이 서비스 사이를 오가는 과정을 추적할 수 있도록 트레이스 헤더를 생성해두자
3. 트레이스 헤더가 요청 헤더에 추가됐다. x-request-id: c9421…
4. 애플리케이션이 다른 서비스를 호출할 때 트레이스 헤더를 전파해야 한다.
5. 트레이스 헤더를 전파한다. x-request-id: c9421…
6. 이스티오 프록시는 기존 트레이스 헤더를 애플리케이션으로 전파한다.
7. 만약 애플리케이션이 요청 헤더를 전파하지 않으면…
8. 요청에 트레이스 헤더가 누락된다. 앱이 전파하지 않았기 때문이다.
- Istio는 어떤 호출이 어떤 수신 요청의 결과물인지 모르기 때문이다.
- 업스트림 호출과 서비스로 들어온 호출을 올바르게 연결하려면, 애플리케이션이 반드시 이런 헤더를 전파하는 역할을 맡아야 한다.
- 대부분의 경우 기본 RPC 프레임워크는 오픈트레이싱과 통합되거나 오픈트레이싱을 직접 지원해 이런 헤더를 자동으로 전파해준다.
- 어느 방식이든 애플리케이션은 이런 헤더가 전파됨을 보장해야 한다.
8.2.2 Installing a distributed tracing system
- 예거는 DB가 필요하여, 일체형 All-In-One 배포 샘플을 이용한다.
- 이 샘플은 zipkin 쿠버네티스 서비스도 만드는데, Istio가 기대하는 기본 설정에 맞춰 만들어지는 덕분에 바로 연결할 수 있다.
# myk8s-control-plane 진입 후 설치 진행
docker exec -it myk8s-control-plane bash
-----------------------------------
# 설치 파일 확인
pwd
ls istio-$ISTIOV/samples/addons
cat istio-$ISTIOV/samples/addons/jaeger.yaml
apiVersion: apps/v1
kind: Deployment
metadata:
  name: jaeger
  namespace: istio-system
  labels:
    app: jaeger
spec:
  selector:
    matchLabels:
      app: jaeger
  template:
    metadata:
      labels:
        app: jaeger
        sidecar.istio.io/inject: "false"
      annotations:
        prometheus.io/scrape: "true"
        prometheus.io/port: "14269"
    spec:
      containers:
        - name: jaeger
          image: "docker.io/jaegertracing/all-in-one:1.35"
          env:
            - name: BADGER_EPHEMERAL
              value: "false"
            - name: SPAN_STORAGE_TYPE
              value: "badger"
            - name: BADGER_DIRECTORY_VALUE
              value: "/badger/data"
            - name: BADGER_DIRECTORY_KEY
              value: "/badger/key"
            - name: COLLECTOR_ZIPKIN_HOST_PORT
              value: ":9411"
            - name: MEMORY_MAX_TRACES
              value: "50000"
            - name: QUERY_BASE_PATH
              value: /jaeger
          livenessProbe:
            httpGet:
              path: /
              port: 14269
          readinessProbe:
            httpGet:
              path: /
              port: 14269
          volumeMounts:
            - name: data
              mountPath: /badger
          resources:
            requests:
              cpu: 10m
      volumes:
        - name: data
          emptyDir: {}
---
apiVersion: v1
kind: Service
metadata:
  name: tracing
  namespace: istio-system
  labels:
    app: jaeger
spec:
  type: ClusterIP
  ports:
    - name: http-query
      port: 80
      protocol: TCP
      targetPort: 16686
    # Note: Change port name if you add '--query.grpc.tls.enabled=true'
    - name: grpc-query
      port: 16685
      protocol: TCP
      targetPort: 16685
  selector:
    app: jaeger
---
# Jaeger implements the Zipkin API. To support swapping out the tracing backend, we use a Service named Zipkin.
apiVersion: v1
kind: Service
metadata:
  labels:
    name: zipkin
  name: zipkin
  namespace: istio-system
spec:
  ports:
    - port: 9411
      targetPort: 9411
      name: http-query
  selector:
    app: jaeger
---
apiVersion: v1
kind: Service
metadata:
  name: jaeger-collector
  namespace: istio-system
  labels:
    app: jaeger
spec:
  type: ClusterIP
  ports:
  - name: jaeger-collector-http
    port: 14268
    targetPort: 14268
    protocol: TCP
  - name: jaeger-collector-grpc
    port: 14250
    targetPort: 14250
    protocol: TCP
  - port: 9411
    targetPort: 9411
    name: http-zipkin
  selector:
    app: jaeger

# 설치
kubectl apply -f istio-$ISTIOV/samples/addons/jaeger.yaml
deployment.apps/jaeger created
service/tracing created
service/zipkin created
service/jaeger-collector created

# 빠져나오기
exit
-----------------------------------

# 설치 확인 : 예거는 집킨 형식과 호환됨 Jaeger is compatible with the Zipkin format.
# https://www.jaegertracing.io/docs/1.22/features/#backwards-compatibility-with-zipkin
kubectl get deploy,pod,svc,ep -n istio-system

# NodePort 변경 및 nodeport tracing(30004) 변경
kubectl describe svc -n istio-system tracing
...
Port:                     http-query  80/TCP
TargetPort:               16686/TCP
NodePort:                 http-query  31345/TCP
Endpoints:                10.10.0.20:16686
...

kubectl patch svc -n istio-system tracing -p '{"spec": {"type": "NodePort", "ports": [{"port": 80, "targetPort": 16686, "nodePort": 30004}]}}'

# tracing 접속 : 예거 트레이싱 대시보드
open http://127.0.0.1:30004- 설치 완료
8.2.3 Configuring Istio to perform distributed tracing
Istio에서 분산 트레이싱은 메시 전체, 네임스페이스, 특정 워크로드 수준으로 설정할 수 있다.
Istio 1.12는 ‘로깅, 메트릭, 트레이싱’에 좀 더 세분화된 API인 텔레메트리 Telemetry API를 도입했다.
설치 전 트레이싱 설정하기 (방법 1)
-
Istio는 집킨, 데이터독, 예거(집킨 호환)등 분산 트레이싱 백엔드를 지원한다.
-
이스티오를 설치할 때 IstioOperator 리소스를 사용하는 샘플 설정으로, 다양한 분산 트레이싱 백엔드를 설정한다.
apiVersion: install.istio.io/v1alpha1
kind: IstioOperator
metadata:
  namespace: istio-system
spec:
  meshConfig:
    defaultConfig:
      tracing:
        lightstep: {}
        zipkin: {}
        datadog: {}
stackdriver: {}- 예를 들어 집킨 호환형인 예거를 사용하려면 다음과 같이 설정한다. → 현재 실습 설정
#
cat ch8/install-istio-tracing-zipkin.yaml
---
apiVersion: install.istio.io/v1alpha1
kind: IstioOperator
metadata:
namespace: istio-system
spec:
meshConfig:
defaultConfig:
tracing:
sampling: 100
zipkin:
address: zipkin.istio-system:9411
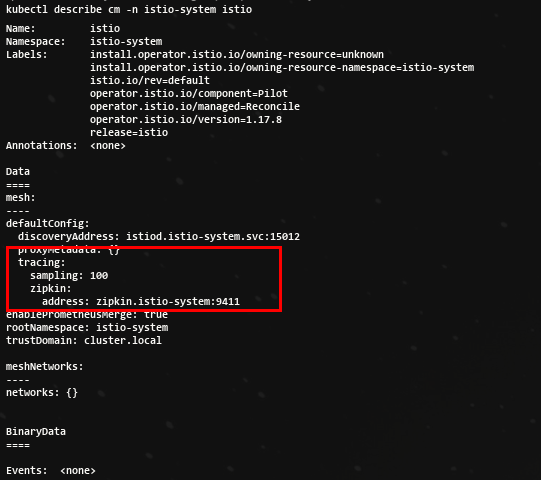
# 기존 설정 확인
kubectl get IstioOperator -n istio-system installed-state -o json
kubectl describe cm -n istio-system istio
...
defaultConfig:
discoveryAddress: istiod.istio-system.svc:15012
proxyMetadata: {}
tracing:
zipkin:
address: zipkin.istio-system:9411
...
# 적용
docker exec -it myk8s-control-plane bash
-----------------------------------
#
cat << EOF > install-istio-tracing-zipkin.yaml
apiVersion: install.istio.io/v1alpha1
kind: IstioOperator
metadata:
namespace: istio-system
spec:
meshConfig:
defaultConfig:
tracing:
sampling: 100
zipkin:
address: zipkin.istio-system:9411
EOF
istioctl install -y -f install-istio-tracing-zipkin.yaml
exit
...- 확인
방법 2 (istio configmap 설정 - MeshConfig 를 이용한 트레이싱 설정)
#
kubectl edit cm -n istio-system istio
방법 3 (워크로드별로 트레이싱 설정하기 : 파드 Spec에 애노테이션 설정)
#
apiVersion: apps/v1
kind: Deployment
...
spec:
  template:
    metadata:
      annotations:
        proxy.istio.io/config: |
          tracing:
            zipkin:
              address: zipkin.istio-system:9411
...
기본 트레이싱 헤더 살펴보기 : 헤더와 ID 자동 주입 확인
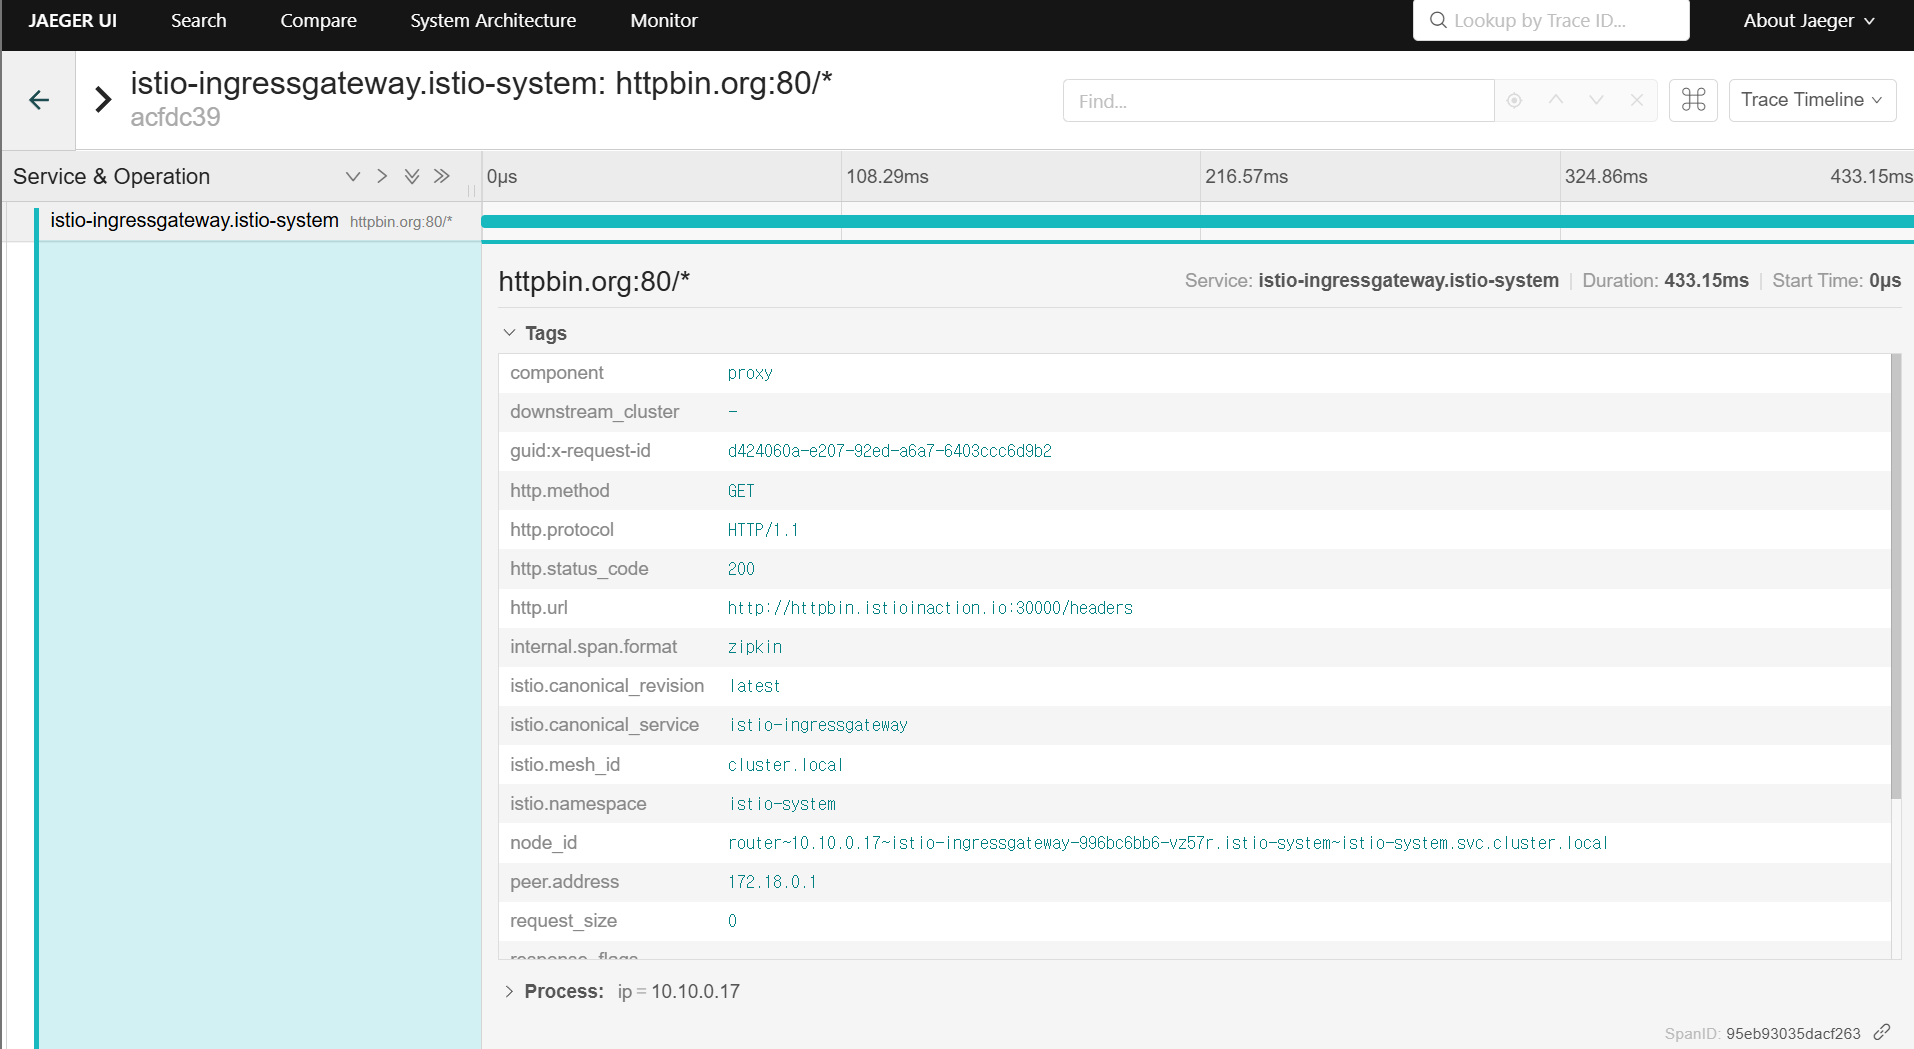
- 이 시점에서 트레이스를 올바른 위치에 보내도록 분산 트레이싱 엔진과 Istio를 설정했다.
- Istio가 오픈트레이싱 헤더와 상관관계 ID를 자동으로 주입한다는 것을 보여주고자 이스티오 인그레스 게이트웨이를 사용해 외부 httpbin 서비스를 호출하고 요청 헤더를 표시하는 엔드포인트를 호출할 것이다.
- 실습에서는
httpbin.istioinaction.io요청 시 외부 서비스 http://httpbin.org 를 호출. - http://httpbin.org 은 simple HTTP 테스트 서비스로 응답 시 헤더 정보를 출력.
- 실습에서는
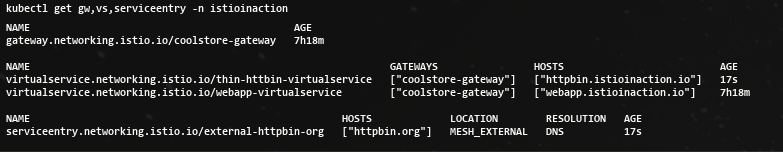
- Istio Gateway, VirtualService 리소스를 배포
#
cat ch8/tracing/thin-httpbin-virtualservice.yaml
---
apiVersion: networking.istio.io/v1alpha3
kind: Gateway
metadata:
  name: coolstore-gateway
spec:
  selector:
    istio: ingressgateway # use istio default controller
  servers:
  - port:
      number: 80
      name: http
      protocol: HTTP
    hosts:
    - "webapp.istioinaction.io"
    - "httpbin.istioinaction.io"
---
apiVersion: networking.istio.io/v1alpha3
kind: VirtualService
metadata:
  name: thin-httbin-virtualservice
spec:
  hosts:
  - "httpbin.istioinaction.io"
  gateways:
  - coolstore-gateway
  http:
  - route:
    - destination:
        host: httpbin.org
---
apiVersion: networking.istio.io/v1alpha3
kind: ServiceEntry
metadata:
  name: external-httpbin-org
spec:
  hosts:
  - httpbin.org
  ports:
  - number: 80
    name: http
    protocol: HTTP
  location: MESH_EXTERNAL
  resolution: DNS

#
kubectl apply -n istioinaction -f ch8/tracing/thin-httpbin-virtualservice.yaml

# 도메인 질의를 위한 임시 설정 : 실습 완료 후에는 삭제 해둘 것
echo "127.0.0.1       httpbin.istioinaction.io" | sudo tee -a /etc/hosts
cat /etc/hosts | tail -n 5
- 확인
- 호스트에서 호출 시, 어떻게 외부 서비스로 전달되는지 살펴보자. 원래 요청에서 사용된 헤더를 반환해야 한다.
- client (curl) → istio-ingress-gateway → httpbin.org (외부)
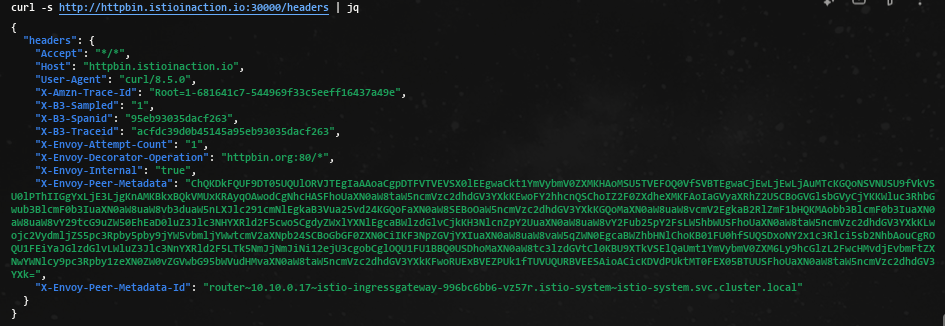
- Istio Ingress Gateway를 호출했을 때 간단한 HTTP 테스트 서비스인 외부 URL(httpbin.org)로 라우팅됐다.
- 이 서비스의 /headers 엔드포인트로 GET 요청을 하면 요청에 사용한 요청 헤더를 반환하여,
x-b3-*집킨 헤더가 요청에 자동으로 붙었음을 분명히 알 수 있다. - 이 집킨 헤더들은 스팬을 만드는 데 쓰이며 예거로 보내진다.
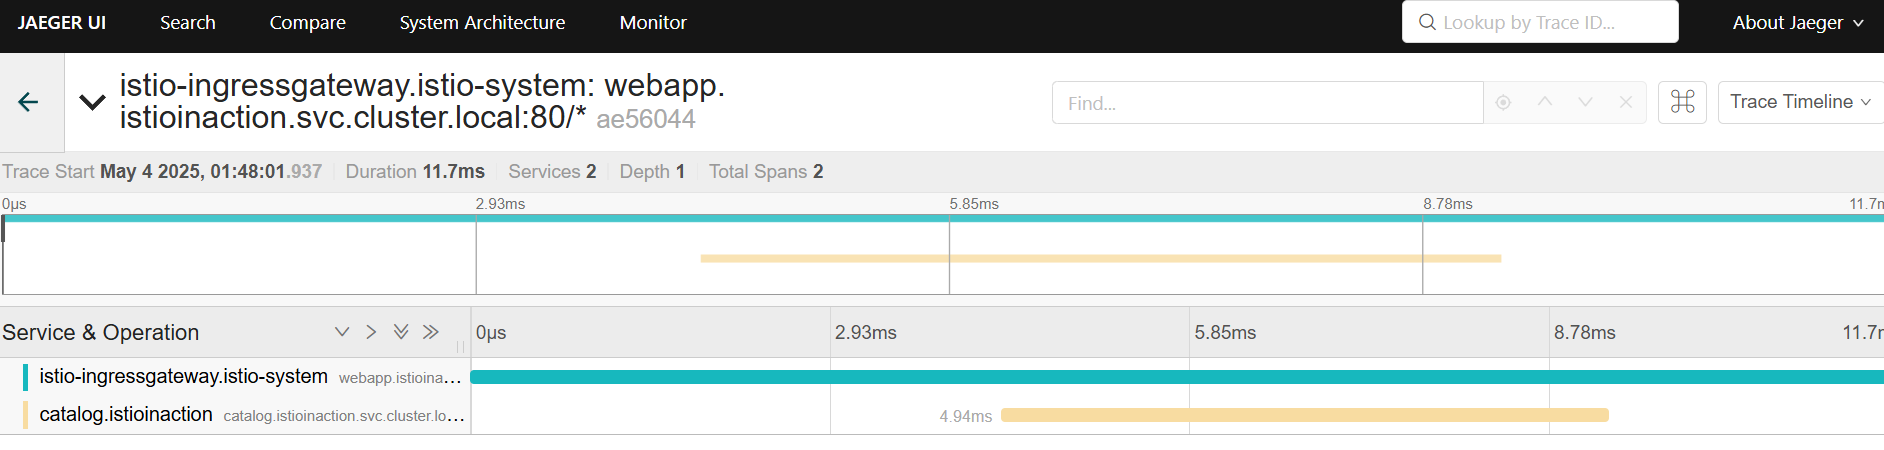
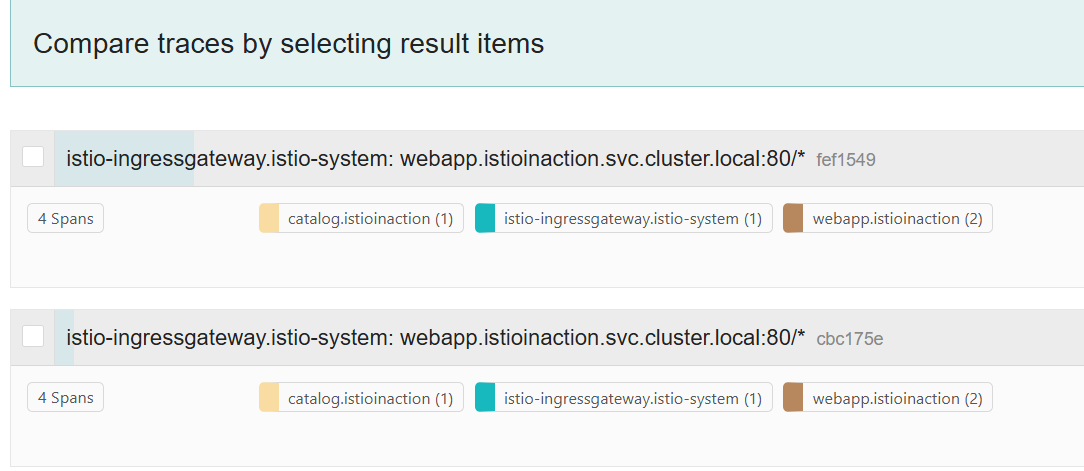
8.2.4 Viewing distributed tracing data
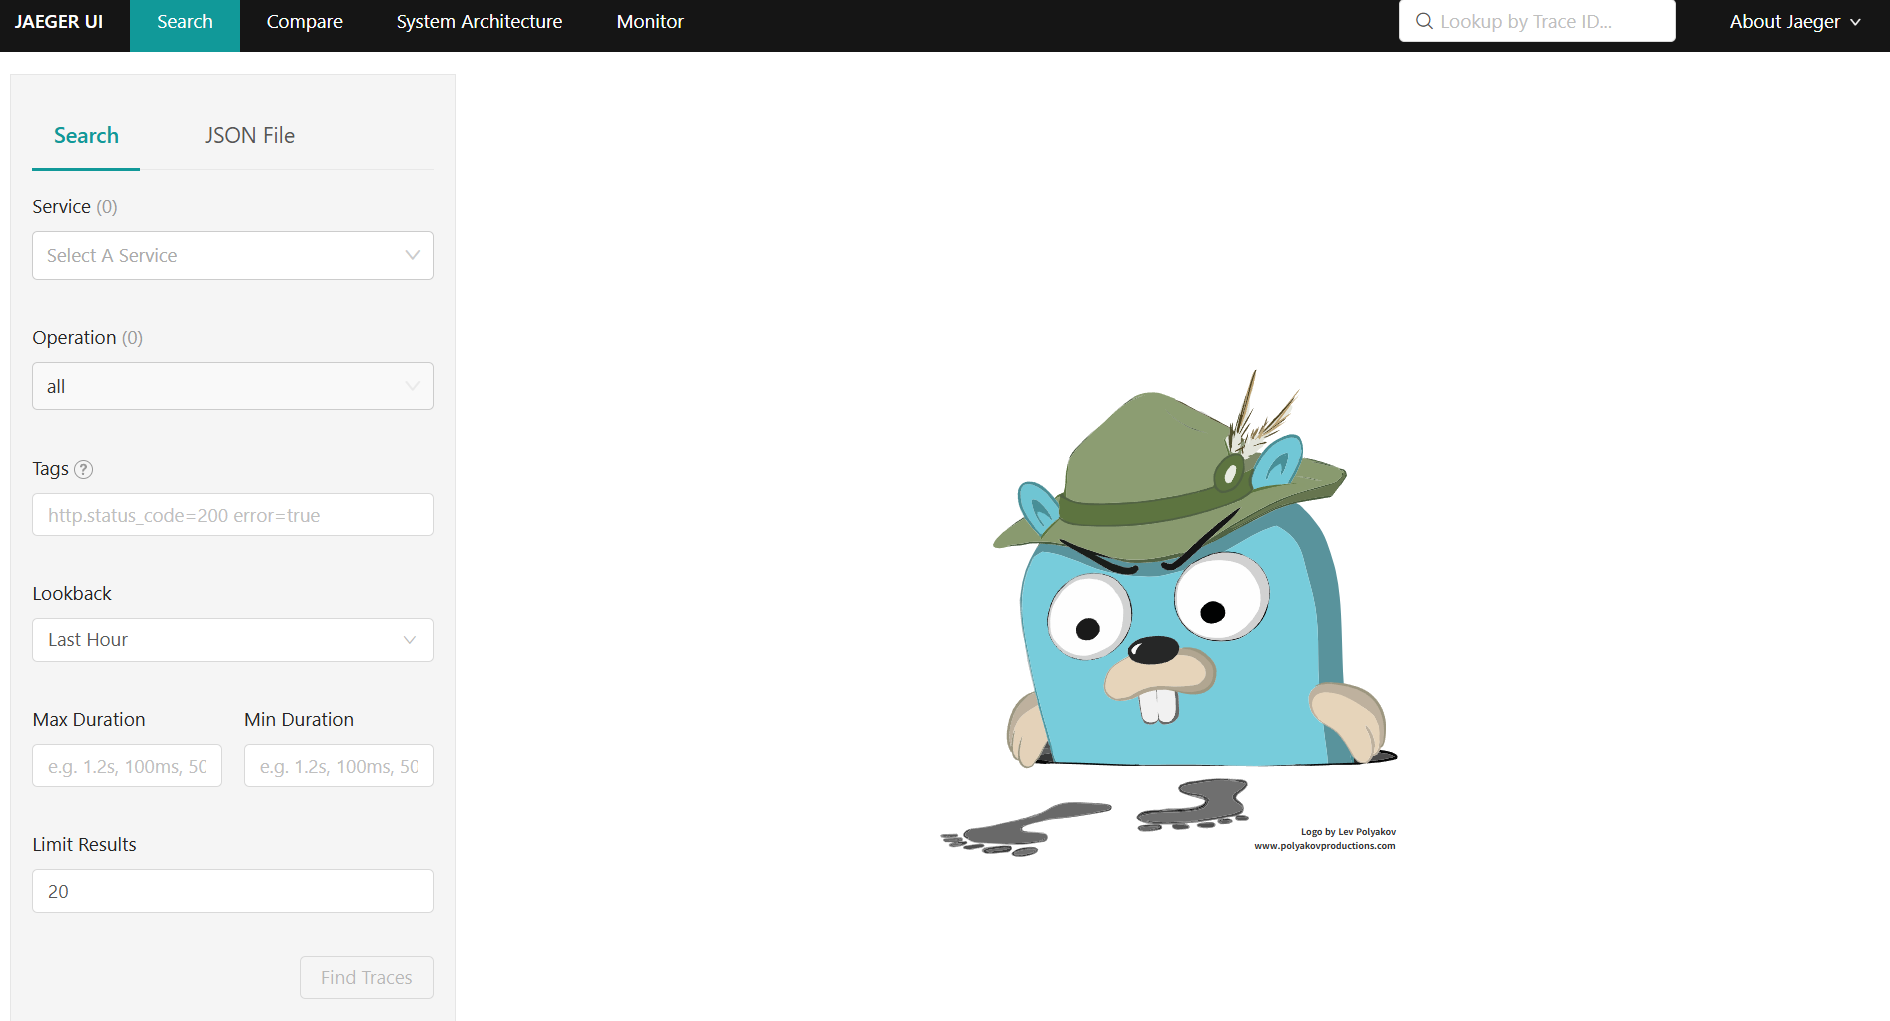
- 스팬이 예거(혹은 기타 오픈트레이싱 엔진)로 보내질 때, 트레이스 및 관련 스팬을 쿼리하고 볼 수 있는 방법이 필요하다.
- 기본 예거 UI를 사용하자.
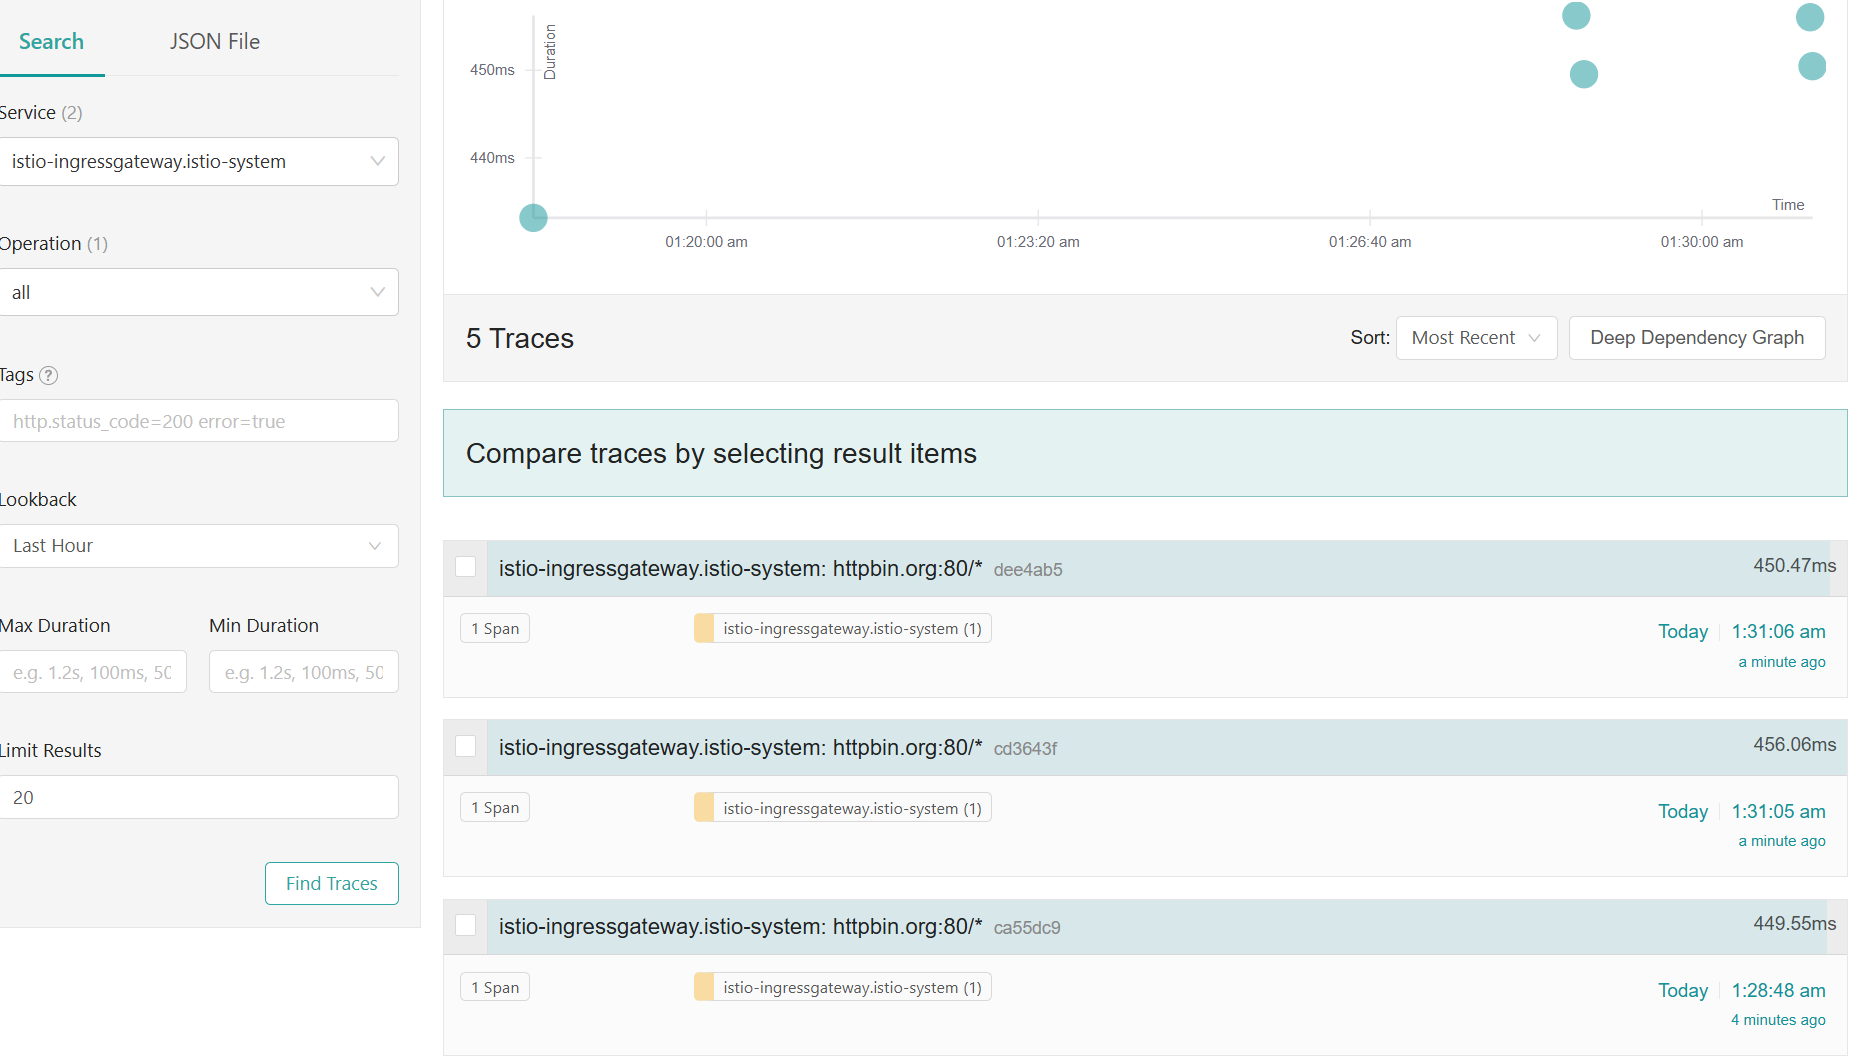
트레이스가 아무것도 보이지 않으면 curl 트래픽을 조금 보내두자.
curl -s http://httpbin.istioinaction.io:30000/headers | jq
curl -s http://httpbin.istioinaction.io:30000/headers | jq
...

curl -s http://webapp.istioinaction.io:30000/api/catalog | jq
curl -s http://webapp.istioinaction.io:30000/api/catalog | jq- 트레이스 콘텍스트 및 헤더 전파하기 Propagating trace context and headers : 올바른 동작을 위해 아래와 같은 헤더 전파 필요
-
x-request-id
-
x-b3-traceid
-
x-b3-spanid
-
x-b3-parentspanid
-
x-b3-sampled
-
x-b3-flags
-
x-ot-span-context
⇒ 즉, 애플리케이션 코드가 요청을 받아 처리를 시작할 때 이 헤더와 그 값을 저장했다가 애플리케이션이 수행해야 하는 모든 발신 요청에 삽입해야 한다는 것이다. 이 작업은 프록시에서 자동으로 수행할 수 없다.
-
8.2.5 Trace sampling, force traces, and custom tags
- 분산 트레이싱 및 스팬 수집은 시스템에 상당한 성능 저하를 초래할 수 있으므로, 서비스가 올바르게 실행 중일 때 분산 트레이싱 수집 빈도를 제한하도록 선택할 수 있다.
- 앞서 데모 프로필로 이스티오를 설치했는데, 이 프로필은 분산 트레이싱의 샘플링을 100%로 설정했다.
- 시스템에서 수집할 트레이스 비율을 설정함으로써 트레이스 샘플링을 제어할 수 있다.
메시의 트레이스 샘플링 비율 조정하기
- 백엔드 분산 트레이싱을 설치할 때, 런타임에 혹은 워크로드별로 설정했던 것처럼 샘플링 비율도 마찬가지로 설정할 수 있다.
- 트레이싱 설정이 다음과 같아지도록 istio-system 네임스페이스에 있는 istio configmap 의 MeshConfig 를 수정해보자.
KUBE_EDITOR="nano" kubectl edit -n istio-system cm istio
...
     sampling: 10  # <-- from 100
...

# 샘플링 적용은 istio-ingressgateway 재배포 필요 참고.
kubectl rollout restart deploy -n istio-system istio-ingressgateway- 서비스 메시 내 모든 워크로드에서 샘플링 비율이 전역적으로 10%로 바뀐다.
- 전역 설정 대신 애노테이션으로 워크로드별로도 설정할 수 있다.
- 여기서는 트레이싱 설정을 포함하도록 디플로이먼트 파드 템플릿의 애노테이션을 편집한다.
cat ch8/webapp-deployment-zipkin.yaml
...
  selector:
    matchLabels:
      app: webapp
  template:
    metadata:
      annotations:
        proxy.istio.io/config: |
          tracing:
            sampling: 10 # 퍼센트 직접 수정 후 적용 해보세요!
            zipkin:
              address: zipkin.istio-system:9411
...

# 적용 시 파드 재생성으로 위 애노테이션 적용으로 짐작.. 확인은 못해봄...
kubectl apply -f ch8/webapp-deployment-zipkin.yaml -n istioinaction


# 호출 테스트
curl -s http://webapp.istioinaction.io:30000/api/catalog | jq
curl -s http://webapp.istioinaction.io:30000/api/catalog | jq
curl -s http://webapp.istioinaction.io:30000/api/catalog | jq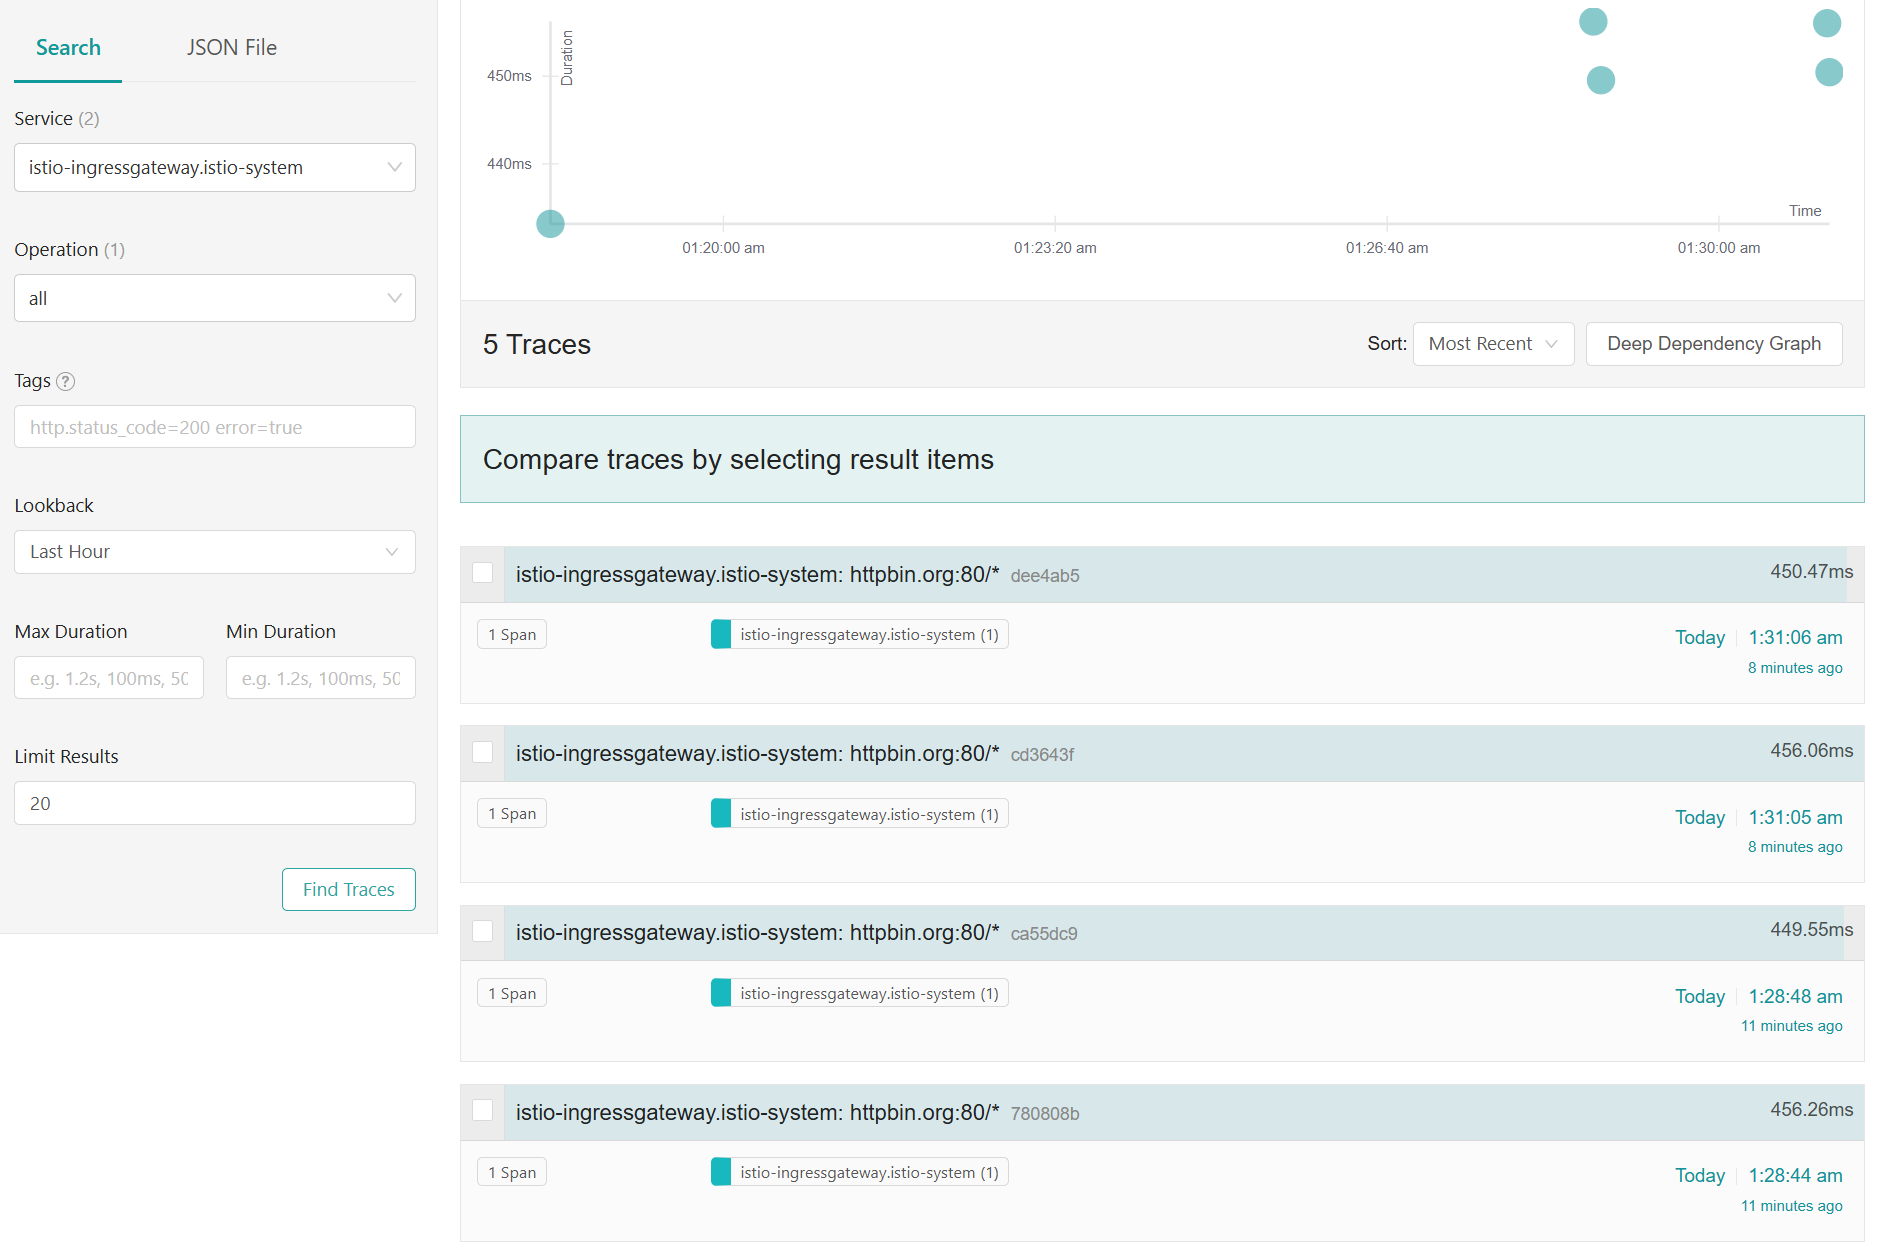
클라이언트에서 트레이싱 강제하기
-
운영 환경에서는 트레이스의 샘플링 비율을 최소한으로 설정한 후 문제가 있을 때만 특정 워크로드에 대해 활성화하는 것이 이치에 맞다.
-
가끔은 특정 요청(건)에 트레이싱을 활성화해야 하는 경우가 있다.
-
이스티오에서는 특정 요청에만 트레이싱을 강제하도록 설정할 수 있다.
-
예를 들어 애플리케이션에서 요청에
x-envoy-force-trace헤더를 추가해, 요청이 만드는 호출 그래프의 스팬과 트레이스를 이스티오가 포착하도록 만들 수 있다.
curl -s -H "x-envoy-force-trace: true" http://webapp.istioinaction.io:30000/api/catalog -v
curl -s -H "x-envoy-force-trace: true" http://webapp.istioinaction.io:30000/api/catalog -v
curl -s -H "x-envoy-force-trace: true" http://webapp.istioinaction.io:30000/api/catalog -v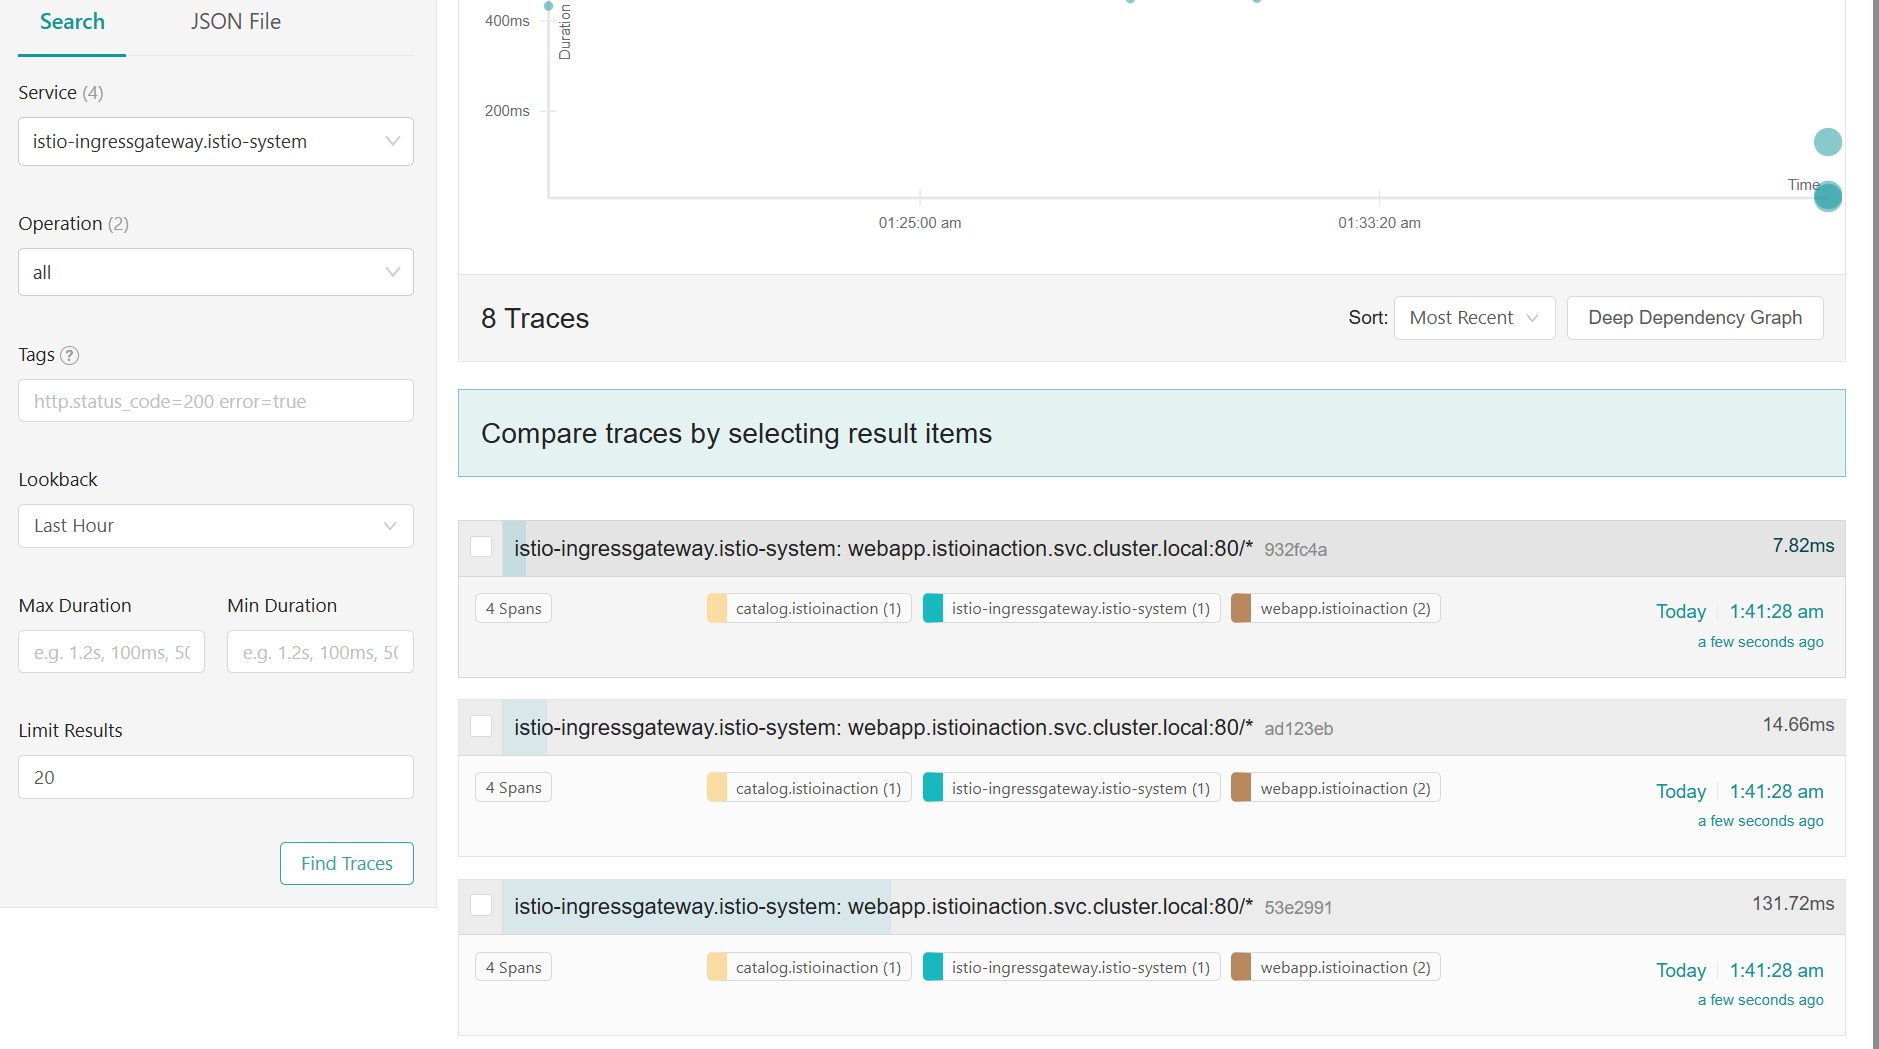
샘플링 비중과 상관 없이 해당 요청에 트레이스가 기록됨
x-envoy-force-trace헤더를 보낼 때마다 해당 요청과 그 요청의 호출 그래프 전체에 대해 트레이싱을 트리거한다.- 특정 요청에 대해 더 많은 정보를 얻고 싶을 때 이 헤더를 주입할 수 있는 API 게이트웨이와 진단 서비스 같은 도구를 이스티오 위에 구축할 수 있다.
트레이스의 태그 커스터마이징하기
- 스팬에 태그를 추가하는 것은 애플리케이션이 트레이스에 추가 메타데이터를 첨부(부여)하는 방법이다.
- 태그는 단순한 키-값 쌍을 말하는 것으로, 애플리케이션 혹은 조직별 커스텀 정보를 담고 있으며 백엔드 분산 트레이싱 엔진으로 보내는 스팬에 추가된다.
- 이 책을 저술하는 시점 기준으로는 세 가지 유형의 커스텀 태그를 설정할 수 있다.
- 명시적으로 값 지정하기 Explicitly specifying a value
- 환경 변수에서 값 가져오기 Pulling a value from environment variables
- 요청 헤더에서 값 가져오기 Pulling a value from request headers
webapp 서비스의 스팬에 커스텀 태그를 추가하려면, 해당 워크로드의 Deployment 리소스에 다음과 같이 애노테이션을 추가할 수 있다.
cat ch8/webapp-deployment-zipkin-tag.yaml
...
  template:
    metadata:
      annotations:
        proxy.istio.io/config: |
          tracing:
            sampling: 100
            customTags:
              custom_tag: # 커스텀 태그의 키
                literal:
                  value: "Test Tag" # 커스텀 태그의 값
            zipkin:
              address: zipkin.istio-system:9411
...

# webapp 에 커스텀 태그 적용
kubectl apply -n istioinaction -f ch8/webapp-deployment-zipkin-tag.yaml

# 호출
for in in {1..10}; do curl -s http://webapp.istioinaction.io:30000/api/catalog ; sleep 0.5; done
for in in {1..10}; do curl -s http://webapp.istioinaction.io:30000/api/catalog ; sleep 0.5; done
...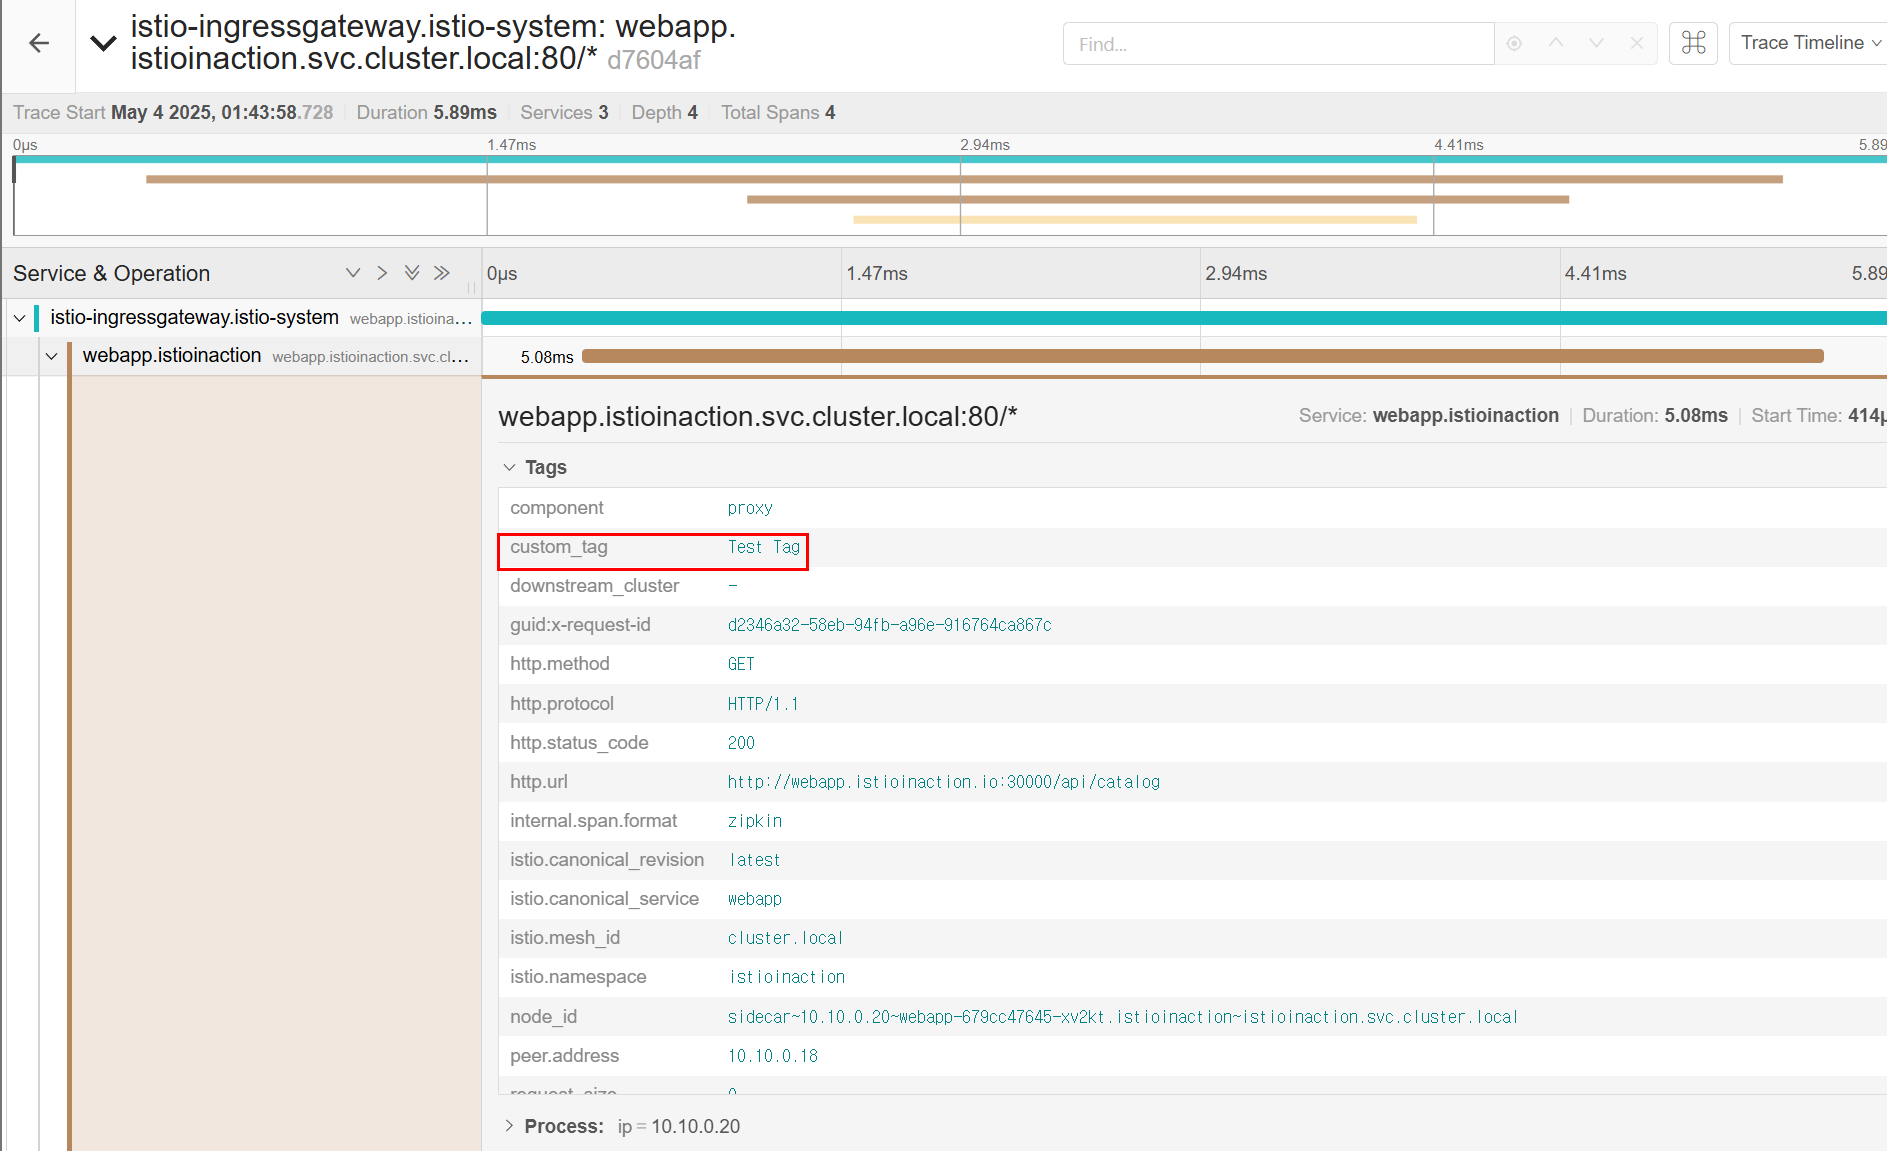
- 커스텀 태그는 보고 reporting, 필터링 filtering, 트레이싱 데이터 탐색에 사용할 수 있다.
- 스팬이나 트레이스에 포함되는 태그를 커스터마이징하는 방법은 이스티오 문서를 참조하자.
백엔드 분산 트레이싱 엔진 커스터마이징하기
- 분산 트레이싱에 대한 마지막 절인 여기서는 분산 트레이싱 엔진에 연결하는 백엔드 설정을 어떻게 수행하는지 알아보자.
- 앞서 언급했드시 이스티오는 1.12 버전에서 트레이싱을 포함하는 새로운 텔레메트리용 알파 API를 릴리스했으므로, 트레이싱 설정 면에서 사용자 경험이 개선될 것이라고 기대할 수 있다.
- 지금까지의 예제에서는 백엔드 트레이싱 엔진의 호스트네임과 포트로 Istio를 설정했다.
- 그런데 더 많은 설정을 조정해야 하는 경우에는 어떻게 할까?
- 예를 들어, 예거의 집긴 호환성을 사용하려면 예거 수집기의 특정 엔드포인트로 추적을 전송해야 한다.
- 기본적으로는 Istio Proxy에서 정적 설정으로 설정한다.
- 집킨 기반 트레이싱 엔진의 기본 트레이싱 설정을 살펴보자
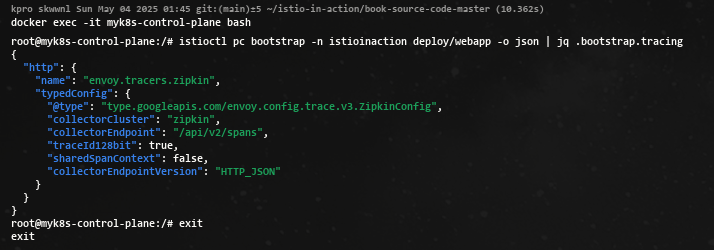
- 현재 기본 설정
- tracing enging 은 Zipkin-based
- Span 은 /api/v2/spans 로 전달
- JSON 엔드포인트로 처리
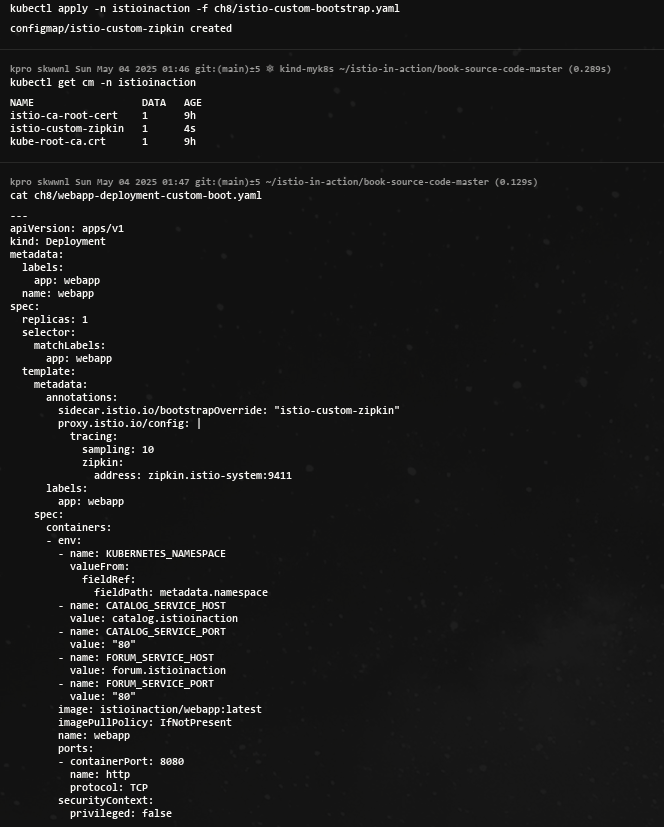
- 기본 설정은 커스텀 부트스트랩 설정으로 변경 할 수 있다.
- 이를 위해 configmap 에서 튜닝하고자 하는 설정 스니펫을 지정한다.
cat ch8/istio-custom-bootstrap.yaml
apiVersion: v1
kind: ConfigMap
metadata:
  name: istio-custom-zipkin
data:
  custom_bootstrap.json: |
    {
      "tracing": {
        "http": {
          "name": "envoy.tracers.zipkin",
          "typedConfig": {
            "@type": "type.googleapis.com/envoy.config.trace.v3.ZipkinConfig",
            "collectorCluster": "zipkin",
            "collectorEndpoint": "/zipkin/api/v1/spans",
            "traceId128bit": "true",
            "collectorEndpointVersion": "HTTP_JSON"
          }
        }
      }
    }
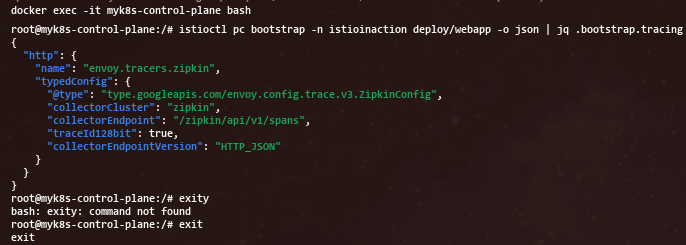
- JAEGER 대시보드 확인 : webapp 추적 시 collectorEndpoint 에 잘못된 경로 설정으로 webapp Span이 출력되지 않습니다
- 다음 실습을 위해 다시 설정 원복
# istio-custom-zipkin 어노테이션이 없는 webapp으로 재배포
kubectl apply -n istioinaction -f services/webapp/kubernetes/webapp.yaml

# 호출
for in in {1..10}; do curl -s http://webapp.istioinaction.io:30000/api/catalog ; sleep 0.5; done
for in in {1..10}; do curl -s http://webapp.istioinaction.io:30000/api/catalog ; sleep 0.5; done
...- JAEGER 대시보드 확인
8.3 Visualization with Kial
- 키알리는 프로메테우스와 기반 플랫폼에서 많은 양의 메트릭을 가져와 메시 내 구성 요소의 런타임 그래프를 구성하는데, 이 그래프가 서비스 간의 통신 상황을 시각적으로 이해하는 데 도움이 된다.
- 또한 그래프와 상화작용해 문제가 될 수 있는 영역을 파고들어 무슨 일이 일어나고 있는지 자세히 알아볼 수도 있다.
- 키알리는 그라파나와 다른데, 키알리는 실시간으로 갱신되는 메트릭을 사용해 서비스가 서로 어떻게 통신하는지에 대한 방향 그래프 directed graph 를 구축하는데 집중하기 때문이다.
- 그라파나는 게이지, 카운터, 차트 등이 포함된 대시보드에는 훌륭하지만, 클러스터 내 서비스에 대한 상호작용형 그림이나 지도를 보여주지는 않는다.
8.3.1 Installing Kiali
- 프로메테우스나 그라파나와 마찬가지로 이스티오는 키알리 샘플 버전을 기본적으로 제공한다.
- 그러나 이스티오 팀과 키알리 팀은 실제로 배포할 때는 키알리 오퍼레이터를 사용하길 권장한다. https://github.com/kiali/kiali-operator
- 이번 절에서도 이 방식을 사용할 것이다. 키알리 설치에 대한 자세한 내용은 공식 설치 가이드를 참조하자.
- 키알리 오퍼레이터 설치부터 시작
# helm repo
helm repo add kiali https://kiali.org/helm-charts
helm repo update

# kiali-operator install : 책은 1.40.1
helm install --namespace kiali-operator --create-namespace --version 1.63.2 kiali-operator kiali/kiali-operator

# kiali-operator 확인
kubectl get pod -n kiali-operator
NAME                             READY   STATUS    RESTARTS   AGE
kiali-operator-584858fb7-zcjv2   1/1     Running   0          61s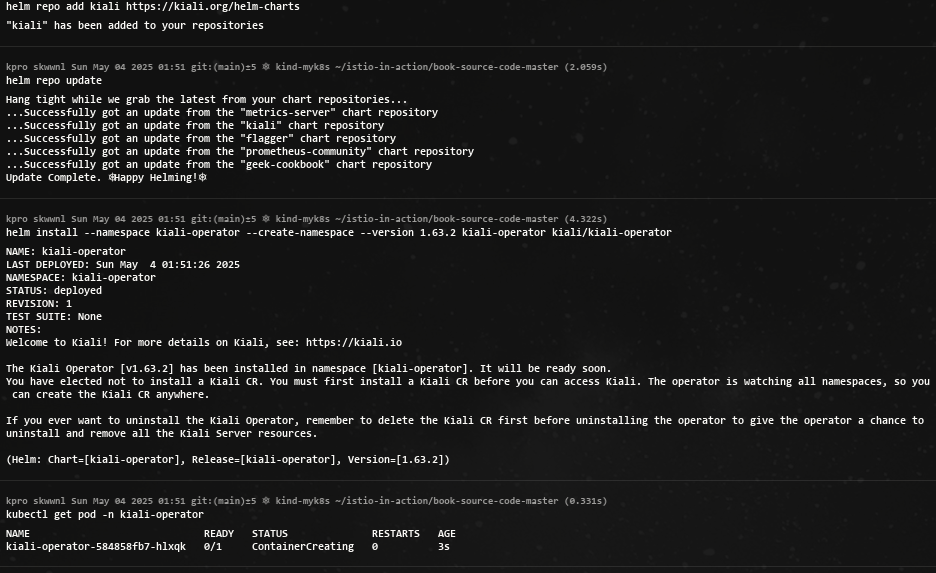
- istio-system 네임스페이스에 키알리 인스턴스 배포 : 웹 대시보드를 갖춘 실제 애플리케이션
# 앞 절에서 배포했던 프로메테우스와 예거에 연결할 수 있게 설정
cat ch8/kiali.yaml
apiVersion: kiali.io/v1alpha1
kind: Kiali
metadata:
namespace: istio-system
name: kiali
spec:
istio_namespace: "istio-system"
istio_component_namespaces:
prometheus: prometheus
auth:
strategy: anonymous # 익명 접근 허용
deployment:
accessible_namespaces:
- '**'
external_services:
prometheus: # 클러스터 내에서 실행 중인 프로메테우스 설정
cache_duration: 10
cache_enabled: true
cache_expiration: 300
url: "http://prom-kube-prometheus-stack-prometheus.prometheus:9090"
tracing: # 클러스터 내에서 실행 중인 예거 설정
enabled: true
in_cluster_url: "http://tracing.istio-system:16685/jaeger"
use_grpc: true
# 키알리 인스턴스(대시보드) 설치
kubectl apply -f ch8/kiali.yaml
# 확인
kubectl get deploy,svc -n istio-system kiali
NAME READY UP-TO-DATE AVAILABLE AGE
deployment.apps/kiali 1/1 1 1 36s
NAME TYPE CLUSTER-IP EXTERNAL-IP PORT(S) AGE
service/kiali ClusterIP 10.200.1.179 <none> 20001/TCP,9090/TCP 35s
# NodePort 변경 및 nodeport kiali(30003)
kubectl patch svc -n istio-system kiali -p '{"spec": {"type": "NodePort", "ports": [{"port": 20001, "targetPort": 20001, "nodePort": 30003}]}}'
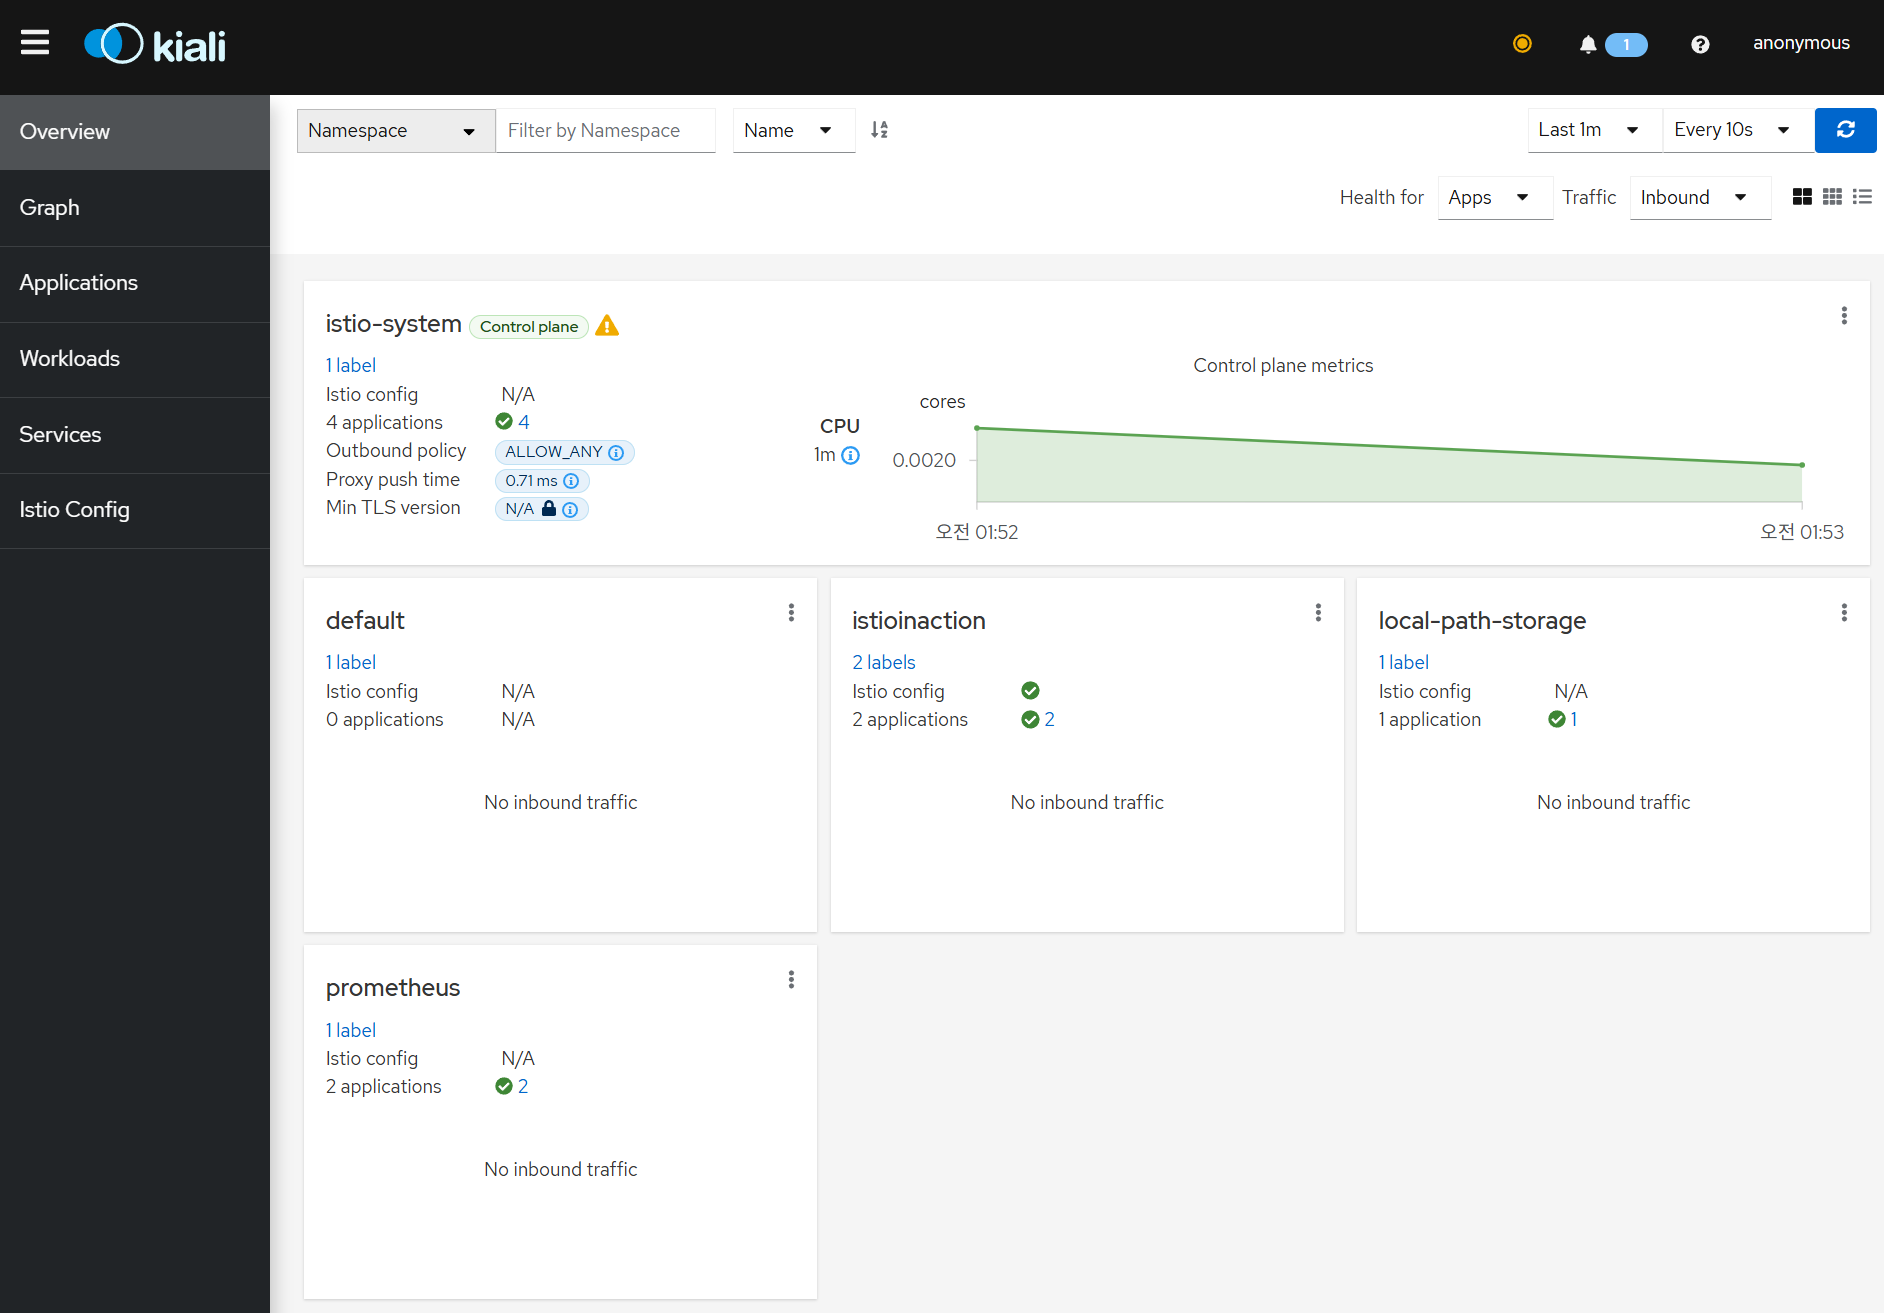
# Kiali 접속 1 : NodePort
open http://127.0.0.1:30003- 접속 확인
키알리에서는 프로메테우스에 연결할 때 TLS와 기본적인 인증을 사용할 수 있다.
- 트래픽 확인을 위해서 반복 호출
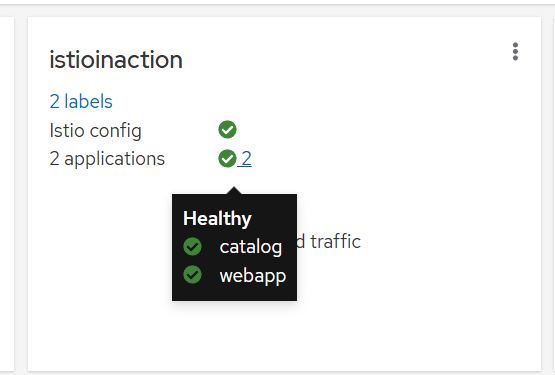
while true; do curl -s http://webapp.istioinaction.io:30000/api/catalog ; date "+%Y-%m-%d %H:%M:%S" ; sleep 1; echo; doneOverview dashboard : 네임스페이스와 각 네임스페이스에서 실행 중인 애플리케이션의 개수 표기 ⇒ istioinaction 네임스페이스 선택
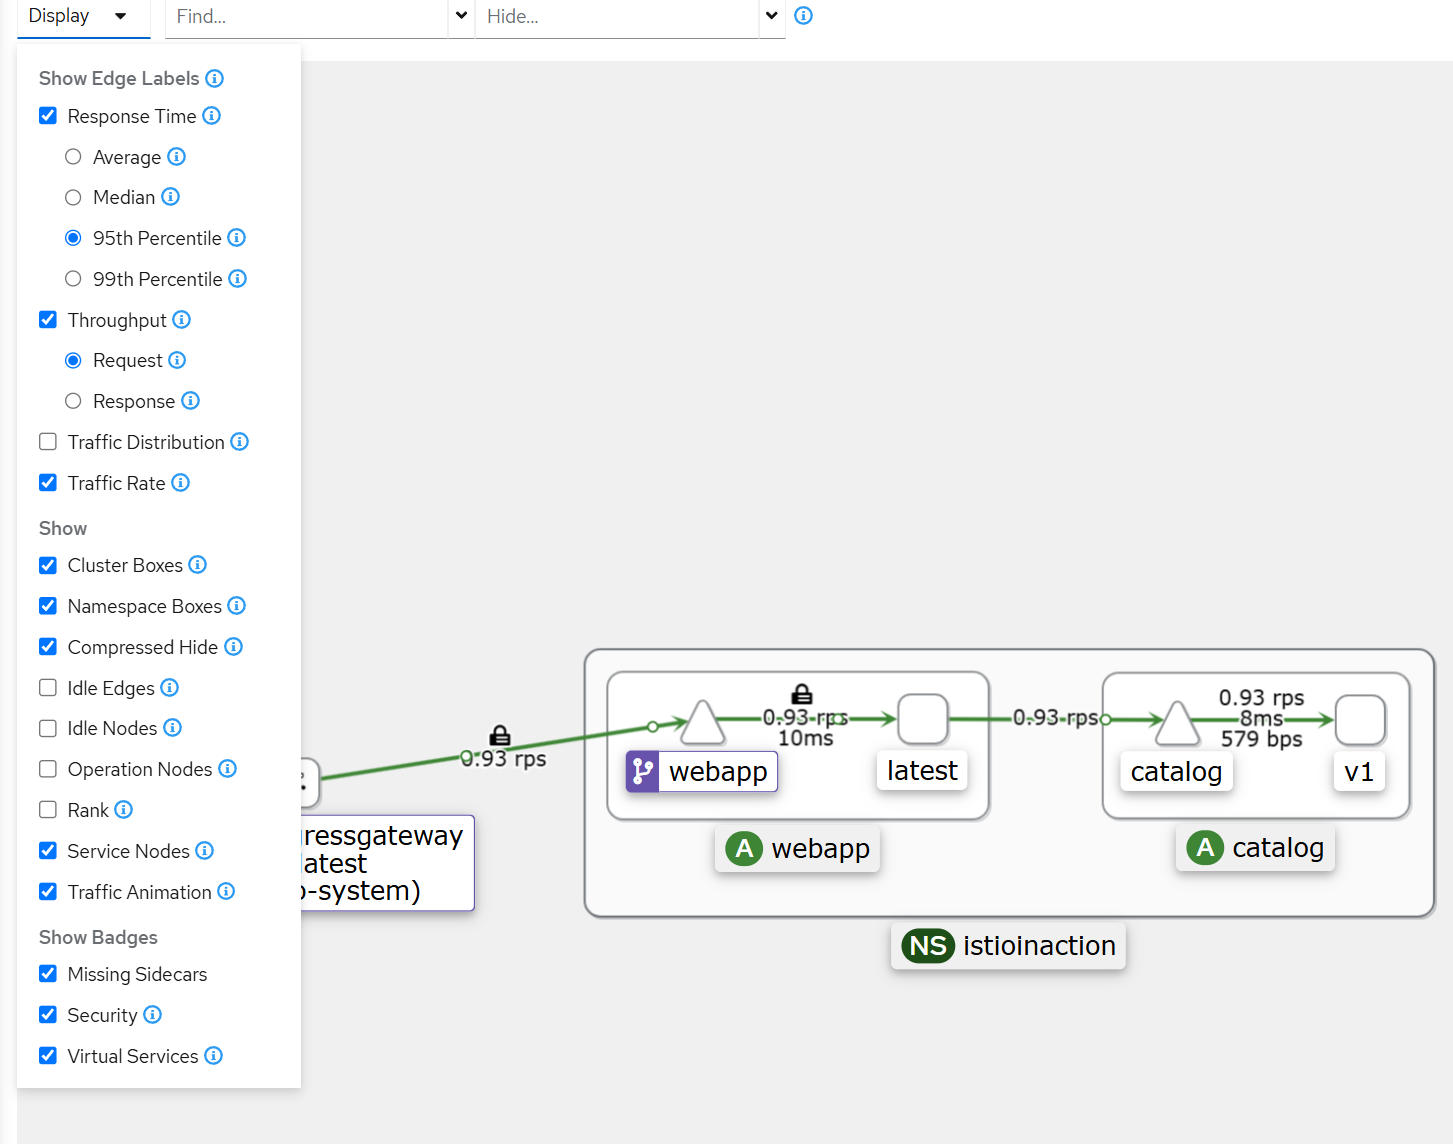
- Graph : 서비스 매시의 트래픽 흐름을 보여주는 방향 그래프 ⇒ Display 체크
- 트래픽의 이동과 흐름 Traversal and flow of traffic
- 바이트 수, 요청 개수 등 Number of bytes, requests, and so on
- 여러 버전에 대한 여러 트래픽 흐름(예: 카나리 릴리스나 가중치 라우팅)
- 초당 요청 수 Requests/second; 총량 대비 여러 버전의 트래픽 비율
- 네트워크 트래픽에 기반한 애플리케이션 상태 health
- HTTP/TCP 트래픽
- 빠르게 식별할 수 있는 네트워크 실패
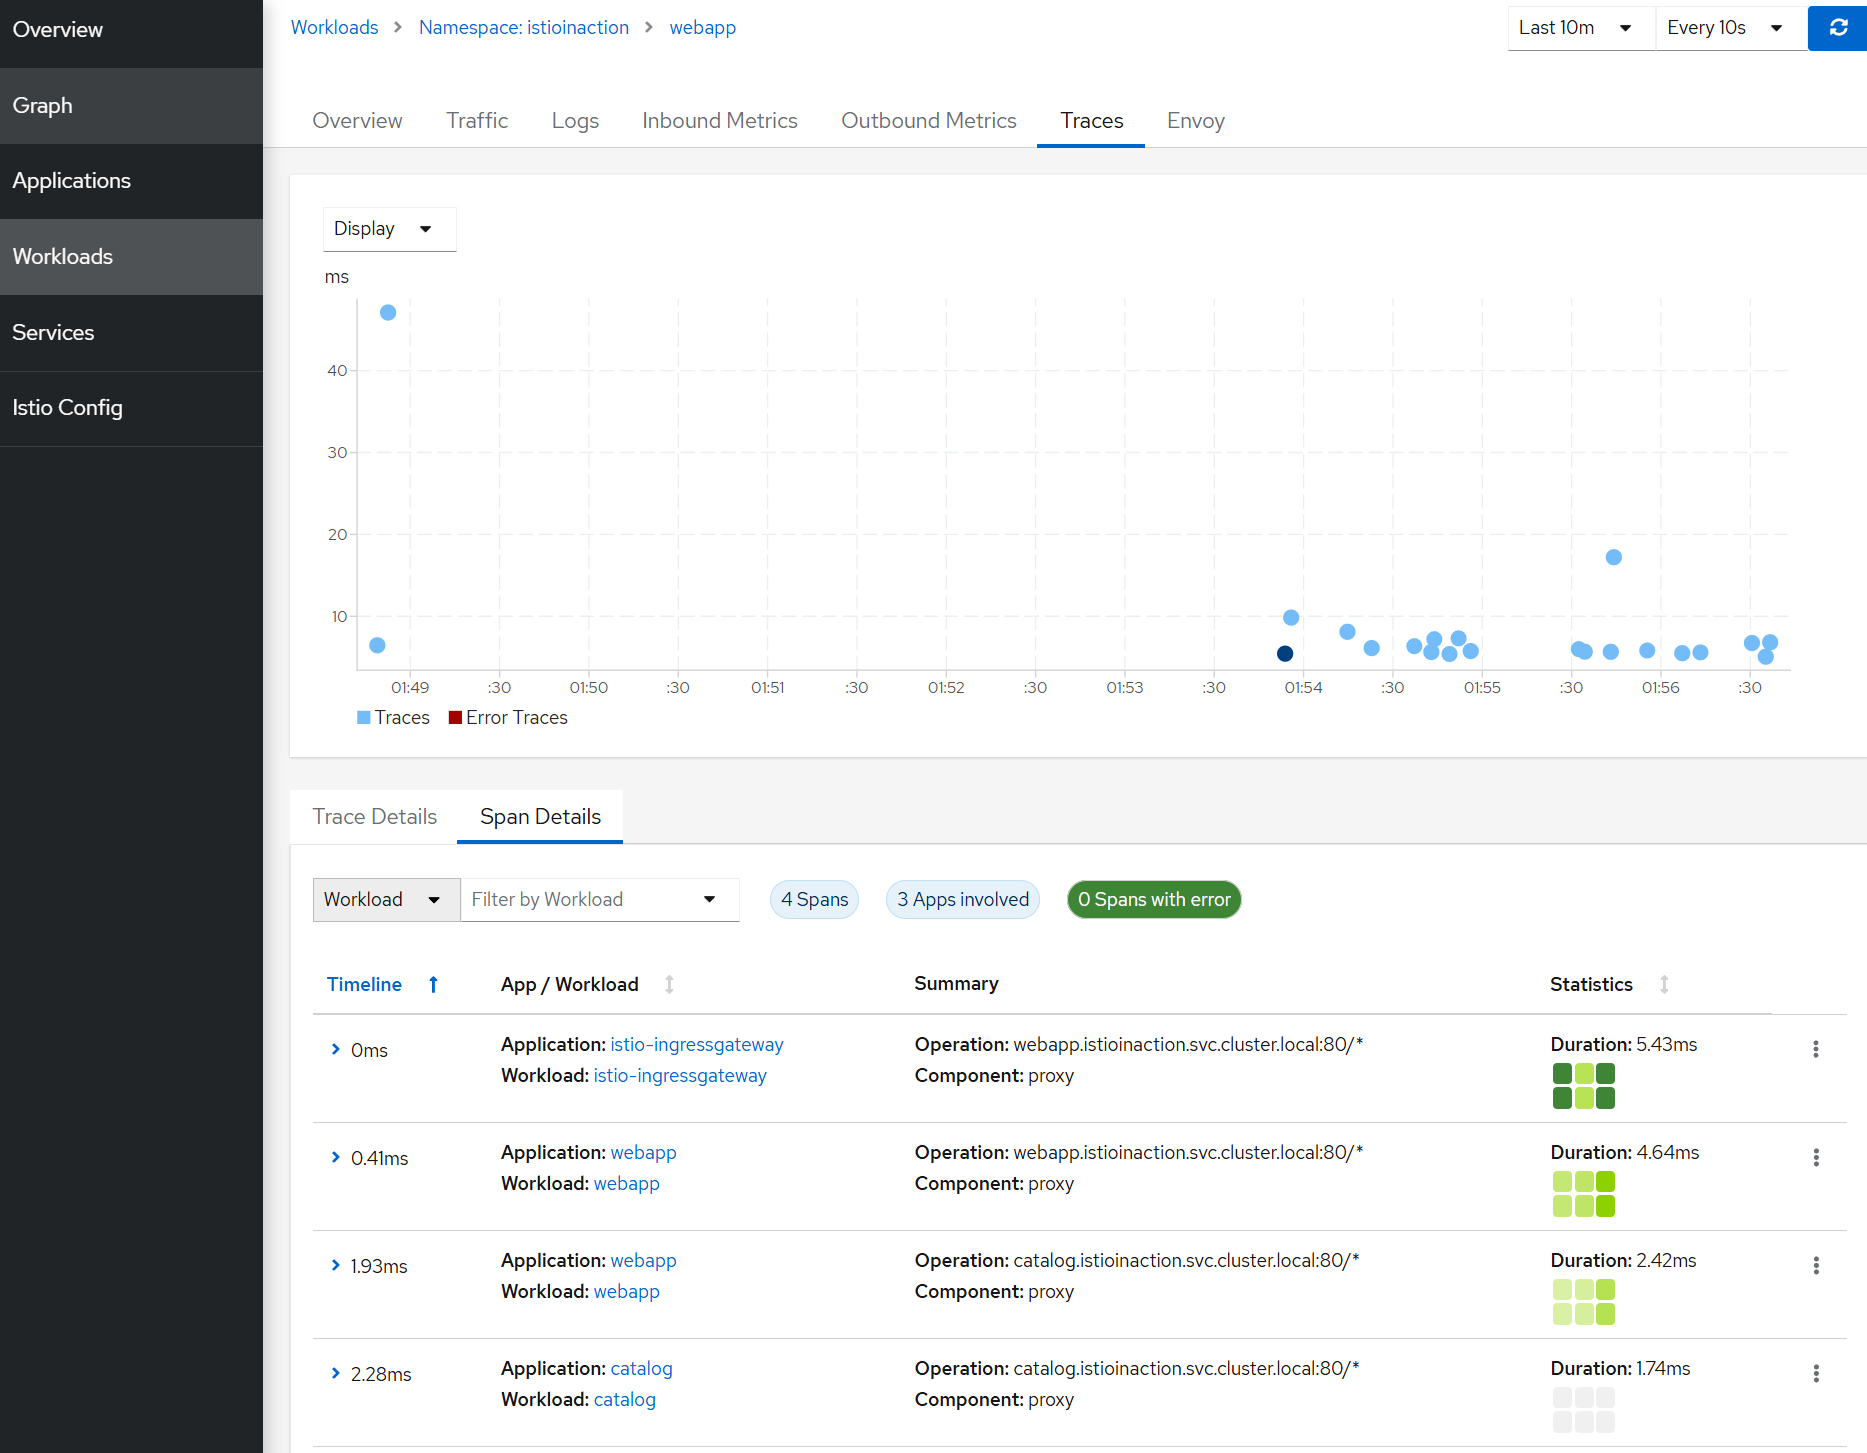
- Workloads → Traces 선택
트레이스, 메트릭, 로그의 연관성 CORRELATION OF TRACES, METRICS, AND LOGS
Workloads 메뉴
- Overview : Pods of the service, Istio configuration applied to it, and a graph of the upstreams and downstreams
- Traffic : Success rate of inbound and outbound traffic
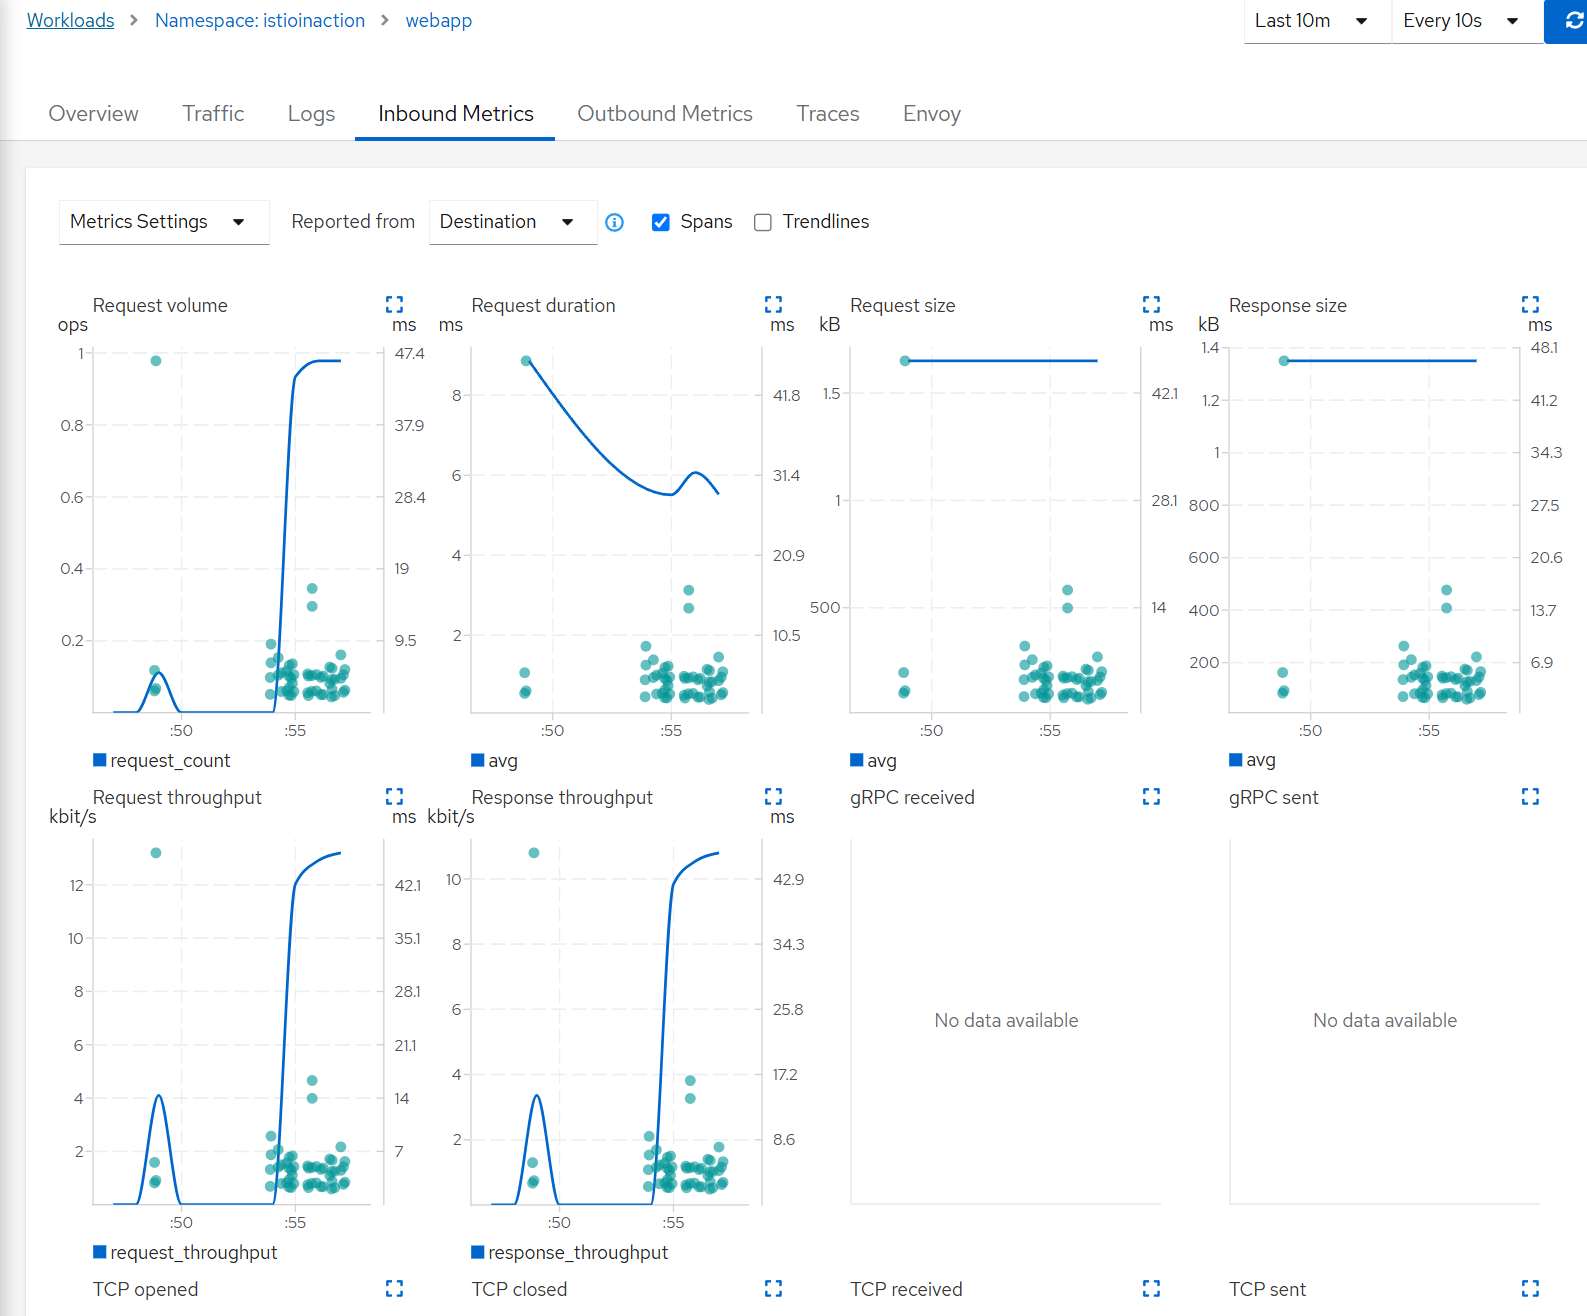
- Logs : Application logs, Envoy access logs, and spans correlated together Inbound Metrics and Outbound Metrics Correlated with spans
- Traces : The traces reported by Jaeger
- Envoy : The Envoy configuration applied to the workload, such as clusters, listeners, and routes
Kiali workload vs. application 차이
- 워크로드
- A workload is a running binary that can be deployed as a set of identical running replicas. For example, in Kubernetes, this would be the Pods part of a deployment. A service A deployment with three replicas would be a workload.
- 애플리케이션
- An application is a grouping of workloads and associated constructs like services and configuration. In Kubernetes, this would be a service A along with a service B and maybe a database. Each would be its own workload, and together they would make up a Kiali application.
Kiali is useful for service mesh operators 키알리가 운영에 도움을 주는 것
- VirtualService pointing to non-existent Gateway
- Routing to destinations that do not exist
- More than one VirtualService for the same host
- Service subsets not found
Summary
- 그라파나는 Istio 제어 평면과 데이터 평면을 위한 기본 대시보드를 포함한 Istio 메트릭을 시각화하는 데 사용할 수 있습니다.
- Grafana can be used to visualize Istio metrics, including using out-of-the-box dashboards for the Istio control plane and data plane.
- 분산 추적은 요청을 처리하는 데 관련된 구성 요소에 대한 인사이트를 제공합니다. 이를 위해 서비스 프록시에서 추적 헤더로 요청에 주석을 달 수 있습니다.
- Distributed tracing gives us insights into the components involved in serving a request. To do so, it annotates requests with trace headers at the service proxy.
- 애플리케이션은 요청을 전체적으로 보기 위해 트레이스 헤더를 전파해야 합니다.
- Applications need to propagate trace headers in order to get a full view of a request.
- 트레이스는 분산 시스템에서 지연 시간을 디버깅하고 홉을 요청하는 데 사용할 수 있는 스팬 모음입니다.
- A trace is a collection of spans that can be used to debug latency and request hops in a distributed system.
- Istio는 Istio 설치 중에 defaultConfig을 사용하여 추적 헤더를 라우팅하도록 구성할 수 있으며, 이는 전체 메쉬에 적용됩니다. 또는 주석 proxy.istio.io/config 을 사용하여 workload 단위로 동일한 구성을 적용할 수 있습니다.
- Istio can be configured to route tracing headers using defaultConfig during Istio installation, which applies to the entire mesh; or the same configuration can be applied on a per-workload basis using the annotation proxy.istio.io/config.
- 키알리 연산자는 프로메테우스의 메트릭과 예거의 트레이스를 읽도록 구성할 수 있습니다.
- The Kiali Operator can be configured to read metrics from Prometheus and traces from Jaeger.
- Kiali는 디버깅을 돕기 위한 네트워킹 그래프와 메트릭 상관관계를 포함하여 Istio 관련 디버깅 대시보드를 꽤 많이 보유하고 있습니다.
- Kiali has quite a few Istio-specific debugging dashboards, including a networking graph and metric correlation to aid debugging.
