CloudNet@에서 진행하는 Istio Study 4주차 7장 내용입니다.
📕 This chapter cover
- Collecting basic request-level metrics
- Understanding Istio’s standard service-to-service metrics
- Using Prometheus to scrape workload and control-plane metrics
- Adding new metrics in Istio to track in Prometheus
7.1 What is Observability?
- 관찰 가능성(Observability)는 시스템의 특성 중 하나로, 외부 신호와 특성만 보고도 시스템의 내부 상태를 이하해고 추론할 수 있는 수준이다.
- 또한 관찰 가능성은 애플리케이션 계측, 네트워크 계측, 시그널 수집 인프라, 데이터베이스뿐 아니라 예기치 못한 일이 일어났을 때 방대한 데이터를 잘 추리고 결합해 전체 그림을 그려내는 방법도 포함해야 한다. (다양한 레벨 계측 필요함)
7.1.1 Observability (휠씬 더 많은 데이터 수집) vs. Monitoring
- Monitoring은 관찰 가능성의 부분잡합으로 특히 메트릭을 수집하고 집계한다.
- Observability는 시스템을 예측하기 매우 어려운 것으로 보기에 일어날 수 있는 모든 고장을 사전에 알 수는 없다고 가정한다.
7.1.2 How Istio helps with observability
- Istio는 관찰 가능한 시스템을 구축하는 데 도움을 줄 수 있는 독특한 위치에 있다.
- Isito의 데이터 플레인 프록시, 엔보이가 서비스 간 네트워크 요청 경로에 자리하고 있기 때문이다.
- Envoy Service Proxy로 주용 메트릭 정보 같은 요청 수, 처리에 걸리는 시간, 실패한 요청 수 등을 포착할 수 있기 때문입니다.
7.2 Exploring Istio metrics
- 데이터 플레인은 요청을 처리
- 컨트롤 플레인은 데이터 플레인이 요청을 처리하도록 설정
7.2.1 Metrics in the data plane - Envoy 표준/상세 메트릭 설정 및 확인
- Envoy는 커넥션, 요청, 런타임 메트릭을 다양하게 갖추고 있으며, 이들을 사용해 서비스의 네트워크 및 통신 상태를 파악할 수 있다.
- 예제에서 애플리케이션의 부분 집합을 배포하고, 구성 요소를 탐색하여 메트릭이 어디서 오는 지, 메트릭에 어떻게 접근할 수 있는 지를 이해합니다.
서비스의 사이드카 프록시가 유지하는 메트릭 확인
kubectl exec -it deploy/catalog -c istio-proxy -n istioinaction -- curl localhost:15000/stats
kubectl exec -it deploy/webapp  -c istio-proxy -n istioinaction -- curl localhost:15000/stats
...
destination_version=.=unknown;.;destination_service=.
=webapp.istioinaction.svc.cluster.local;.;destination_service_name=.
=webapp;.;destination_service_namespace=.=istioinaction;.;
destination_canonical_service=.=webapp;
.;destination_canonical_revision=.
=latest;.;request_protocol=.=http;.;response_flags=.=-;.
;connection_security_policy=.=mutual_tls;.;response_code=.=200;.
;grpc_response_status=.=;.;destination_cluster=.=Kubernetes;.
;source_cluster=.=Kubernetes;.;istio_requests_total: 2- 여기서 가장 중요한 부분은 마지막 istio_request_total 이다.
- 나머지 부분을 읽으면, 이것이 인그레스 게이트웨이에서 webapp 서비스로 들어오는 요청에 대한 메트릭이며 그 요청이 총 2개임을 알 수 있다.
- 다음 히스토그램은 각 프록시가 인바운드 및 아웃바운드 호출에 유지하는 표준 이스티오 메트릭이다. - Docs
-
istio_requests_total : This is a
COUNTERincremented for every request handled by an Istio proxy. -
istio_request_bytes : This is a
DISTRIBUTIONwhich measures HTTP request body sizes -
istio_response_bytes : This is a
DISTRIBUTIONwhich measures HTTP response body sizes. -
istio_request_duration_milliseconds : This is a
DISTRIBUTIONwhich measures the duration of requests.→ A
COUNTERis a strictly increasing integer , ADISTRIBUTIONmaps ranges of values to frequency. - Docs⇒ The telemetry component is implemented as a Proxy-wasm plugin.
-
이들 덕분에 메트릭 수집에 대해 따로 무엇을 하지 않아도 정보가 풍부하다.
프록시가 엔보이 통계를 더 많이 보고하도록 설정하기
가끔 네트워크 동작을 트러블슈팅하려면 표준 이스티오 메트릭보다 더 많은 정보를 확인해야 할 때가 있다.
애플리케이션 호출이 자신의 클라이언트 측 프록시를 거쳐갈 때, 프록시는 라우팅 결정을 내리고 업스트릠 클러스터로 라우팅한다.
- 업스트림 클러스터란 관련 설정(로드 밸런싱, 보안, 서킷 브레이커 설정 등)을 적용해 실제 호출되는 서비스를 말한다.
- 예제에서 webapp 서비스가 catalog 서비스로 라우팅된다.
- 업스트림 catalog 서비스 호출에 추가 정보를 활성해화보자.
방법 1 : 메시 전체에 적용하기
apiVersion: install.istio.io/v1alpha1
kind: IstioOperator
metadata:
  name: control-plane
spec:
  profile: demo
  meshConfig:
    defaultConfig: # Defines the default proxy configuration for all services
      proxyStatsMatcher: # Customizes the reported metrics
        inclusionPrefixes: # Metrics matching the prefix will be reported alongside the default ones.
        - "cluster.outbound|80||catalog.istioinaction"
메시 전체에 수집하는 메트릭을 늘리면 메트릭 수집 시스템을 과부하 상태로 만들 수 있으므로 아주 신중하게 적용해야 한다.
방법 2 : 워크로드 단위로 설정(애노테이션으로 포함할 메트릭 지정) ← 권장 방법
# cat ch7/webapp-deployment-stats-inclusion.yaml
...
  template:
    metadata:
      annotations:
        proxy.istio.io/config: |-
          proxyStatsMatcher:
            inclusionPrefixes:
            - "cluster.outbound|80||catalog.istioinaction"
      labels:
        app: webapp
# 적용
cat ch7/webapp-deployment-stats-inclusion.yaml
kubectl apply -n istioinaction -f ch7/webapp-deployment-stats-inclusion.yaml
# 호출테스트
curl -s http://webapp.istioinaction.io:30000/api/catalog | jq
curl -s http://webapp.istioinaction.io:30000/api/catalog | jq
# 적용 후 확인 : catalog.istioinaction 에 대한 metrics 추가
# upstream 클러스터로 향햐는 커넥션 혹은 요청 시 circuit breaking 작동 확인
kubectl exec -it deploy/webapp -c istio-proxy -n istioinaction -- curl localhost:15000/stats | grep catalog

- Envoy는 트래픽을 식별할 때 내부와 외부를 구분하며, 내부는 보통 메시 내부 트래픽이라 인식하는 것을 말하고, 외부는 메시 외부에서 시작한 트래픽(인그레스 게이트웨이로 들어온 트래픽)을 말한다.
# cluster_name.internal.*. 메트릭을 보면 메시 내부에서 시작해 성공한 요청 개수를 확인 할 수 있다.
kubectl exec -it deploy/webapp -c istio-proxy -n istioinaction -- curl localhost:15000/stats | grep catalog | grep internal
...
cluster.outbound|80||catalog.istioinaction.svc.cluster.local.internal.upstream_rq_200: 2
cluster.outbound|80||catalog.istioinaction.svc.cluster.local.internal.upstream_rq_2xx: 2
cluster.outbound|80||catalog.istioinaction.svc.cluster.local.internal.upstream_rq_completed: 2- cluster_name.ssl.* 메트릭은 트래픽이 TLS로 업스트림 클러스터로 이동하는지 여부와 커넥션과 관련된 기타 세부 정보(cipher, curve 등)을 알아내는 데 매우 유용
# cluster_name.internal.*. 메트릭을 보면 메시 내부에서 시작해 성공한 요청 개수를 확인 할 수 있다.
kubectl exec -it deploy/webapp -c istio-proxy -n istioinaction -- curl localhost:15000/stats | grep catalog | grep ssl
...
cluster.outbound|80||catalog.istioinaction.svc.cluster.local.ssl.ciphers.TLS_AES_128_GCM_SHA256: 2
cluster.outbound|80||catalog.istioinaction.svc.cluster.local.ssl.connection_error: 0
cluster.outbound|80||catalog.istioinaction.svc.cluster.local.ssl.curves.X25519: 2
cluster.outbound|80||catalog.istioinaction.svc.cluster.local.ssl.fail_verify_cert_hash: 0
cluster.outbound|80||catalog.istioinaction.svc.cluster.local.ssl.fail_verify_error: 0
cluster.outbound|80||catalog.istioinaction.svc.cluster.local.ssl.fail_verify_no_cert: 0
cluster.outbound|80||catalog.istioinaction.svc.cluster.local.ssl.fail_verify_san: 0
cluster.outbound|80||catalog.istioinaction.svc.cluster.local.ssl.handshake: 2
cluster.outbound|80||catalog.istioinaction.svc.cluster.local.ssl.versions.TLSv1.3: 2
...- upstream_cx와 upstream_rq는 네트워크에서 일어나는 일에 대한 좀 더 정확한 정보를 제공한다.
# 업스트림 커넥션 및 요청에 대한 메트릭
kubectl exec -it deploy/webapp -c istio-proxy -n istioinaction -- curl localhost:15000/stats | grep catalog | egrep 'local.upstream_cx|local.upstream_rq'
...
cluster.outbound|80||catalog.istioinaction.svc.cluster.local.upstream_cx_active: 2
cluster.outbound|80||catalog.istioinaction.svc.cluster.local.upstream_cx_close_notify: 0
cluster.outbound|80||catalog.istioinaction.svc.cluster.local.upstream_cx_connect_attempts_exceeded: 0
...
cluster.outbound|80||catalog.istioinaction.svc.cluster.local.upstream_rq_timeout: 0
cluster.outbound|80||catalog.istioinaction.svc.cluster.local.upstream_rq_total: 2
cluster.outbound|80||catalog.istioinaction.svc.cluster.local.upstream_rq_tx_reset: 0- 프록시가 알고 있는 모든 백엔드 클러스터에 대한 정보와 그들의 엔드포인트를 나열하도록 다른 쿼리를 합니다.
kubectl exec -it deploy/webapp -c istio-proxy -n istioinaction -- curl localhost:15000/clusters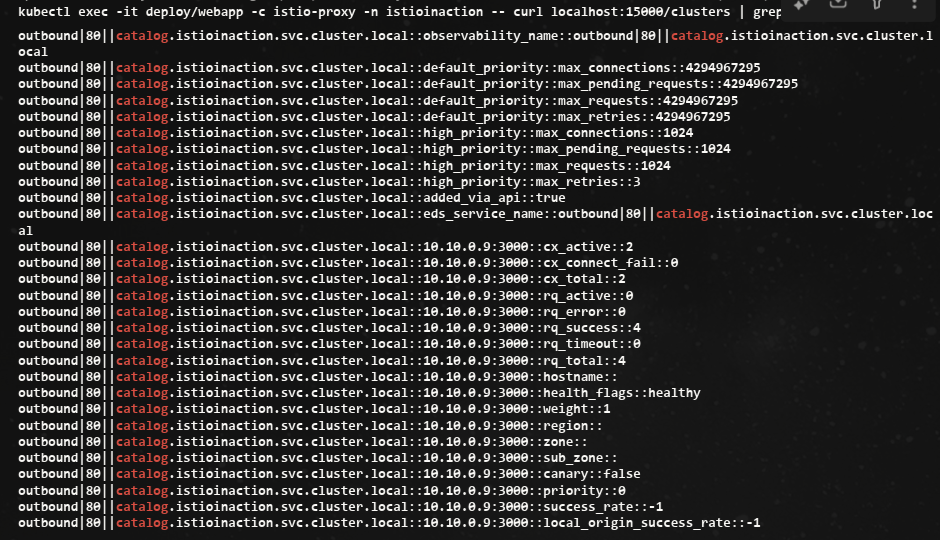
앞 선 통계 집합은 클러스터 전체 정보였는데, 이 통계 집합에서는 엔드포인트별로 자세한 정보를 볼 수 있다.
다음에는 Istio Proxy가 프로메테우스나 데이터독에서 수집하는 방법을 확인한다.
7.2.2 Metrics in the control plane - citadel, pilot, xds 메트릭 확인
- Istiod에는 어떻게 동작하는 지에 대한 정보가 매우 많다.
- 예로 다양한 데이터 플레인 프록시와 설정을 동기화한 횟수, 설정 동기화에 소용된 시간이나 잘못된 설정, 인증서 발급/로테이션 정보 등이 있습니다.
kubectl exec -it deploy/istiod -n istio-system -- netstat -tnl
Active Internet connections (only servers)
Proto Recv-Q Send-Q Local Address Foreign Address State
tcp 0 0 127.0.0.1:9876 0.0.0.0:* LISTEN
tcp6 0 0 :::8080 :::* LISTEN
tcp6 0 0 :::15017 :::* LISTEN
tcp6 0 0 :::15010 :::* LISTEN
tcp6 0 0 :::15012 :::* LISTEN
tcp6 0 0 :::15014 :::* LISTEN
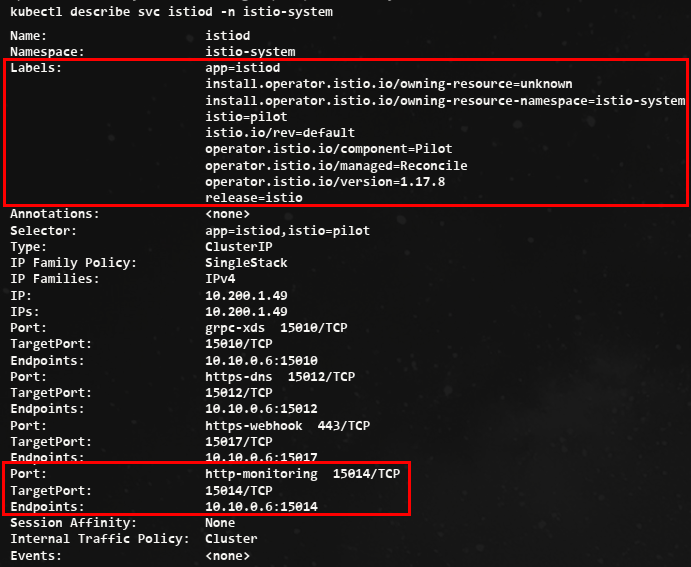
## Citadel : Istio 보안 컴포넌트
kubectl exec -it -n istio-system deploy/istiod -n istio-system -- curl localhost:15014/metrics
kubectl exec -it -n istio-system deploy/istiod -n istio-system -- curl localhost:15014/metrics | grep citadel
# HELP citadel_server_csr_count The number of CSRs received by Citadel server.
# TYPE citadel_server_csr_count counter
citadel_server_csr_count 4
# HELP citadel_server_root_cert_expiry_timestamp The unix timestamp, in seconds, when Citadel root cert will expire. A negative time indicates the cert is expired.
# TYPE citadel_server_root_cert_expiry_timestamp gauge
citadel_server_root_cert_expiry_timestamp 2.060988622e+09
# HELP citadel_server_success_cert_issuance_count The number of certificates issuances that have succeeded.
# TYPE citadel_server_success_cert_issuance_count counter
citadel_server_success_cert_issuance_count 4
kubectl exec -it -n istio-system deploy/istiod -n istio-system -- curl localhost:15014/metrics | grep istio_build
# HELP istio_build Istio component build info
# TYPE istio_build gauge
istio_build{component="pilot",tag="1.17.8"} 1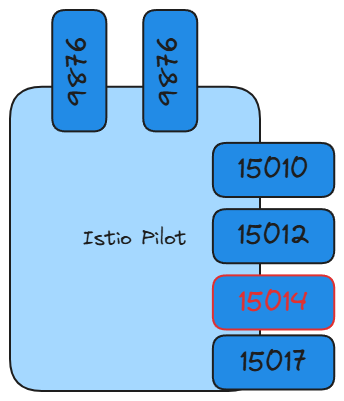
- 설정을 데이터 플레인 프록시에 밀어넣고 동기화하는 데 소용되는 시간의 분포를 보여준다.
- 여기서는 설정 수렴 이벤트 25개 중 24개가 0.1초 이하의 시간이 걸렸으며(le=’0.1’ 로 표시), 하나만 0.1초보다 더 걸렸다(le는 ‘이하’를 의미)
kubectl exec -it -n istio-system deploy/istiod -n istio-system -- curl localhost:15014/metrics | grep convergence
# HELP pilot_proxy_convergence_time Delay in seconds between config change and a proxy receiving all required configuration.
# TYPE pilot_proxy_convergence_time histogram
pilot_proxy_convergence_time_bucket{le="0.1"} 24 # 0.1초 내에 24개의 업데이트가 프록시에 배포됐다
pilot_proxy_convergence_time_bucket{le="0.5"} 25 # 요청 하나는 좀 더 걸려서 0.1~0.5초 범위에 속했다
pilot_proxy_convergence_time_bucket{le="1"} 25
pilot_proxy_convergence_time_bucket{le="3"} 25
pilot_proxy_convergence_time_bucket{le="5"} 25
pilot_proxy_convergence_time_bucket{le="10"} 25
pilot_proxy_convergence_time_bucket{le="20"} 25
pilot_proxy_convergence_time_bucket{le="30"} 25
pilot_proxy_convergence_time_bucket{le="+Inf"} 25
pilot_proxy_convergence_time_sum 0.020836250000000004
pilot_proxy_convergence_time_count 25
이 부분은 컨트롤 플레인에 알려진 서비스 개수, 사용자가 설정한 VirtualService 리소스 개수, 연결된 프록시 개수를 보여준다.
#
kubectl exec -it -n istio-system deploy/istiod -n istio-system -- curl localhost:15014/metrics | grep pilot | egrep 'service|^pilot_xds'
...
# HELP pilot_services Total services known to pilot.
# TYPE pilot_services gauge
pilot_services 8 # 컨트롤플레인에서 알고있는 서비스개수 kubectl get svc -A -oname | wc -l
# HELP pilot_virt_services Total virtual services known to pilot.
# TYPE pilot_virt_services gauge
pilot_virt_services 1 # 유저가 설정한 VirtualService 개수 kubectl get vs -A -oname | wc -l
# HELP pilot_vservice_dup_domain Virtual services with dup domains.
# TYPE pilot_vservice_dup_domain gauge
pilot_vservice_dup_domain 0
pilot_xds{version="1.17.8"} 3 # 연결된 프록시 개수 docker exec -it myk8s-control-plane istioctl proxy-status
마지막 부분은 특정 xDS API의 업데이트 횟수를 보여준다.
# xDS별 업데이트 횟수 (counter)
kubectl exec -it -n istio-system deploy/istiod -n istio-system -- curl localhost:15014/metrics | grep pilot_xds_pushes
# HELP pilot_xds_pushes Pilot build and send errors for lds, rds, cds and eds.
# TYPE pilot_xds_pushes counter
pilot_xds_pushes{type="cds"} 26
pilot_xds_pushes{type="eds"} 38
pilot_xds_pushes{type="lds"} 26
pilot_xds_pushes{type="rds"} 21
- 지금까지 데이터 플레인과 컨트롤 플레인이 내부에서 일어나는 일을 얼마나 자세히 보고하는지를 설명했다.
- 세부 사항을 노출하는 것은 관찰 가능한 시스템을 구축하는 데 중요하다.
- 그런데 서비스 메시 구성 요소가 이 정보를 노출한다고 해도 메시의 운영자나 사용자는 이 메트릭을 어떻게 활용할지를 고민해봐야 한다.
- 이 메트릭들을 얻자고 데이터 플레인이나 컨트롤 플레인의 각 구성 요소에 일일이 접근하는 것은 비현실적이다.
- 그러므로 메트릭 수집과 시계열 데이터베이스 시스템을 어떻게 사용하면 이 과정을 자동화하고 데이터를 쓸 만한 방식으로 표시할 수 있을지 살펴보자.
7.3 Scraping Istio metrics with Prometheus
- 프로메테우스
사운드클라우드에서 시작된 메트릭 수집 엔진이자 관련 모니터링 및 얼럿 alert 도구 집합이며, 구글의 내부 모니터링 시스템 Borgmon 에 어느 정도 기반을 두고 있다 (쿠버네티스가 Borg에 기반을 둔 것과 비슷하게).
또한, 다른 텔레메트릭 혹은 메트릭 수집 시스템과 조금 다른데, 에이전트가 메트릭을 ‘밀어넣기 push’를 기대하기보다 메트릭을 ‘당겨오기 pull’ 때문이다.
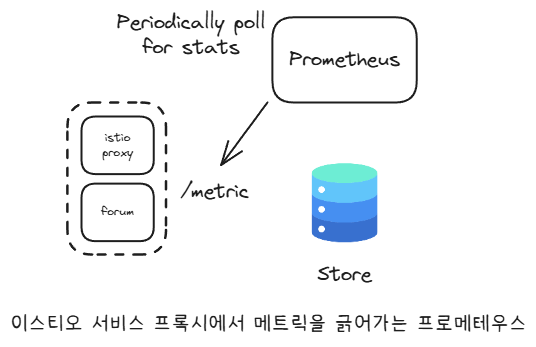
- 프로메테우스를 사용하는 이점 중 하나는 단순 HTTP 클라이언트나 웹 브라우저를 사용해 메트릭 엔드포인트를 살펴볼 수 있다는 것이다.
# istiod 파드에 tcp LISTEN port 정보 확인
kubectl exec -it deploy/webapp -n istioinaction -c istio-proxy -- netstat -tnl
Active Internet connections (only servers)
Proto Recv-Q Send-Q Local Address           Foreign Address         State
tcp        0      0 127.0.0.1:15000         0.0.0.0:*               LISTEN
tcp        0      0 127.0.0.1:15004         0.0.0.0:*               LISTEN
tcp        0      0 0.0.0.0:15090           0.0.0.0:*               LISTEN
tcp        0      0 0.0.0.0:15090           0.0.0.0:*               LISTEN
tcp        0      0 0.0.0.0:15001           0.0.0.0:*               LISTEN
tcp        0      0 0.0.0.0:15001           0.0.0.0:*               LISTEN
tcp        0      0 0.0.0.0:15006           0.0.0.0:*               LISTEN
tcp        0      0 0.0.0.0:15006           0.0.0.0:*               LISTEN
tcp        0      0 0.0.0.0:15021           0.0.0.0:*               LISTEN
tcp        0      0 0.0.0.0:15021           0.0.0.0:*               LISTEN
tcp6       0      0 :::8080                 :::*                    LISTEN
tcp6       0      0 :::15020                :::*                    LISTEN
Istio Proxy가 주입된 모든 애플리케이션은 자동으로 이런 프로메테우스 메트릭을 노출한다.

- 15090 : Exposes Envoy proxy metrics such as xDS stats, connection stats, HTTP stats, outlier stats, health check stats, circuit-breaker stats, and so on.
- 15020 : Exposes a variety of functionalities, the main ones being as follows:
7.3.1 Setting up Prometheus and Grafana : kube prometheus stack 설치
kube-prometheus-stack 프로젝트의 목적은 ‘프로메테우스 오퍼레이터나 그라파나, Alertmanager, Node exporter, Kube API용 어댑터 등’ 부수적인 부분들을 포함해 프로메테우스의 현실적이고 고가용성인 배포 형상을 사전에 선별하고 통합하는 것이다.
kube-prometheus-stack 설치
#
helm repo add prometheus-community https://prometheus-community.github.io/helm-charts
helm repo update
#
cat ch7/prom-values.yaml
open ch7/prom-values.yaml
cat << EOF > prom-values-2.yaml
prometheusOperator:
tls:
enabled: false
admissionWebhooks:
patch:
enabled: false
prometheus:
service:
type: NodePort
nodePort: 30001
grafana:
service:
type: NodePort
nodePort: 30002
EOF
# helm 설치
kubectl create ns prometheus
helm install prom prometheus-community/kube-prometheus-stack --version 13.13.1 \
-n prometheus -f ch7/prom-values.yaml -f prom-values-2.yaml
# 확인
helm list -n prometheus
kubectl get-all -n prometheus # krew plugin
kubectl get sts,deploy,pod,svc,ep,cm,secret -n prometheus
kubectl get crd | grep monitoring
kubectl get prometheus,servicemonitors -n prometheus
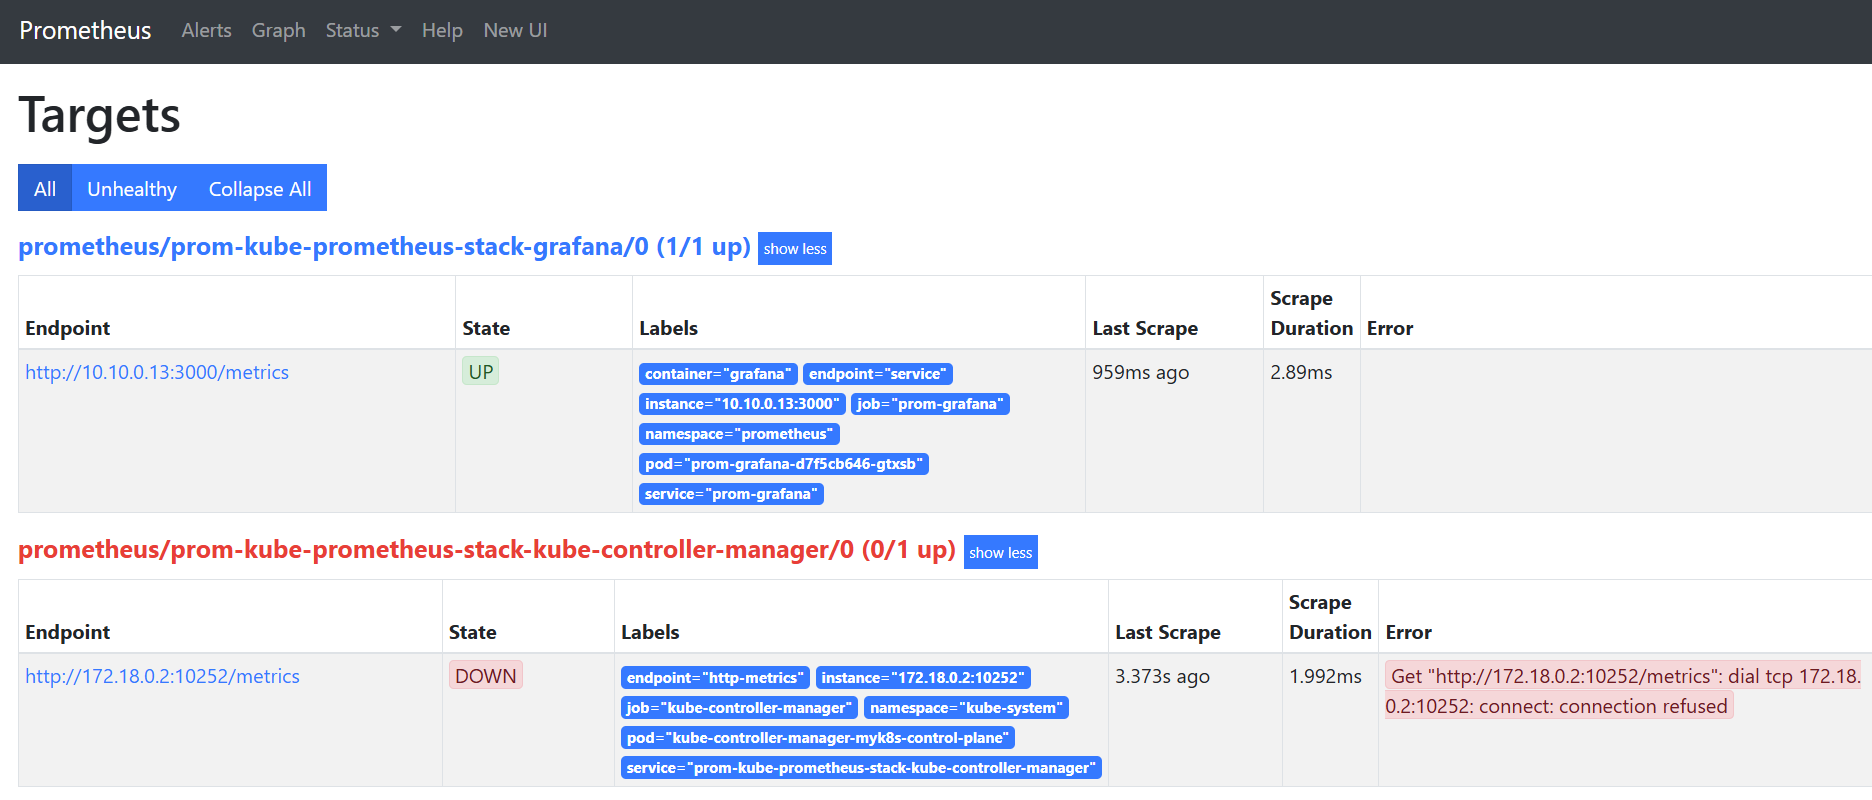
# Prometheus 접속 : Service Discovery, Target 확인
open http://127.0.0.1:30001
#
kubectl get servicemonitors -n prometheus
NAME AGE
prom-kube-prometheus-stack-grafana 12m
prom-kube-prometheus-stack-kube-controller-manager 12m
prom-kube-prometheus-stack-operator 12m
prom-kube-prometheus-stack-prometheus 12m
# (참고) 프로메테우스 버전 확인
kubectl exec -it sts/prometheus-prom-kube-prometheus-stack-prometheus -n prometheus -c prometheus -- prometheus --version
prometheus, version 2.24.0 (branch: HEAD, revision: 02e92236a8bad3503ff5eec3e04ac205a3b8e4fe)
...
# Grafana 접속 : admin / prom-operator
open http://127.0.0.1:30002- 프로메테우스 접속 확인 (Target)
- 그라파나도 접속 확인
7.3.2 Configuring the Prometheus Operator to scrape the Istio control plane and workloads
Istio Control Plane과 워크로드를 긁어가도록 프로메테우스 오퍼레이터 설정하기
프로메테우스가 이스티오에서 메트릭을 수집하도록 설정하기 위해 프로메테우스 오퍼레이터의 커스텀 리소스 ServiceMonitor 와 PodMonitor 를 사용합니다.
- ServiceMonitor 리소스로 Istio Control Plane 구성 요소를 가져오는 방법
# cat ch7/service-monitor-cp.yaml
apiVersion: monitoring.coreos.com/v1
kind: ServiceMonitor
metadata:
  name: istio-component-monitor
  namespace: prometheus
  labels:
    monitoring: istio-components
    release: prom
spec:
  jobLabel: istio
  targetLabels: [app]
  selector:
    matchExpressions:
    - {key: istio, operator: In, values: [pilot]}
  namespaceSelector:
    any: true
  endpoints:
  - port: http-monitoring # 15014
    interval: 15s
ServiceMonitor를 적용해 컨트롤 플레인 수집
# ServiceMonitor 적용
kubectl apply -f ch7/service-monitor-cp.yaml -n prometheus

# 확인
kubectl get servicemonitor -n prometheus
NAME                                                 AGE
istio-component-monitor                              5s
prom-kube-prometheus-stack-grafana                   13m
prom-kube-prometheus-stack-kube-controller-manager   13m
prom-kube-prometheus-stack-operator                  13m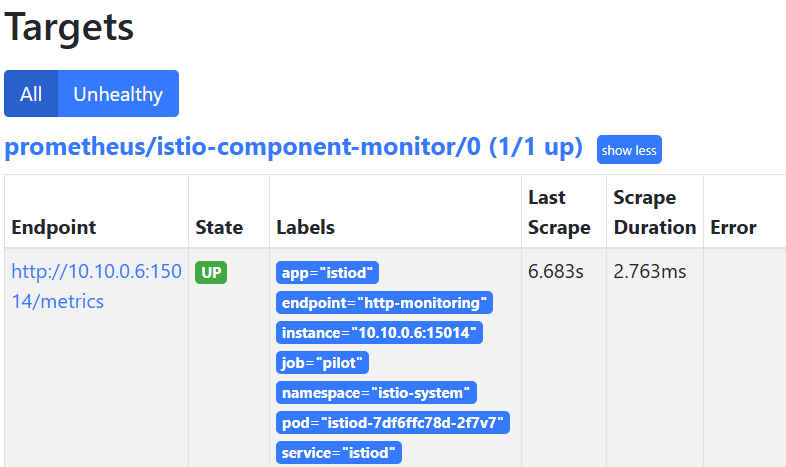
prom-kube-prometheus-stack-prometheus 13m- Istiod의 Targets와 Service Discovery
데이터 플레인 수집 활성화 : PodMonitor 리소스를 사용해 istio-proxy 컨테이너를 포함하는 모든 파드에서 메트릭을 수집
#
kubectl describe pod -n istioinaction
...
Annotations: ...
prometheus.io/path: /stats/prometheus
prometheus.io/port: 15020
prometheus.io/scrape: true
#
cat ch7/pod-monitor-dp.yaml
apiVersion: monitoring.coreos.com/v1
kind: PodMonitor
metadata:
name: envoy-stats-monitor
namespace: prometheus
labels:
monitoring: istio-proxies
release: prom
spec:
selector:
matchExpressions:
- {key: istio-prometheus-ignore, operator: DoesNotExist}
namespaceSelector:
any: true
jobLabel: envoy-stats
podMetricsEndpoints:
- path: /stats/prometheus
interval: 15s
relabelings:
- action: keep
sourceLabels: [__meta_kubernetes_pod_container_name]
regex: "istio-proxy"
- action: keep
sourceLabels: [__meta_kubernetes_pod_annotationpresent_prometheus_io_scrape]
- sourceLabels: [
__address__, __meta_kubernetes_pod_annotation_prometheus_io_port]
action: replace
regex: ([^:]+)(?::\d+)?;(\d+)
replacement: $1:$2
targetLabel: __address__
- action: labeldrop
regex: "__meta_kubernetes_pod_label_(.+)"
- sourceLabels: [__meta_kubernetes_namespace]
action: replace
targetLabel: namespace
- sourceLabels: [__meta_kubernetes_pod_name]
action: replace
targetLabel: pod_name
# PodMonitor 설정 적용
kubectl apply -f ch7/pod-monitor-dp.yaml -n prometheus
#
kubectl get podmonitor -n prometheus
NAME AGE
envoy-stats-monitor 6s
# metric 확인을 위해서 호출테스트
for in in {1..10}; do curl -s http://webapp.istioinaction.io:30000/ ; sleep 0.5; done
for in in {1..10}; do curl -s http://webapp.istioinaction.io:30000/api/catalog ; sleep 0.5; done
# 반복 접속
while true; do curl -s http://webapp.istioinaction.io:30000/api/catalog ; date "+%Y-%m-%d %H:%M:%S" ; sleep 1; echo; done
#
WEBAPP=$(kubectl get pod -n istioinaction -l app=webapp -o jsonpath='{.items[0].status.podIP}')
kubectl exec -it netshoot -- curl -s $WEBAPP:15020/stats/prometheus
...
kubectl exec -it netshoot -- curl -s $WEBAPP:15090/stats/prometheus
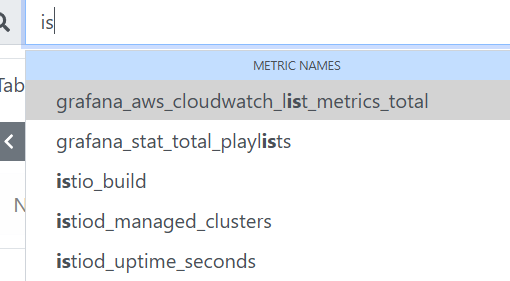
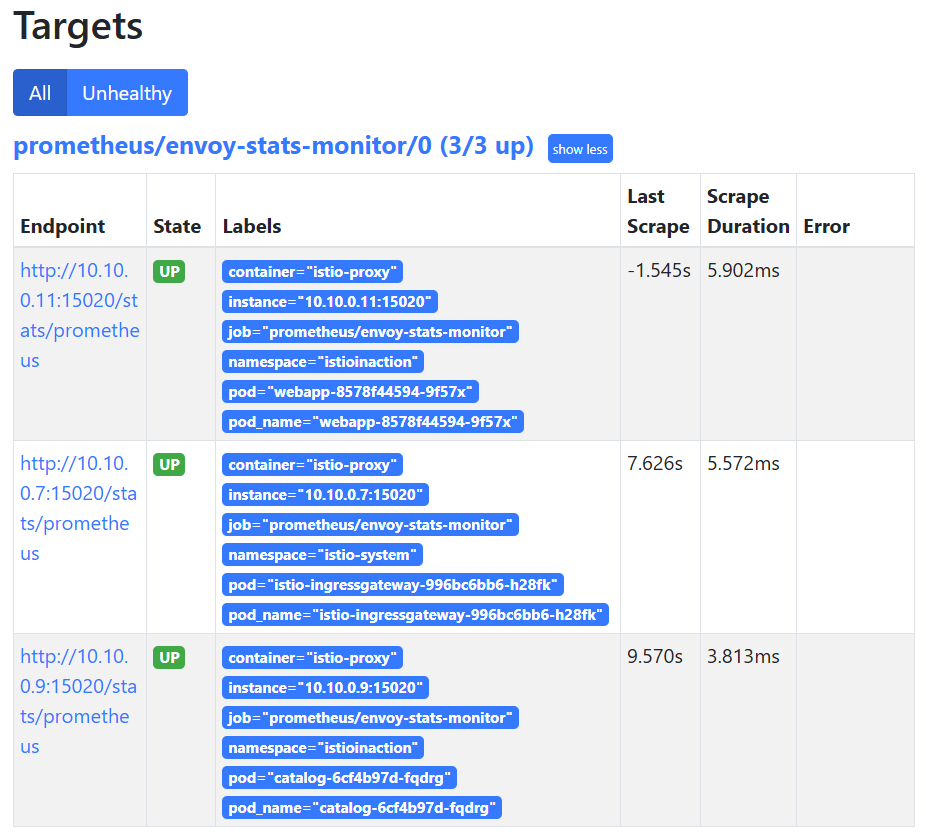
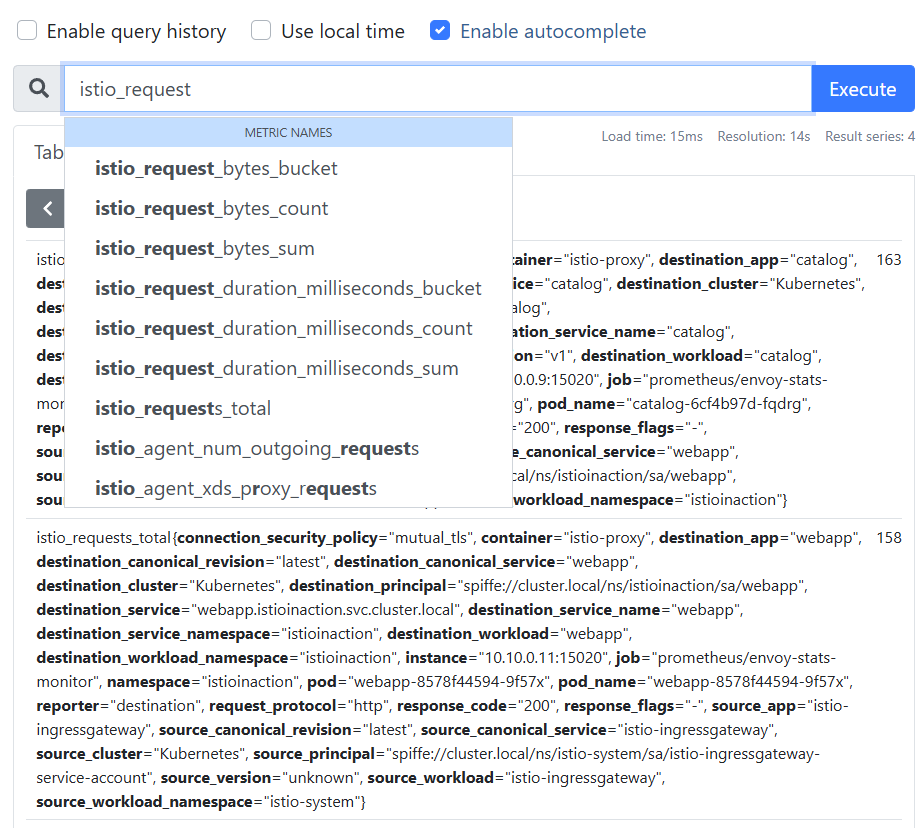
...- 프로메테우스 웹 확인 : Service Discovery, Targets ⇒ istio_request 쿼리문 입력 확인
7.4 Customizing Istio's standard metrics
Istio Envoy Proxy 사이드카에 몇 가지 플러그인을 사용해 메트릭이 표시, 커스터마이징, 생성되는 방법을 제어한다.
이번에는 플러그인을 자세히 살펴볼 예정이다. 그전에 세가지 개념을 이해하고 가야 합니다.
- 메트릭 metric : counter, gauge, or histogram/distribution of telemetry between service calls (inbound/outbound).
- 디멘션 dimenstion
- 속성 attribute
-
메트릭은 서비스 호출(인바운드/아웃바운드) 간 텔레메트리의 카운터나 게이지, 히스토그램/분포를 말한다.
-
예를 들어 istio_requests_total 메트릭은 서비스로 향하는(인바운드) 혹은 서비스에서 나오는(아웃바운드) 요청의 총 개수를 센다.
-
인바운드나 아웃바운드는 메트릭 디멘션의 예시다.
-
Istio의 프록시에 통계를 쿼리할 때, 메트릭과 디멘션 조합마다 통계가 따로 표시된다.
-
그러나 방향만이 유일한 디멘션은 아니다. 메트릭에는 디멘션이 여럿일 수 있다.
아래는 istio_requests_total에는 다음과 같은 기본 디멘션들이고, 하나라도 다르면 메트릭의 새로운 항목으로 보인다.
# TYPE istio_requests_total counter
istio_requests_total{
response_code="200", # 요청 세부 정보 Request details
reporter="destination", # 메트릭이 누구 관점인가? Point of view of metric
source_workload="istio-ingressgateway",
source_workload_namespace="istio-system",
source_app="istio-ingressgateway", # 호출 주제 Caller
source_version="unknown",
source_cluster="Kubernetes",
destination_workload="webapp",
destination_workload_namespace="istioinaction",
destination_app="webapp", # 호출 대상 Target of call
destination_version="unknown",
destination_service="webapp.istioinaction.svc.cluster.local",
destination_service_name="webapp",
destination_service_namespace="istioinaction",
destination_cluster="Kubernetes",
request_protocol="http",
response_flags="-",
grpc_response_status="",
connection_security_policy="mutual_tls",
source_canonical_service="istio-ingressgateway",
destination_canonical_service="webapp",
source_canonical_revision="latest",
destination_canonical_revision="latest"
} 6 # 호출 개수 Number of calls- 특정 메트릭에 대해 채우고 보고할 디멘션은 설정할 때 지정할 수 있다.
- 특정 디멘션의 값은 Envoy Proxy가 런타임에 갖고 있는 값인 속성에서 가져온다.
아래는 기본 속성 중 일부이며, 다른 속성도 있다.
표 7.2 : 기본 엔보이 요청 속성
| 속성 | 설명 |
|---|---|
| request.path | URL 중 경로 부분 |
| request.url_parh | URL 중 경로 부분, 쿼리 문자열 제외 |
| request.host | URL 중 호스트 부분 |
| request.scheme | URL 중 스킴 부분(예: ‘http’) |
| request.headers | 요청 메서드 (예. ‘GET’) |
| request.referer | 요청 헤더 Referer |
| request.useragent | 요청 헤더 User agent |
| request.time | 첫 번째 바이트 수신 시간 |
| request.id | x-request-id 헤더 값에 해당하는 요청 ID |
| request.protocol | 요청 프로토콜 |
- 또 다른 속성 집합은 이스티오의 peer-metadata 필터(이스티오 프록시에 내장)에서 나오며, 서비스 호출의 upstream_peer와 downstream_peer 모두에서 사용할 수 있다.
- 표 7.3은 사용 가능한 속성을 보여준다. 표 7.3 : 메타데이터 교환 필터가 제공하는 이스티오 전용 속성
속성 설명 name 파드 이름 namespace 파드가 위치한 네임스페이스 labels 워크로드 레이블 owner 워크로드 소유자 workload_name 워크로드 이름 platform_metadata 접두사 키가 있는 플랫폼 메타데이터 istio_version 프록시의 버전 식별자 mesh_id 메시의 고유 식별자 cluster_id 해당 워크로드가 속한 클러스터의 식별자 app_containers 애플리케이션 컨테이너별 짧은 이름 목록
여기 있는 속성을 사용하려면 업스트림(프록시에서 나가는) 메트릭인지, 다운스트림(프록시로 들어오는) 메트릭인지 따라 upstream_peer 나 downstream_peer 를 접두사로 붙이면 된다.
7.4.1 Configuring existing metrics
기본적으로, 이스티오 메트릭은 이스티오를 설치할 때 설치되는 EnvoyFilter 리소스를 사용해 stats 프록시 플러그인에서 설정한다.
# 메트릭 정보 수정 시 모든 버전의 envoyfilter 에 반영(업데이트)되는지 확인해보자.
kubectl get envoyfilter -n istio-system
NAME                    AGE
stats-filter-1.13       13h # 스터디 실습에서 사용
stats-filter-1.14       13h
stats-filter-1.15       13h
stats-filter-1.16       13h
stats-filter-1.17       13h # 현재 실습 istiod 버전
tcp-stats-filter-1.13   13h
tcp-stats-filter-1.14   13h
tcp-stats-filter-1.15   13h
tcp-stats-filter-1.16   13h
tcp-stats-filter-1.17   13h

#
kubectl get envoyfilter stats-filter-1.13 -n istio-system -o yaml
...
spec:
  configPatches:
  - applyTo: HTTP_FILTER
    match:
      context: SIDECAR_OUTBOUND
      listener:
        filterChain:
          filter:
            name: envoy.filters.network.http_connection_manager
            subFilter:
              name: envoy.filters.http.router
      proxy:
        proxyVersion: ^1\.13.*
    patch:
      operation: INSERT_BEFORE
      value:
        name: istio.stats # 필터 이름
        typed_config:
          '@type': type.googleapis.com/udpa.type.v1.TypedStruct
          type_url: type.googleapis.com/envoy.extensions.filters.http.wasm.v3.Wasm
          value:
            config: # 필터 설정
              configuration:
                '@type': type.googleapis.com/google.protobuf.StringValue
                value: |
                  {
                    "debug": "false",
                    "stat_prefix": "istio"
                  }
              root_id: stats_outbound
              vm_config:
                code:
                  local:
                    inline_string: envoy.wasm.stats
                runtime: envoy.wasm.runtime.null
                vm_id: stats_outbound
...- istio.stats 필터를 직접 구성하는데, 통계(메트릭) 기능을 구현하는 웹어셈블리 플러그인이다.
- 이 웹어셈블리 필터는 실제로는 엔보이 코드베이스 내에서 직접 컴파일돼 NULL 가상머신에서 실행되므로, 웹어셈블리 가상머신에서 실행되지 않는다.
- 이를 웹어셈블리 가상머신에서 실행하려면 istioctl 로 설치할 때
-–setvalues.telemetry.v2.prometheus.wasmEnabled=true플래그를 전달하거나 상응하는IstioOperator설정을 해야 한다.
ADDING DIMENSIONS TO EXISTING METRICS 기존 메트릭에 디멘션 추가하기
- istio_request_total 메트릭에 디멘션을 2개 추가하고 싶다고 해보자.
- 아마 추적을 강화하려는 목적으로, 업스트림 호출에서 meshId 별로 프록시의 버전이 어떤지 확인하고 싶을 수 있다.
upstream_proxy_version및source_mesh_id디멘션을 추가해보자. (추적하고 싶지 않거나 원하는 것보다 많은 정보를 생성하는 기존 디멘션을 제거할 수도 있다)
#
cat ch7/metrics/istio-operator-new-dimensions.yaml
apiVersion: install.istio.io/v1alpha1
kind: IstioOperator
spec:
  profile: demo
  values:
    telemetry:
      v2:
        prometheus:
          configOverride:
            inboundSidecar:
              metrics:
              - name: requests_total
                dimensions: # 추가한 새 디멘션
                  upstream_proxy_version: upstream_peer.istio_version
                  source_mesh_id: node.metadata['MESH_ID']
                tags_to_remove: # 제거한 태그 목록
                - request_protocol
            outboundSidecar:
              metrics:
              - name: requests_total
                dimensions:
                  upstream_proxy_version: upstream_peer.istio_version
                  source_mesh_id: node.metadata['MESH_ID']
                tags_to_remove:
                - request_protocol
            gateway:
              metrics:
              - name: requests_total
                dimensions:
                  upstream_proxy_version: upstream_peer.istio_version
                  source_mesh_id: node.metadata['MESH_ID']
                tags_to_remove:
                - request_protocol

# 기존 설정 확인
kubectl get istiooperator installed-state -n istio-system -o yaml | grep -E "prometheus:|telemetry:" -A2
    telemetry:
      enabled: true
      v2:
--
        prometheus:
          enabled: true
          wasmEnabled: false

# 메트릭 확인 : request_protocol 디멘션이 메트릭에 있는지 먼저 확인 >> 아래 설정 적용 후에 확인 시 해당 디멘션 없이 출력됨.
# 프로메테우스 UI 에서도 확인 : istio_requests_total - Link
kubectl -n istioinaction exec -it deploy/webapp -c istio-proxy \
-- curl localhost:15000/stats/prometheus | grep istio_requests_total
...

# 설정 적용
docker exec -it myk8s-control-plane bash
----------------------------------------
# 파일 작성
cat << EOF > istio-operator-new-dimensions.yaml
apiVersion: install.istio.io/v1alpha1
kind: IstioOperator
spec:
  profile: demo
  values:
    telemetry:
      v2:
        prometheus:
          configOverride:
            inboundSidecar:
              metrics:
              - name: requests_total
                dimensions:
                  upstream_proxy_version: upstream_peer.istio_version
                  source_mesh_id: node.metadata['MESH_ID']
                tags_to_remove:
                - request_protocol
            outboundSidecar:
              metrics:
              - name: requests_total
                dimensions:
                  upstream_proxy_version: upstream_peer.istio_version
                  source_mesh_id: node.metadata['MESH_ID']
                tags_to_remove:
                - request_protocol
            gateway:
              metrics:
              - name: requests_total
                dimensions:
                  upstream_proxy_version: upstream_peer.istio_version
                  source_mesh_id: node.metadata['MESH_ID']
                tags_to_remove:
                - request_protocol
EOF

istioctl verify-install -f istio-operator-new-dimensions.yaml # 리소스별로 적용결과를 출력
istioctl install -f istio-operator-new-dimensions.yaml -y

exit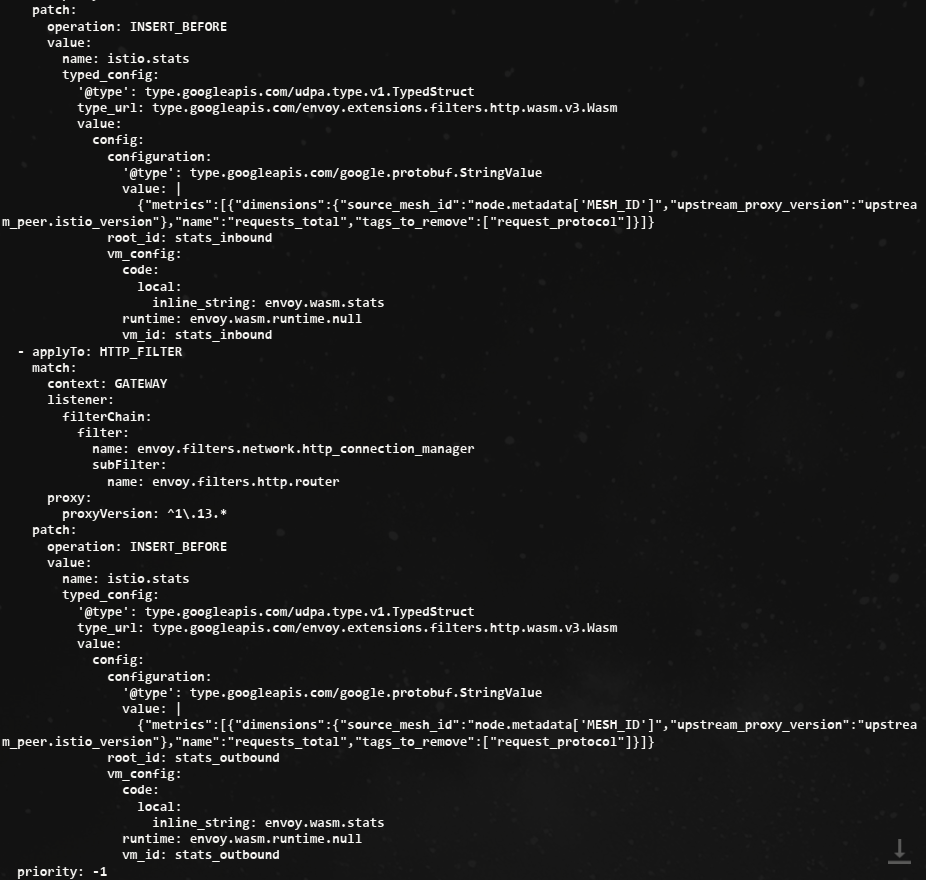
----------------------------------------- 변경 설정 확인
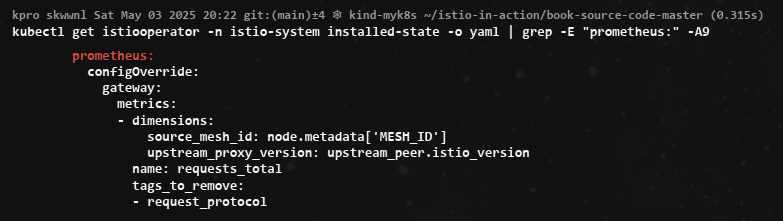
- envoyfilter "stats-filter-{stat-postfix}"도 업데이트 확인
- 메트릭에서 이 디멘션을 확인하기 전에 이스티오의 프록시가 이 디멘션에 대해 알게 해야 한다.
- 이렇게 하려면 디플로이먼트 파드 Spec에
sidecar.istio.io/extraStatTags애노테이션을 달아야 한다. - 이 애노테이션은 디폴이먼트 메타데이터가 아니라
spec.template.metadata파드 템플릿에 추가돼야 한다는 점을 유의하자.
적용
#
cat ch7/metrics/webapp-deployment-extrastats.yaml
---
apiVersion: apps/v1
kind: Deployment
metadata:
labels:
app: webapp
name: webapp
spec:
replicas: 1
selector:
matchLabels:
app: webapp
template:
metadata:
annotations:
proxy.istio.io/config: |-
extraStatTags:
- "upstream_proxy_version"
- "source_mesh_id"
labels:
app: webapp
spec:
containers:
- env:
- name: KUBERNETES_NAMESPACE
valueFrom:
fieldRef:
fieldPath: metadata.namespace
image: istioinaction/webapp:latest
imagePullPolicy: IfNotPresent
name: webapp
ports:
- containerPort: 8080
name: http
protocol: TCP
securityContext:
privileged: false
#
kubectl apply -n istioinaction -f ch7/metrics/webapp-deployment-extrastats.yaml
# metric 확인을 위해서 호출테스트
for in in {1..10}; do curl -s http://webapp.istioinaction.io:30000/api/catalog ; sleep 0.5; done
while true; do curl -s http://webapp.istioinaction.io:30000/api/catalog ; date "+%Y-%m-%d %H:%M:%S" ; sleep 1; echo; done
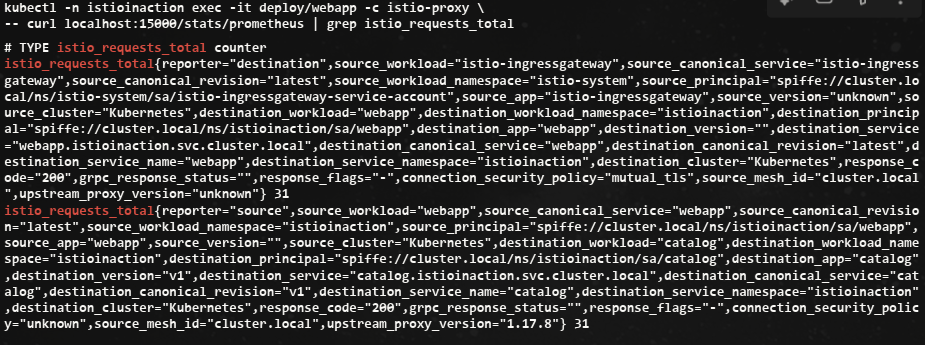
# 메트릭 확인 : request_protocol 디멘션이 디멘션 목록에 없는 것도 확인
kubectl -n istioinaction exec -it deploy/webapp -c istio-proxy \
-- curl localhost:15000/stats/prometheus | grep istio_requests_total
istio_requests_total{reporter="destination",source_workload="istio-ingressgateway",source_canonical_service="istio-ingressgateway",source_canonical_revision="latest",source_workload_namespace="istio-system",source_principal="spiffe://cluster.local/ns/istio-system/sa/istio-ingressgateway-service-account",source_app="istio-ingressgateway",source_version="unknown",source_cluster="Kubernetes",destination_workload="webapp",destination_workload_namespace="istioinaction",destination_principal="spiffe://cluster.local/ns/istioinaction/sa/webapp",destination_app="webapp",destination_version="",destination_service="webapp.istioinaction.svc.cluster.local",destination_canonical_service="webapp",destination_canonical_revision="latest",destination_service_name="webapp",destination_service_namespace="istioinaction",destination_cluster="Kubernetes",response_code="200",grpc_response_status="",response_flags="-",connection_security_policy="mutual_tls",source_mesh_id="cluster.local",upstream_proxy_version="unknown"} 10
istio_requests_total{reporter="source",source_workload="webapp",source_canonical_service="webapp",source_canonical_revision="latest",source_workload_namespace="istioinaction",source_principal="spiffe://cluster.local/ns/istioinaction/sa/webapp",source_app="webapp",source_version="",source_cluster="Kubernetes",destination_workload="catalog",destination_workload_namespace="istioinaction",destination_principal="spiffe://cluster.local/ns/istioinaction/sa/catalog",destination_app="catalog",destination_version="v1",destination_service="catalog.istioinaction.svc.cluster.local",destination_canonical_service="catalog",destination_canonical_revision="v1",destination_service_name="catalog",destination_service_namespace="istioinaction",destination_cluster="Kubernetes",response_code="200",grpc_response_status="",response_flags="-",connection_security_policy="unknown",source_mesh_id="cluster.local",upstream_proxy_version="1.17.8"} 10
...
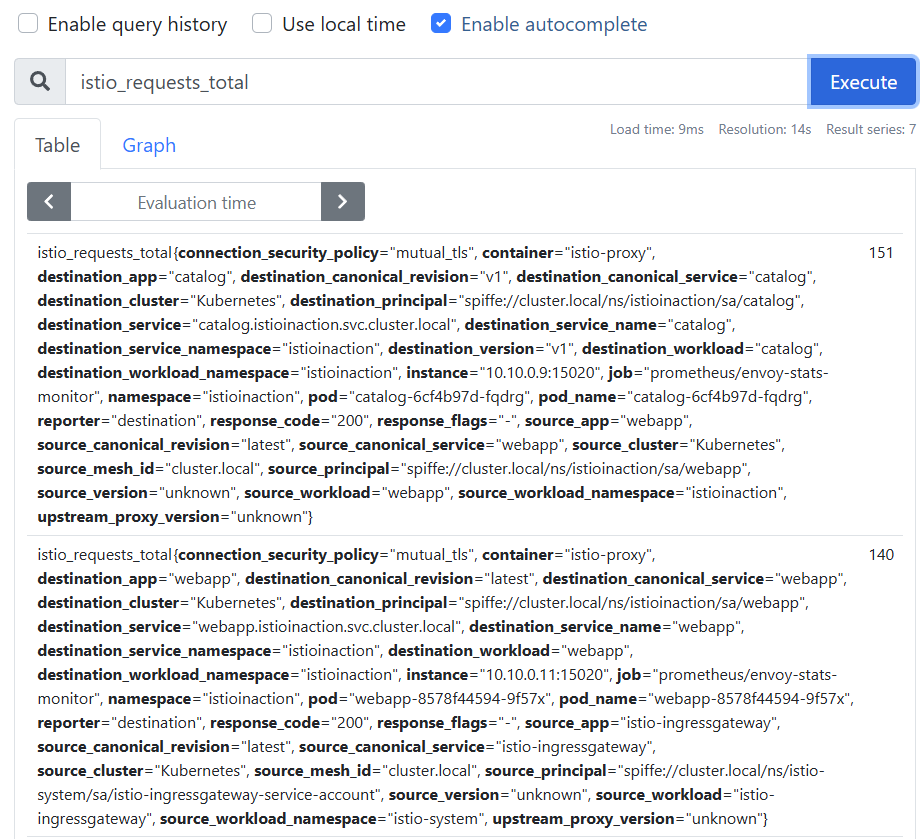
- 프로메테우스 UI 에서 확인 : istio_requests_total
7.4.2 Creating new metrics
- 새 메트릭을 만들고 싶다면 stats 플러그인에 새 메트릭을 정의하면 된다.
# cat ch7/metrics/istio-operator-new-metric.yaml
apiVersion: install.istio.io/v1alpha1
kind: IstioOperator
spec:
  profile: demo
  values:
    telemetry:
      v2:
        prometheus:
          configOverride:
            inboundSidecar:
              definitions:
              - name: get_calls
                type: COUNTER
                value: "(request.method.startsWith('GET') ? 1 : 0)"
            outboundSidecar:
              definitions:
              - name: get_calls
                type: COUNTER
                value: "(request.method.startsWith('GET') ? 1 : 0)"
            gateway:
              definitions:
              - name: get_calls
                type: COUNTER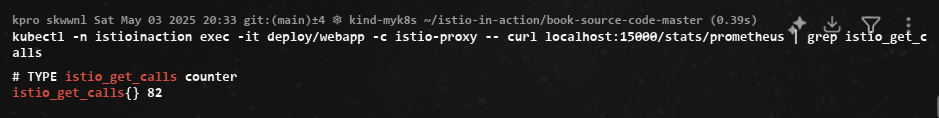
value: "(request.method.startsWith('GET') ? 1 : 0)"- 여기서 만든 메트릭은
istio_get_calls인데, 정의한 이름은get_calls라는 점을 유의하자. 앞서 언급했듯이istio_접두사는 자동으로 붙는다. - 이 메트릭을 COUNTER로 정의했지만 GAUGE 나 HISTOGRAM도 선택할 수 있다. 메트릭의 값은 CEL Common Expression Language 표현식인 문자열로, COUNTER 타입에 정수를 반환해야 한다.
- CEL 표현식은 속성에 대해 작동하여, 여기서는 HTTP GET 요청 개수를 센다.
- 이 설정을 적용해
istio_get_calls라는 새 메트릭을 만듭니다.
# 설정 적용
docker exec -it myk8s-control-plane bash
----------------------------------------
cat << EOF > istio-operator-new-metric.yaml
apiVersion: install.istio.io/v1alpha1
kind: IstioOperator
spec:
profile: demo
values:
telemetry:
v2:
prometheus:
configOverride:
inboundSidecar:
definitions:
- name: get_calls
type: COUNTER
value: "(request.method.startsWith('GET') ? 1 : 0)"
outboundSidecar:
definitions:
- name: get_calls
type: COUNTER
value: "(request.method.startsWith('GET') ? 1 : 0)"
gateway:
definitions:
- name: get_calls
type: COUNTER
value: "(request.method.startsWith('GET') ? 1 : 0)"
EOF
istioctl verify-install -f istio-operator-new-metric.yaml # 리소스별로 적용결과를 출력
istioctl install -f istio-operator-new-metric.yaml -y
exit
----------------------------------------
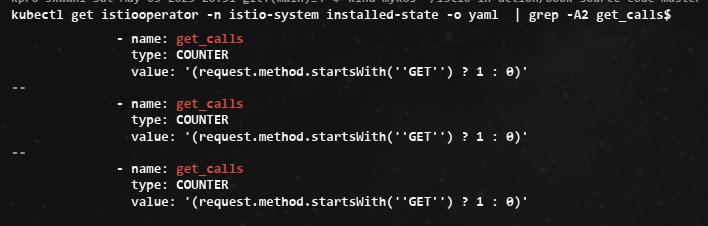
# 확인
kubectl get istiooperator -n istio-system installed-state -o yaml | grep -A2 get_calls$
- name: get_calls
type: COUNTER
value: '(request.method.startsWith(''GET'') ? 1 : 0)''
...
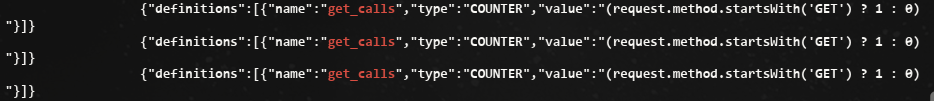
kubectl get envoyfilter -n istio-system stats-filter-1.13 -o yaml | grep get_calls
...
{"definitions":[{"name":"get_calls","type":"COUNTER","value":"(request.method.startsWith('GET') ? 1 : 0)"}]}
...
새 디멘션은 이스티오 프록시에 명시적으로 알려야 했다. 새 메트릭을 만들때는 프록시에 노출하라고 이스티오에 알려아 한다. → 1.17 안해도됨
# webapp 디플로이먼트의 파드 사양에 애너테이션을 추가한다
cat ch7/metrics/webapp-deployment-new-metric.yaml
...
  template:
    metadata:
      annotations:
        proxy.istio.io/config: |-
          proxyStatsMatcher:
            inclusionPrefixes:
            - "istio_get_calls"
      labels:
        app: webapp
...

#
kubectl -n istioinaction apply -f ch7/metrics/webapp-deployment-new-metric.yaml
# metric 확인을 위해서 호출테스트
for in in {1..10}; do curl -s http://webapp.istioinaction.io:30000/api/catalog ; sleep 0.5; done
while true; do curl -s http://webapp.istioinaction.io:30000/api/catalog ; date "+%Y-%m-%d %H:%M:%S" ; sleep 1; echo; done-
메트릭 확인
-
프로메테우스 UI 확인 : istio_get_calls
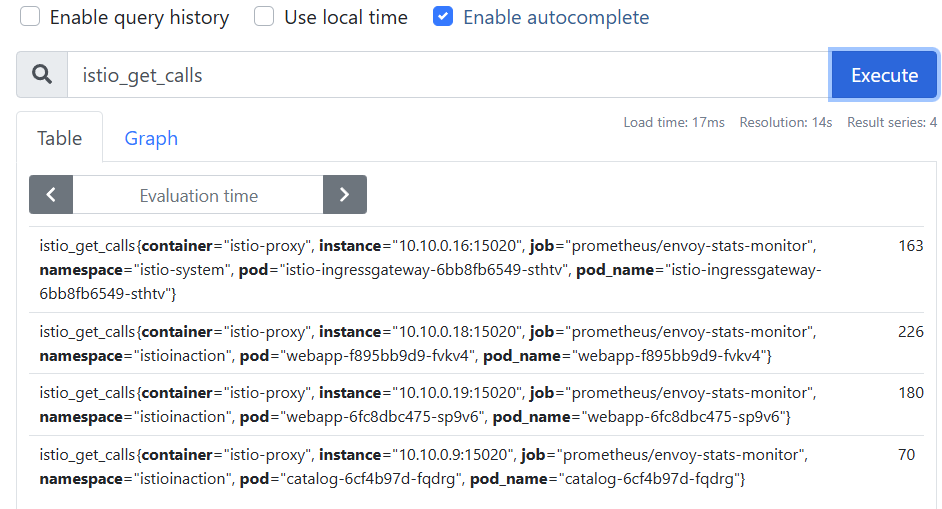
- 이 메트릭에는 어떤 디멘션도 지정하지 않았다. 보고 싶은 디멘션을 맞춤 설정하고 싶다면 앞 절의 단계를 따르면 된다.
- 여기서는 시스템 내 모든 요청 중 GET 요청의 개수를 세려고 한다. 이는 새로운 메트릭을 생성하는 기능의 힘을 보여주기 위해 고안한 예제다.
- catalog 서비스의 /items 엔드포인트로 향하는 모든 GET 요청의 개수를 세고 싶다면 어떻게 해야 할까?
- 이스티오 stats 플러그인을 사용하면 할 수 있다.
7.4.3 Grouping calls with new attributes
- 기존 속성을 기반으로 더 세분화하거나 도메인에 특화해 새 속성을 만들 수 있다.
- 이 속성은 request.path_url 과 request.method 를 조합해 catalog 서비스의 /items API로 가는 GET 호출 개수를 추적하려는 것이다.
- 이를 위해 이스티오 attribute-gen 프록시 플러그인을 사용하는데, 이 플러그인은 프록시 메트릭의 동작을 개조하는 데 사용하는 또 다른 웹어셈블리 Wasm extension 확장이다.
- EnvoyFilter 리소스로 attribute-gen 플러그인을 구성하는 방법을 살펴보자.
cat ch7/metrics/attribute-gen.yaml
apiVersion: networking.istio.io/v1alpha3
kind: EnvoyFilter
metadata:
  name: attribute-gen-example
  namespace: istioinaction
spec:
  configPatches:
  ## Sidecar Outbound
  - applyTo: HTTP_FILTER
    match:
      context: SIDECAR_OUTBOUND
      listener:
        filterChain:
          filter:
            name: envoy.filters.network.http_connection_manager
            subFilter:
              name: istio.stats
      proxy:
        proxyVersion: ^1\.13.*
    patch:
      operation: INSERT_BEFORE
      value:
        name: istio.attributegen
        typed_config:
          '@type': type.googleapis.com/udpa.type.v1.TypedStruct
          type_url: type.googleapis.com/envoy.extensions.filters.http.wasm.v3.Wasm
          value:
            config:
              configuration:
                '@type': type.googleapis.com/google.protobuf.StringValue
                value: |
                  {
                    "attributes": [
                      {
                        "output_attribute": "istio_operationId", # 속성 이름
                        "match": [
                         {
                           "value": "getitems", # 속성 값
                           "condition": "request.url_path == '/items' && request.method == 'GET'"
                         },
                         {
                           "value": "createitem",
                           "condition": "request.url_path == '/items' && request.method == 'POST'"
                         },
                         {
                           "value": "deleteitem",
                           "condition": "request.url_path == '/items' && request.method == 'DELETE'"
                         }
                       ]
                      }
                    ]
                  }
              vm_config:
                code:
                  local:
                    inline_string: envoy.wasm.attributegen
                runtime: envoy.wasm.runtime.null
이 설정은 기본 속성 몇 가지를 조합해서 특정 종류의 호출을 식별할 수 있는 istio_operationId 라는 새 속성을 만들어낸다.
attribute-gen 플러그인을 webapp 서비스의 아웃바운드 호출에 추가해 catalog 서비스의 /items 로 향햐는 호출을 추적한다.
- 아래 attribute-gen.yaml 을 적용하기 전에 proxyVersion: ^1.16.* 을 설치된 istio 버전에 맞게 1.16 혹은 1.17 로 수정.
#
docker exec -it myk8s-control-plane istioctl version
client version: 1.17.8
control plane version: 1.17.8
data plane version: 1.17.8 (4 proxies)
#
vi ch7/metrics/attribute-gen.yaml # 혹은 open ch7/metrics/attribute-gen.yaml 후 수정
...
proxy:
proxyVersion: ^1\.17.* # 수정
...
# 버전을 수정 후 envoyfilter 를 배포합니다. envoyfilter를 배포한 네임스페이스의 istio-proxy들에 적용 됩니다
kubectl apply -f ch7/metrics/attribute-gen.yaml -n istioinaction
# 확인
kubectl get envoyfilter -n istioinaction -o yaml | kubectl neat
kubectl get envoyfilter -n istioinaction
NAME AGE
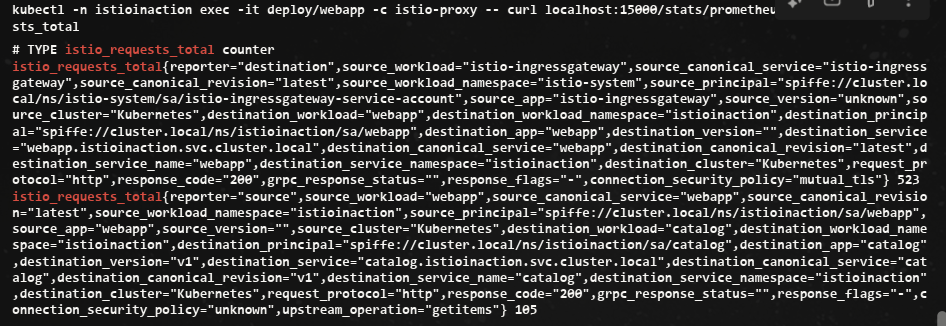
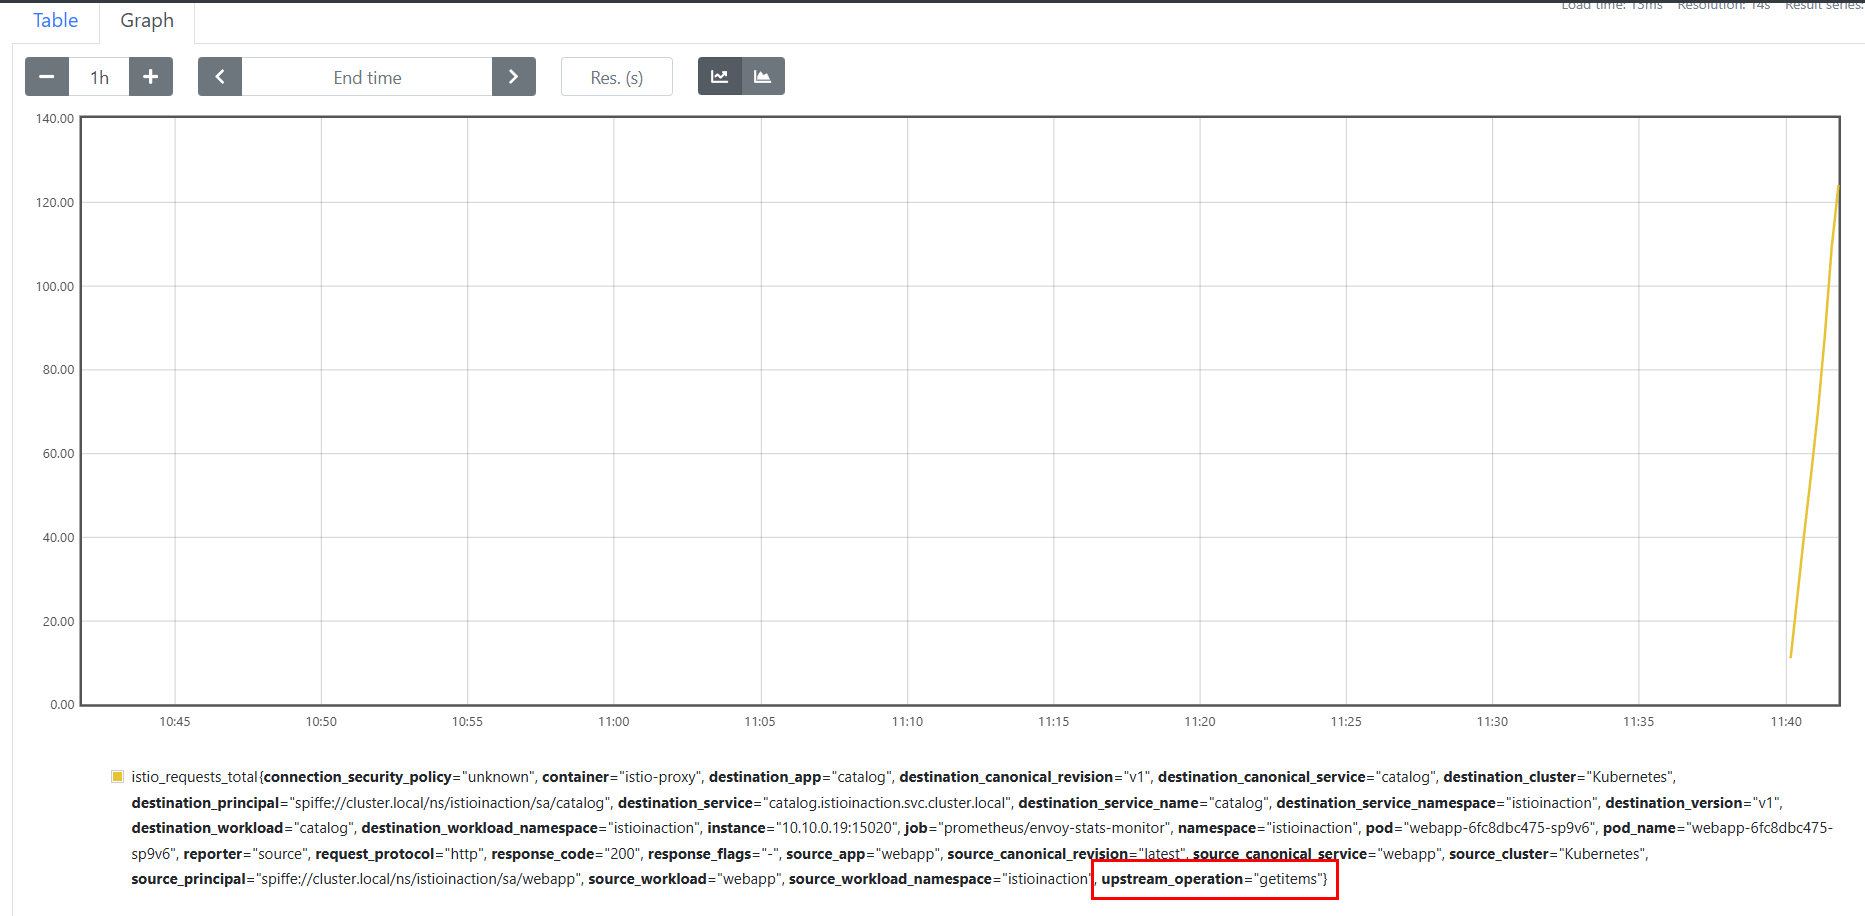
attribute-gen-example 12s- catalog 에 대한 API 호출을 식별하기 위해 istio_request_total 메트릭 안에 이 속성을 사용하는 새 디멘션 upstream_operator 을 추가할 것이다.
- stats 플러그인 설정을 업데이트 하자.
# 설정 적용
docker exec -it myk8s-control-plane bash
----------------------------------------
cat << EOF > istio-operator-new-attribute.yaml
apiVersion: install.istio.io/v1alpha1
kind: IstioOperator
spec:
  profile: demo
  values:
    telemetry:
      v2:
        prometheus:
          configOverride:
            outboundSidecar:
              metrics:
              - name: requests_total
                dimensions:
                  upstream_operation: istio_operationId # 새 디멘션
EOF
istioctl verify-install -f istio-operator-new-attribute.yaml # 리소스별로 적용결과를 출력
istioctl install -f istio-operator-new-attribute.yaml -y

exit
----------------------------------------

# 확인 : outboundSidecar 에만 적용됨
kubectl get istiooperator -n istio-system installed-state -o yaml | grep -B2 -A1 istio_operationId$
              metrics:
              - dimensions:
                  upstream_operation: istio_operationId
                name: requests_total

#
kubectl get envoyfilter -n istio-system stats-filter-1.17 -o yaml | kubectl neat
...
spec:
  configPatches:
  - applyTo: HTTP_FILTER
    match:
      context: SIDECAR_OUTBOUND
      listener:
        filterChain:
          filter:
            name: envoy.filters.network.http_connection_manager
            subFilter:
              name: envoy.filters.http.router
      proxy:
        proxyVersion: ^1\.17.*
    patch:
      operation: INSERT_BEFORE
      value:
        name: istio.stats
        typed_config:
          '@type': type.googleapis.com/udpa.type.v1.TypedStruct
          type_url: type.googleapis.com/stats.PluginConfig
          value:
            metrics:
            - dimensions:
                upstream_operation: istio_operationId
              name: requests_total
...

kubectl get envoyfilter -n istio-system stats-filter-1.16 -o yaml | grep istio_operationId -B15 -A5
kubectl get envoyfilter -n istio-system stats-filter-1.15 -o yaml | grep istio_operationId -B15 -A5
kubectl get envoyfilter -n istio-system stats-filter-1.14 -o yaml | grep istio_operationId -B15 -A5
kubectl get envoyfilter -n istio-system stats-filter-1.13 -o yaml | grep istio_operationId -B15 -A5
...
- 호출 후 확인
- 애플리케이션 간에 네트워크를 통한 통신이 늘어날수록 문제가 발생할 가능성이 더 높아진다는 것을 알아야 한다.
- 누가 애플리케이션을 작성했든, 무슨 언어를 사용했든 상관없이 서비스 간에 무슨 일이 일어나고 있는지에 한결같은 시야를 갖는 것은 마이크로서비스 스타일 아키텍처를 운영하는 데 필수 조건이나 마찬가지다.
- 이스티오는 서비스 간 메트릭 수집을 더 쉽게 만드는데, 개발자가 애플리케이션에 명시적으로 코딩하지 않아도 성공률, 실패율, 재시도 횟수, 지연 시간 등을 관찰하기 때문이다.
- 이들은 분명히 필요하며, 이스티오는 다만 황금 신호 네트워크 메트릭 수집을 간편하게 만들 뿐이다. (구글 SRE 책은 지연 시간, 처리량, 오류, 포화도를 황금 신호 메트릭으로 지칭한다)
Summary
- 모니터링은 알려진 바람직하지 않은 상태를 관찰하기 위해 메트릭를 수집하고 집계하여 수정 조치를 취할 수 있도록 하는 과정입니다.
- Monitoring is the process of collecting and aggregating metrics to watch for known undesirable states so that corrective measures can be taken.
- Istio는 사이드카 프록시에서 요청을 가로챌 때 모니터링에 사용되는 메트릭을 수집합니다. 프록시는 7계층(애플리케이션 네트워킹 계층)에서 작동하기 때문에 메트릭에 사용할 수 있는 상태 코드, HTTP 메서드, 헤더 등 다양한 정보에 액세스할 수 있습니다.
- Istio collects the metrics used for monitoring when intercepting requests in the sidecar proxy. Because the proxy acts at layer 7 (the application-networking layer), it has access to a great deal of information such as status codes, HTTP methods, and headers that can be used in metrics.
- 핵심 지표 중 하나는 istio_requests_total로, 요청을 카운트하고 상태 코드 200으로 끝나는 요청 수와 같은 질문에 답합니다.
- One of the key metrics is istio_requests_total, which counts requests and answers questions such as how many requests ended with status code 200.
- 프록시에 의해 노출된 지표는 관측 가능한 시스템을 구축하는 기초를 마련합니다.
- The metrics exposed by the proxies set the foundation to build an observable system.
- 메트릭 수집 시스템은 프록시에서 노출된 메트릭을 수집하고 집계합니다.
- Metrics-collection systems collect and aggregate the exposed metrics from the proxies.
- 기본적으로 Istio는 프록시가 제한된 통계 집합만 표시하도록 구성합니다. meshConfig .defaultConfig를 사용하거나 주석 proxy.istio .io/config를 사용하여 워크로드 단위로 더 많은 메쉬 전체를 보고하도록 프록시를 구성할 수 있습니다.
- By default, Istio configures the proxies to expose only a limited set of statistics. You can configure the proxies to report more mesh-wide using the meshConfig .defaultConfig or on a per-workload basis using the annotation proxy.istio .io/config.
- 컨트롤 플레인에는 성능에 대한 지표도 표시됩니다. 가장 중요한 것은 프록시에 변경 사항을 배포하는 데 걸리는 시간을 측정하는 히스토그램 파일럿_proxy_convergence_time입니다.
- The control plane also exposes metrics for its performance. The most important is the histogram pilot_proxy_convergence_time, which measures the time taken to distribute changes to the proxies.
- IstioOperator를 사용하여 Istio에서 사용할 수 있는 메트릭을 사용자 지정하고 프록시 구성을 정의하는 주석 proxy.istio.io/config 에서 extraStats 값을 설정하여 서비스에 사용할 수 있습니다. 이러한 수준의 제어는 운영자(최종 사용자)가 스크래핑되는 원격 측정과 대시보드에 표시하는 방법에 대한 유연성을 제공합니다.
- We can customize the metrics available in Istio using the IstioOperator and use them in services by setting the extraStats value in the annotation proxy.istio.io/config that defines the proxy configuration. This level of control gives the operator (end user) flexibility over what telemetry gets scraped and how to present it in dashboards.
