
Simple Linear Regression
Importing the libraries
import pandas as pd
import numpy as np
import matplotlib.pyplot as plt
Importing the dataset
dataset = pd.read_csv('Salary_Data.csv')
X = dataset.iloc[:, :-1].values
y = dataset.iloc[:, -1].values
Splitting the dataset into the Training set and Test set
from sklearn.model_selection import train_test_split
X_train, X_test, y_train, y_test = train_test_split(X, y, test_size = 0.2, random_state = 0)
Training the Simple Linear Regression model on the Training set
회귀 : 급여와같이 연속적인 실제 값을 예측하는 경우 (분류는 범주나 클래스를 예측)
# 단순선형회귀모델
from sklearn.linear_model import LinearRegression
regressor = LinearRegression()
regressor.fit(X_train, y_train)	#선형 회귀 모델을 훈련
fit 메서드는 모델을 데이터에 적합시카며, X_train은 훈련 데이터의 입력 변수(특성), y_train은 해당 입력 변수에 대한 출력 변수(목표값)
훈련이 완료되면 regressor 객체는 학습된 선형 회귀 모델을 가지게 됨
Predicting the Test set result
y_pred = regressor.predict(X_test)** X_test는 테스트 데이터의 입력 변수
주어진 입력 데이터인 X_test에 대한 예측을 생성해 y_pred 변수에 할당
y_pred에는 테스트 데이터X_test에 대한 모델의 예측값이 포함됨
Visualising the Training set results
plt.scatter(X_train, y_train, color='red'
plt.plot(X_train, regressor.predict(X_train), color='blue')
plt.title("Salary vs Experience (Training set)")
plt.xlabel('Years of Experience")
plt.ylabel('Salary')
plt.show()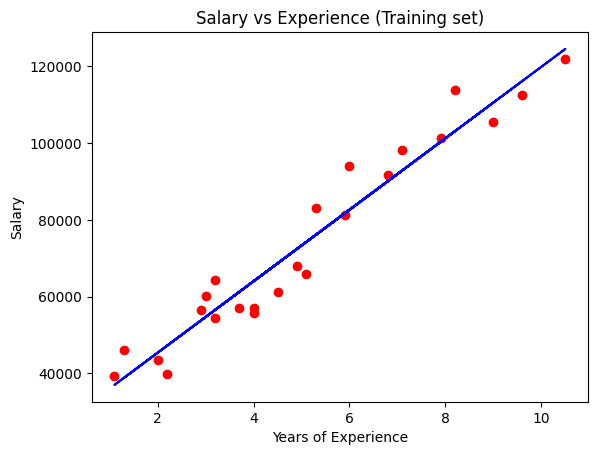
Visualising the Test set results
plt.scatter(X_test, y_test, color='red')
plt.plot(X_train, regressor.predict(X_train), color='blue')
plt.title("Salary vs Experience (Test set)")
plt.xlabel('Years of Experience')
plt.ylabel('Salary')
plt.show()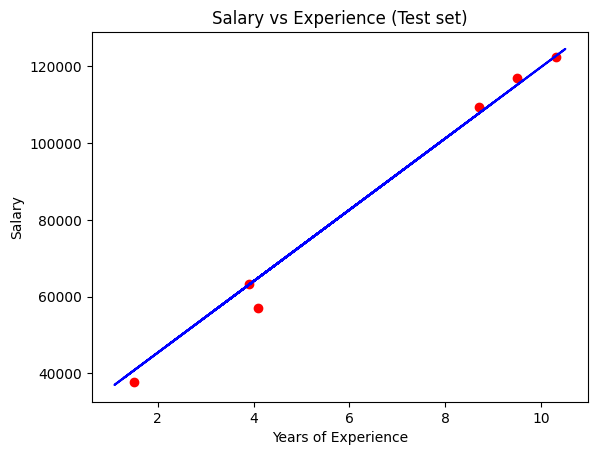

그래도 해야지