
💡 Classification Evaluation
Accuracy
- Definition
- Accuracy = Number of data points with matching predictions / Total number of predictions
- Accuracy is an intuitive metric for evaluating model performance. However, in binary classification, the composition of the data can distort the model's performance. Therefore, performance is not assessed solely based on the accuracy metric.
- Especially, accuracy is not an appropriate metric for evaluating model performance when dealing with imbalanced label distributions.
- Problems
- In the case of , there is only one positive data point to be predicted. However, even without creating a model and arbitrarily predicting all as 0, the accuracy will still be 90%.
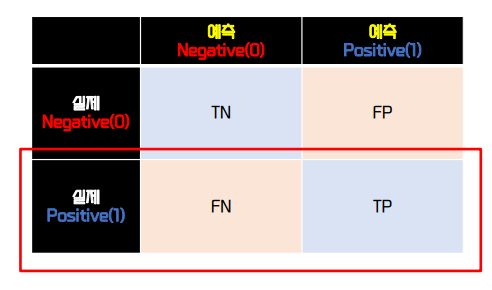
Confusion Matrix
- Definition : A metric that shows not only the prediction error in binary classification but also the types of prediction errors occurring
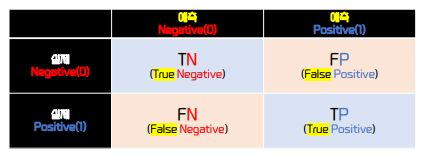
- TN(True Negative) : Correctly predict a Negative as Negative
- FN(False Negative) : Incorrectly predict a Positive as Negative
- FP(False Positive) : Incorrectly predict a Negative as Positive
- TP(True Positive) : Correctly predict a Positive as Positive
Precision
- Definition : The ratio of data points predicted as Positive where both the prediction and actual value are Positive -> Incorrectly predicting a Negative as Positive lowers precision
- formula: Precision = TP/(FP+TP)
Recall
- Definition : The ratio of data points with actual Positive values where both the prediction and actual value are Positive -> Incorrectly predicting a Positive as Negative lowers recall
- formula : Recall = TP/(FN+TP)
Precision and Recall
- Cases where recall is a relatively more important metric : When incorrectly predicting actual Positive data as Negative can have significant business impacts ex) cancer diagnosis, fraud detection, etc
- Cases where precision is a relatively more important metric : When incorrectly predicting actual Negative data as Positive can have significant business impacts ex) spam email detection
- Precision and Recall Trade-off : The adjustment of the threshold can increase either Precision or Recall, but since they are complementary metrics, forcing one to increase usually causes the other to decrease. This is known as the Trade-off between Precision and Recall
Threshold
- Definition : Classification decision threshold
- Lowering the threshold increases the probability of predicting Positive -> Thus, the probability of incorrectly predicting Negative decreases, leading to an increase in recall

- Increasing the threshold increases the probability of predicting Negative -> Thus, the probability of incorrectly predicting Positive decreases, leading to an increase in precision

- Lowering the threshold increases the probability of predicting Positive -> Thus, the probability of incorrectly predicting Negative decreases, leading to an increase in recall
F1 Score
- Definition : A metric that combines Precision and Recall, achieving relatively high values when neither is skewed
- Formula
ROC/AOC
ROC Curve (Receiver Operation Characteristic Curve)
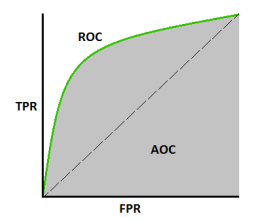
- TPR (True Positive Rate) : Recall = TP/(FN+TP)
- FPR (False Positive Rate) : The ratio of Negatives incorrectly predicted as Positives, FPR = FP/(FP+TN)
- ROC curve : The curve that shows how the TPR changes as the FPR varies
- AUC score : The area under the ROC curve (AUC-ROC) is used as a performance metric for classification. Generally, the closer the value is to 1 (with the curve's apex near the top left corner), the better the performance
Threshold with TPR, FPR
- Setting the threshold to 0 makes all predictions by the model Positive
- Since FN is 0, TPR becomes 1
- Since TN is also 0, FPR becomes 1
- Setting the threshold to 1 makes all predictions by the model Negative
- Since TP is 0, TPR becomes 0
- Since FP is 0, FPR becomes 0
- Gradually increasing the threshold from 0, a good AUC is obtained when FPR drops relatively quickly while TPR holds up before falling

Data Analysis