
*이렇게 분석을 해보니 영화보다 더 영화같고, 감동스러운 포인트들까지도 읽혀졌다..찌잉...ㅠㅠ
* 분명히 matplot과 seaborn을 활용한 다양한 시각화 라이브러리를 저번에도 다룬 것 같은데 왜 이렇게 낯선지 모르겠다. 이렇게 복습해야할 것들이 점점 늘어난다📚
* 하나의 엑셀 파일일 뿐인데 알아 낼 수 있는게 너무 많았다.(넘흐 흥미로와) 적은 리소스라도 최대의 결과를 뽑아내는 것도 중요하다는걸 몸소 깨우치게 됐다.✏️ EDA
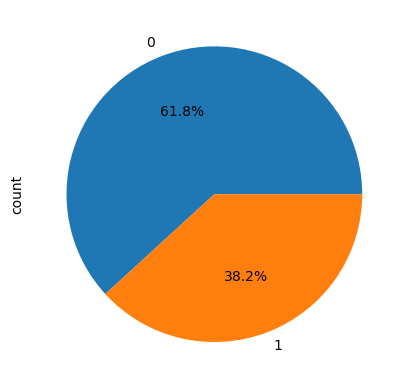
💡 생존률 (38.2%)
autopct='%1.1f%%': 소수점 첫째자리까지 비율 표시
titanic['survived'].value_counts().plot.pie(autopct='%1.1f%%')out>>
f,ax = plt.subplots(1,2,figsize=(16,8)) #1행 2열

titanic['survived'].value_counts().plot.pie(ax=ax[0],autopct='%1.1f%%',shadow=True, explode=[0,0.05])
ax[0].set_title('Pie plot - survived')
ax[0].set_ylabel('')

sns.countplot(x='survived',data=titanic,ax=ax[1])
ax[1].set_title('Count plot = survived')

plt.show()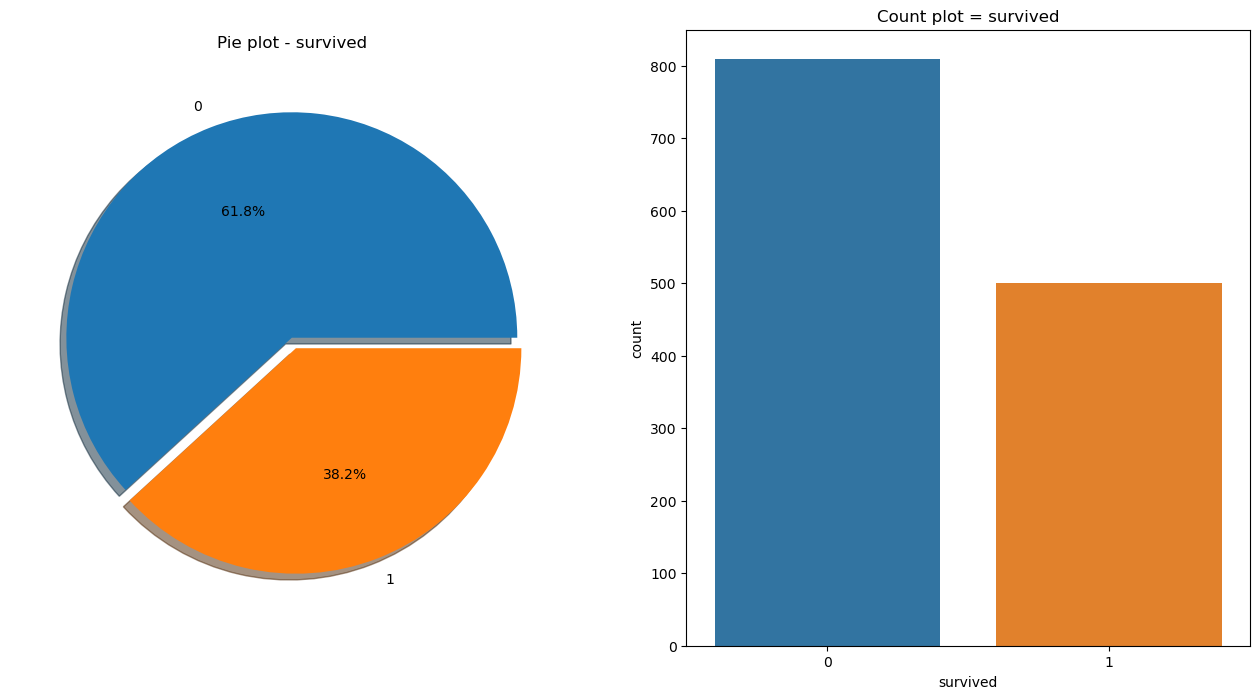
💡 성별에 따른 생존 상황
: 남성의 생존 가능성이 더 낮다.
f,ax = plt.subplots(1,2,figsize=(16,8)) #1행 2열

titanic['sex'].value_counts().plot.pie(ax=ax[0],autopct='%1.1f%%',shadow=True, explode=[0,0.05])
ax[0].set_title('Pie plot - Count of passengers of sex')
ax[0].set_ylabel('')

sns.countplot(x='sex',data=titanic,hue='survived',ax=ax[1])
ax[1].set_title('Count plot = sex : survived')

plt.show()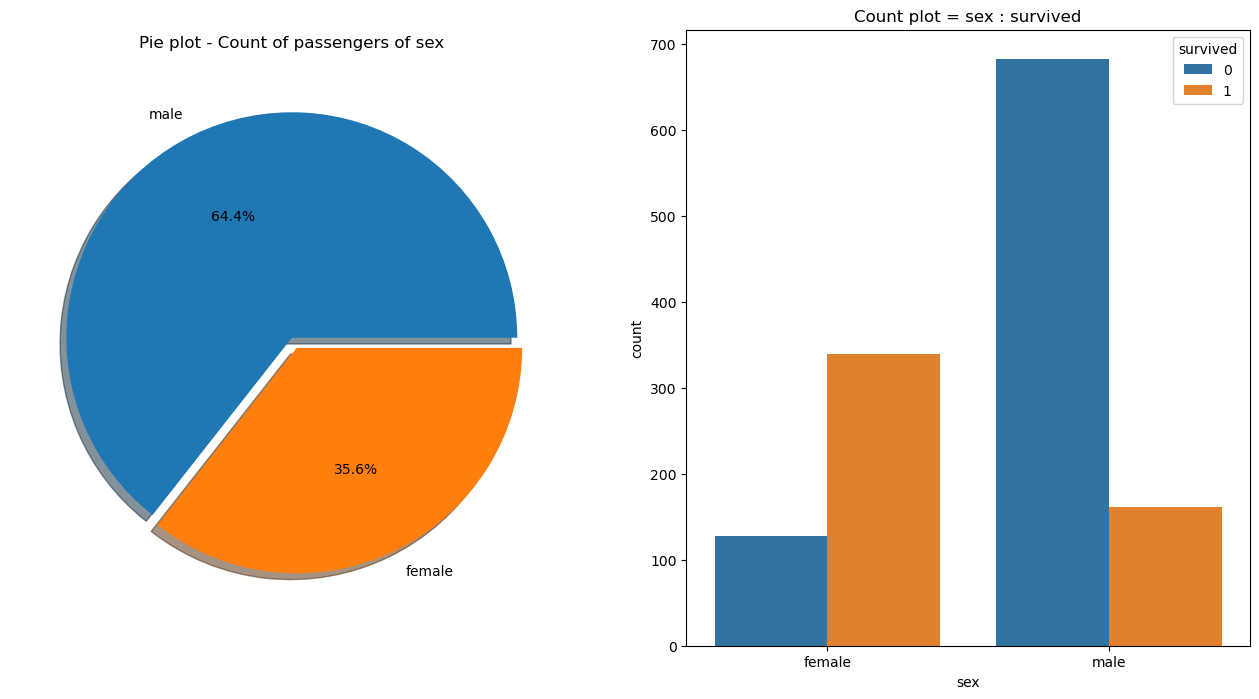
💡 좌석 등급 대비 생존률
- 1등실일수록 생존 가능성이 높음
- 여성의 생존률이 높음
=> 여성들은 1등실에 많이 타고 있었는가?
pd.crosstab(titanic['pclass'],titanic['survived'],margins=True) #margins : 합계
💡 등급 & 성별 관계 (기준 : 나이)
grid=sns.FacetGrid(titanic, row='pclass',col='sex', height=4,aspect=2)
grid.map(plt.hist,'age', alpha=0.8, bins=20) # alpha : 투명도
grid.add_legend()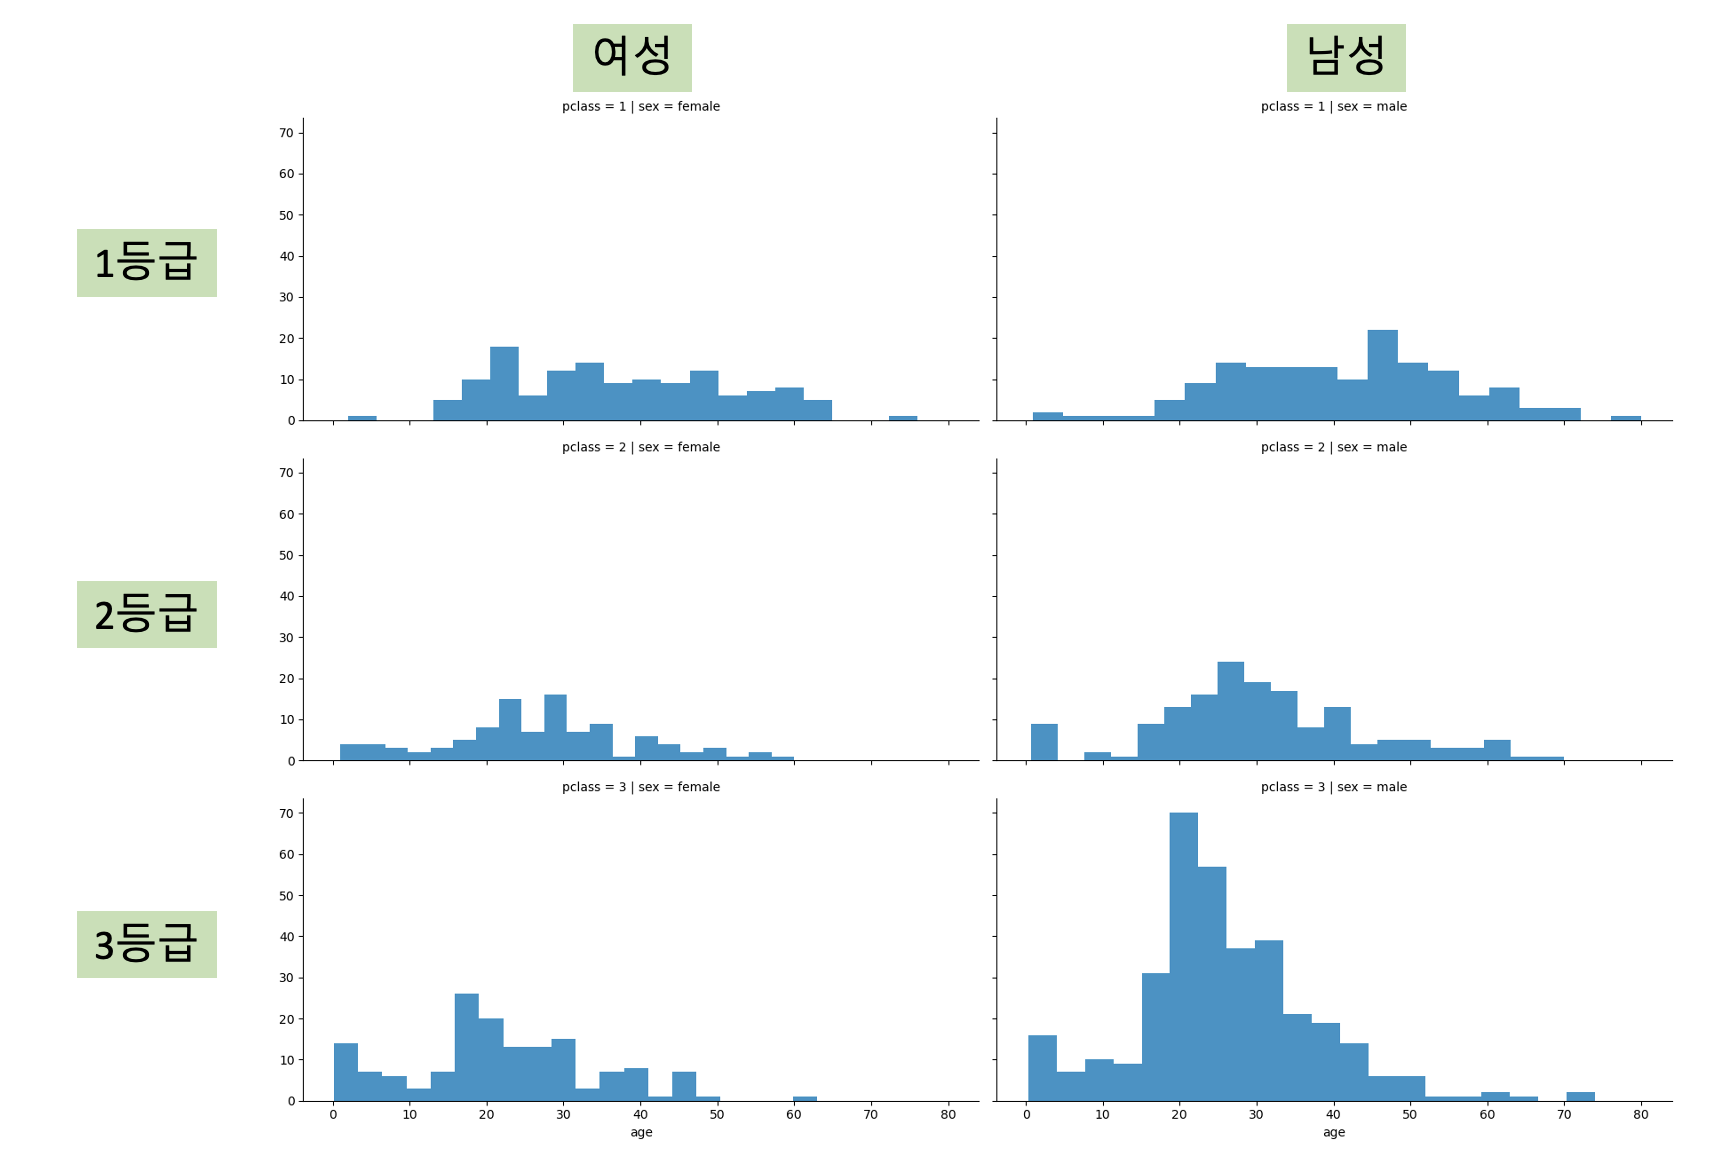
<<틈새 정리 - 시각화 라이브러리>>
_matplotlib
: 파이썬으로 기본적인 차트들을 쉽게 그릴 수 있도록 도와주는 시각화 라이브러리

_seaborn
: matplotlib 기반으로 만들어진 통계 데이터 시각화 라이브러리
💡 나이별 승객 현황
import plotly.express as px
fig=px.histogram(titanic,x='age')
fig.show()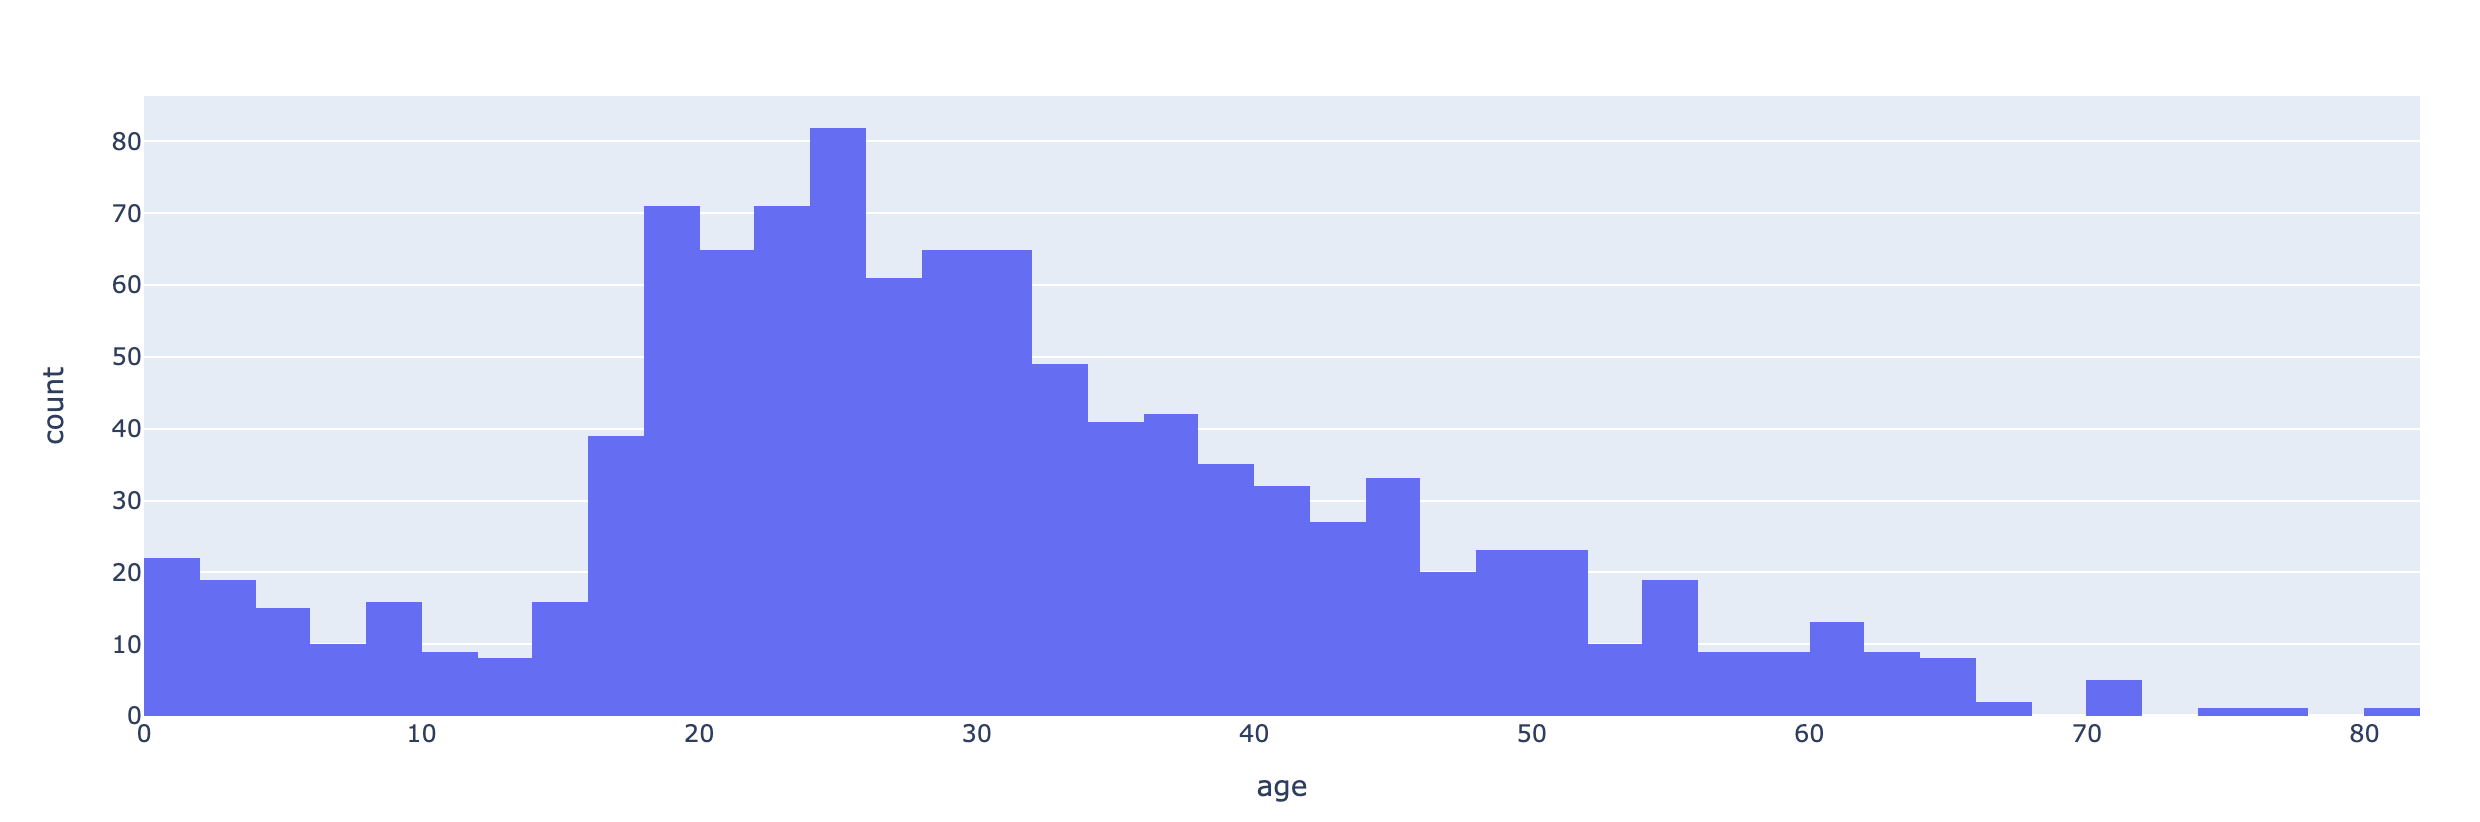
💡 등실별 생존율
grid=sns.FacetGrid(titanic, row='pclass',col='survived', height=4,aspect=2)
grid.map(plt.hist,'age', alpha=0.5, bins=20) # alpha : 투명도
grid.add_legend()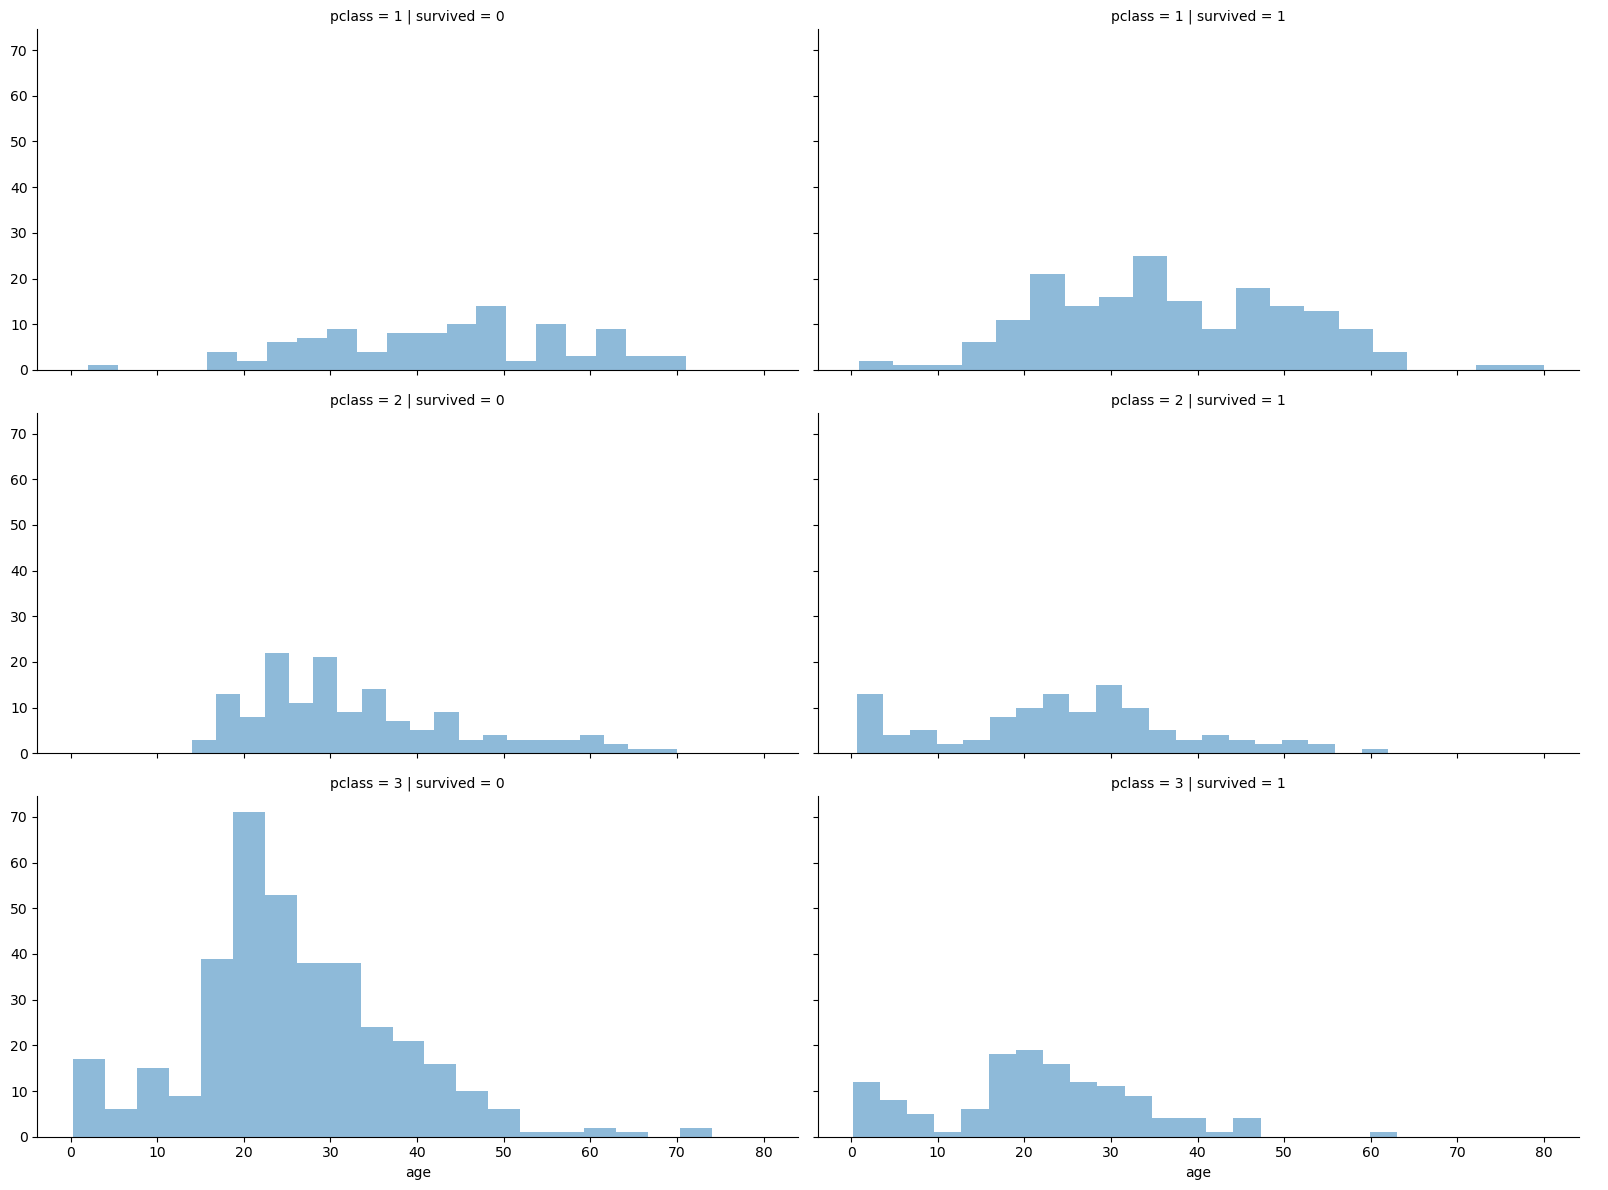
💡 연령 5단계로 구분하기
#새로운 컬럼 추가하기
titanic['age_cat']=pd.cut(titanic['age'], bins=[0,7,15,30,60,100],
include_lowest=True,
labels=['baby','teen','young','adult','old'])
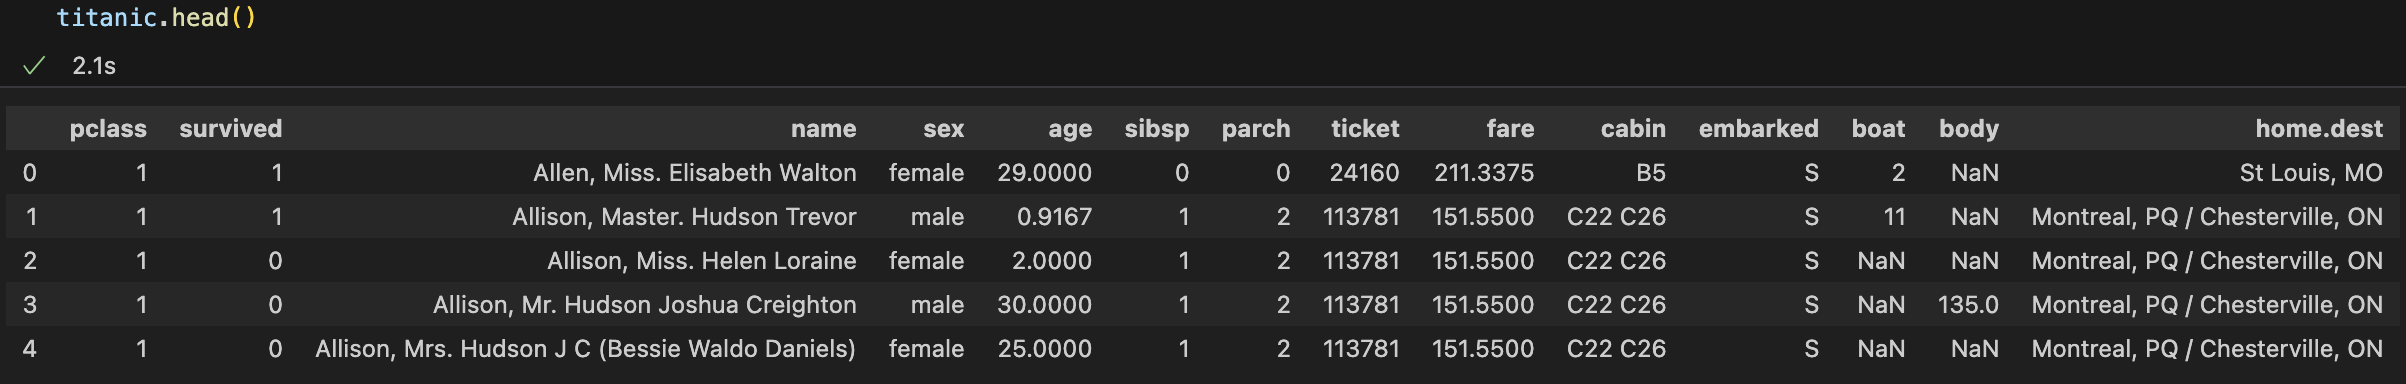
titanic.head()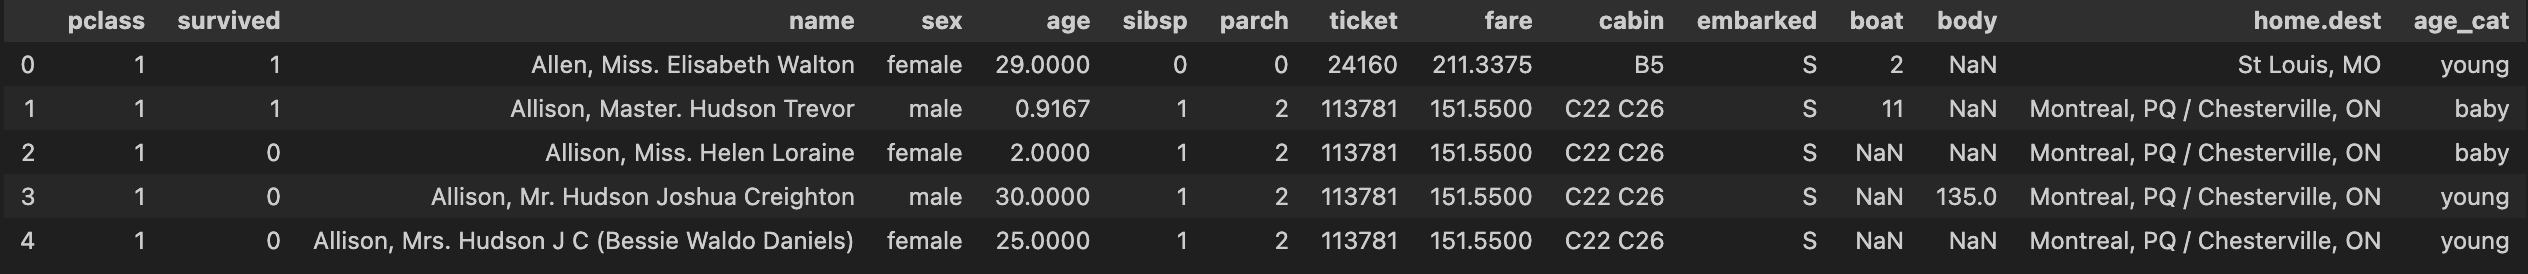
💡 나이, 성별, 등급별로 생존율
: 1로 갈수록 생존
plt.figure(figsize=(14,6))

plt.subplot(131) #1행 3열 중 1번째
sns.barplot(x='pclass',y='survived',data=titanic)

plt.subplot(132) #1행 3열 중 2번째
sns.barplot(x='age_cat',y='survived',data=titanic)

plt.subplot(133) #1행 3열 중 3번째
sns.barplot(x='sex',y='survived',data=titanic)

plt.show()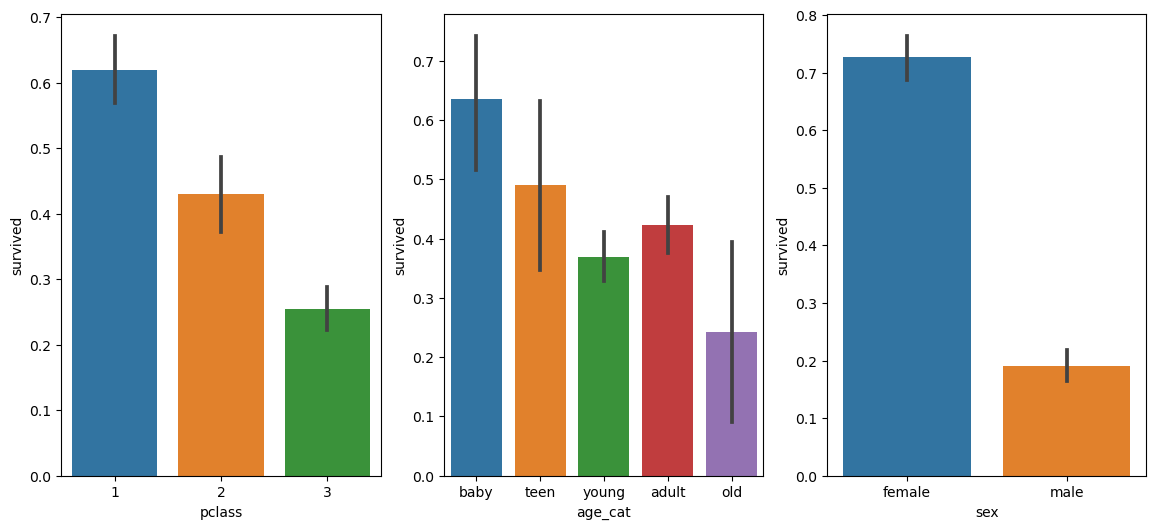
fig,axes = plt.subplots(nrows=1, ncols=2, figsize=(14,6))

women = titanic[titanic['sex']=='female'] #이거 자체가 df 형태
men = titanic[titanic['sex']=='male'] #이거 자체가 df 형태

ax = sns.distplot(women[women['survived']==1]['age'], bins=20,  #women[women['survived']==1] : 여성 'survived'컬럼이 1인 df중에서 ['age'] 데이터만
                  label ='survived', ax = axes[0],kde=False)
ax = sns.distplot(women[women['survived']==0]['age'], bins=40,
                  label ='not_survived', ax = axes[0],kde=False)
ax.legend() ; ax. set_title('Female')

ax = sns.distplot(men[men['survived']==1]['age'], bins=18,
                  label ='survived', ax = axes[1],kde=False)
ax = sns.distplot(men[men['survived']==0]['age'], bins=40,
                  label ='not_survived', ax = axes[1],kde=False)
ax.legend() ; ax. set_title('male')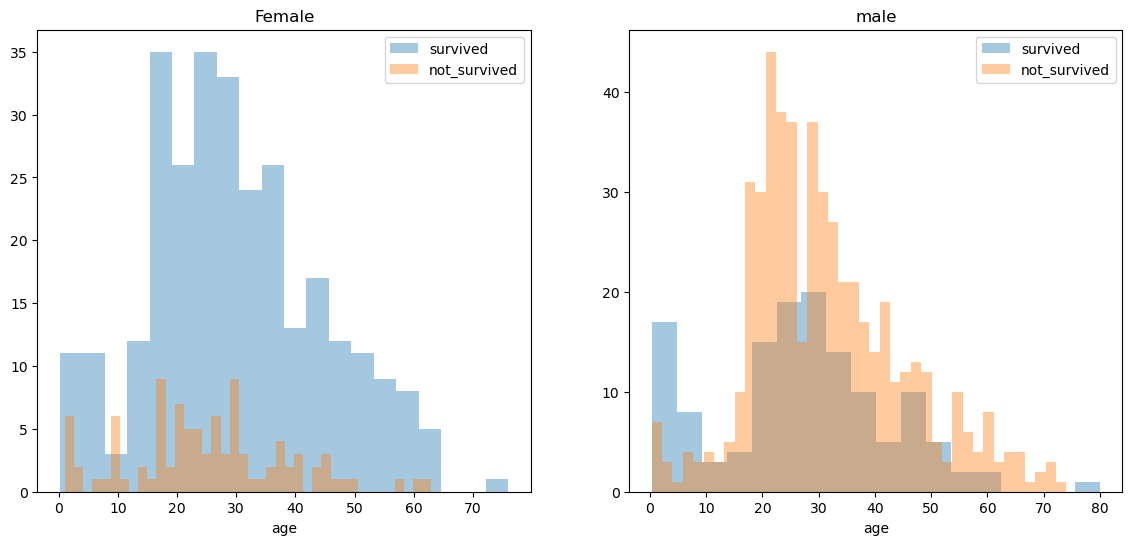
💡 이름으로 신분 확인하기
import re
for idx, dataset in titanic.iterrows():
    tmp = dataset['name']
    print(re.search('\,\s\w+(\s\w+)?\.',tmp).group())
    # '\,\s\w+(\s\w+)?\.' : \,: ,로 시작,
    #                       \s: 한 칸을 비움,
    #                       \w+ : 어떤 단어들이 여러개 나옴
    #                       (\s\w+)? : (공백 + 어떤 단어) 가 없을수도 있고, 있을수도 있고
    #                       \. : .로 끝남
    # 대상 : tmp

out>>
, Miss.
, Master.
, Miss.
, Mr.
, Mrs. ...
import re
title=[]
for idx, dataset in titanic.iterrows():
tmp = dataset['name']
condition = re.search('\,\s\w+(\s\w+)?\.',tmp).group()
title.append(condition[2 : -1]) #, Miss.에서 ,부터 0, .전 : -1
title
out>>
['Miss',
'Master',
'Miss',
'Mr', ...]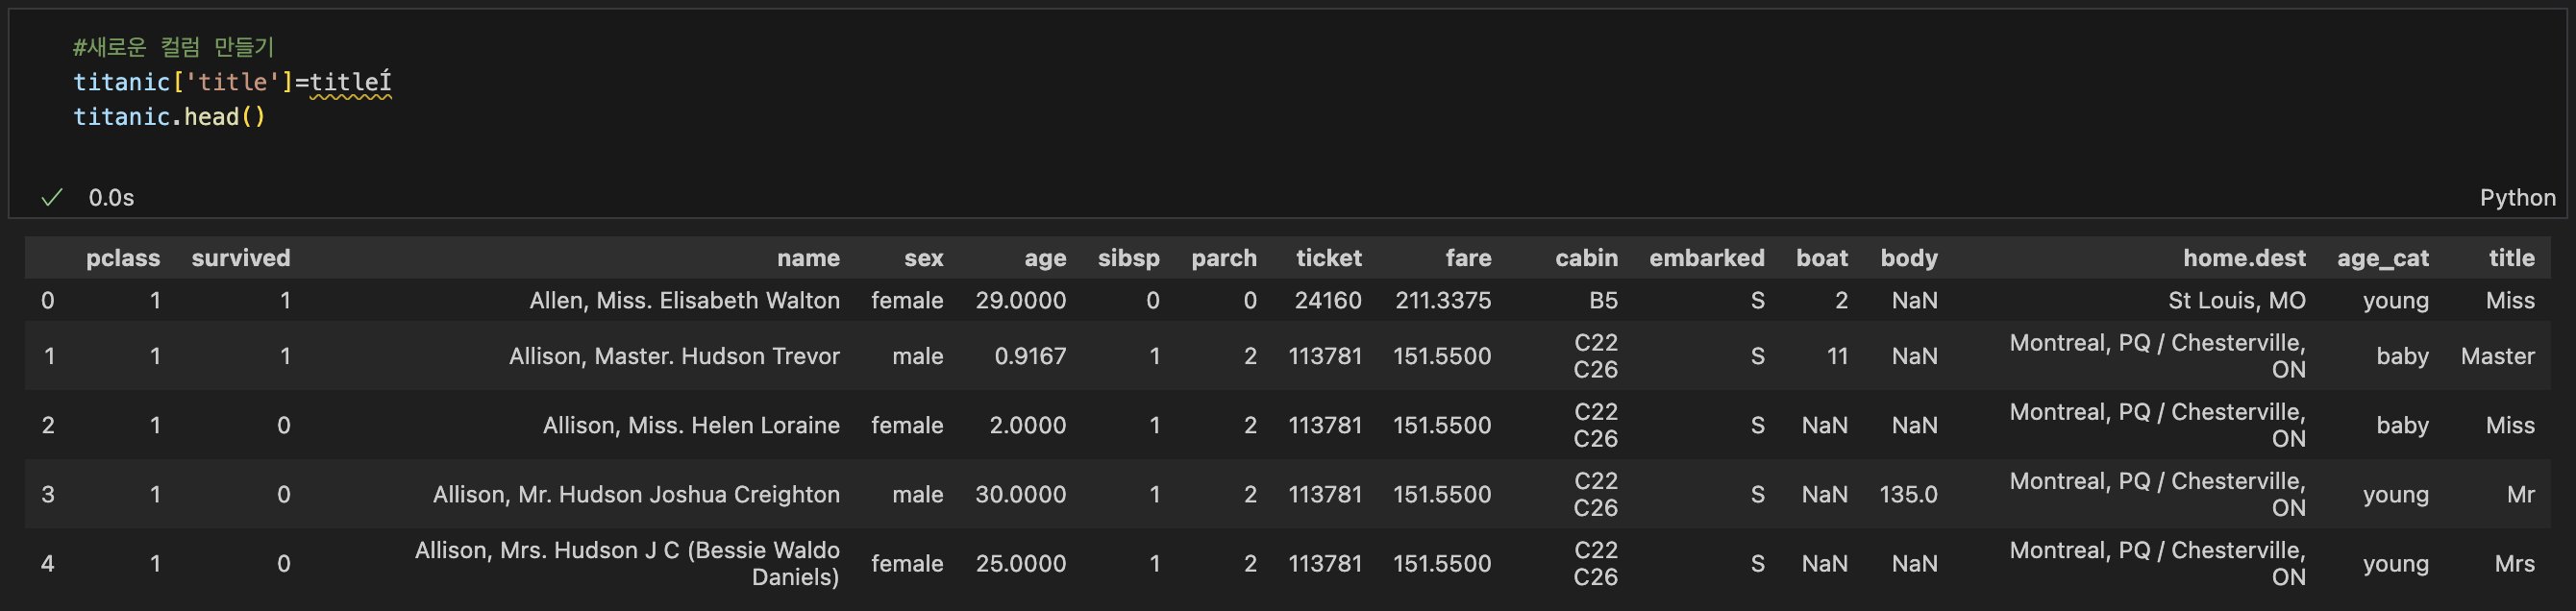
✏️ 머신러닝
✏️ 출처
"제로베이스 데이터 취업 스쿨" 강의

데린이인데요 ໒꒰ྀ ˶ • ༝ •˶ ꒱ྀིა (잘못 된 부분은 너그러이 알려주세요.)