✏️ Numpy
💡 Numpy란
- 참고자료 : Numpy 기초 함수 끝장내기 | 파이썬 프로그래밍
- Numerical Python의 줄임말
- 파이썬 패키지 중 하나
- 데이터 구조 외에도 수치 계산을 위해 효율적으로 구현된 기능을 제공
- 데이터 분석에 있어 판다스와 함께 자주 사용되는 패키지
💡 Numpy 장점
- NumPy에서 배열 및 벡터를 표현하는 핵심 구조인 ndarray를 사용하여 빠르고 메모리를 효율적으로 사용
- 반복문을 작성할 필요 없이 전체 데이터 배열에 대해 빠른 연산을 제공하는 다양한 표준 수학 함수를 제공
💡 Numpy 형식
import numpy as np💡 np.array()
- numpy의 기본 배열 생성 메서드
- 기타 배열 메서드
np.zeors(2)
np.ones(2)
np.arange(4)

# 출력코드
# array([0., 0.])
# array([1., 1.])
# array([0, 1, 2, 3])
💡 np.linespace(a,b,c)
- a와 b 사이의 c개 값들을 추출
💡 np.polyfit(a,b,c)
- 최소 제곱을 갖는 다항식 피팅 (least squares polynomial fit)을 반환
💡 np.poly1d(a)
- 다항식 함수를 반환
💡 np.pi()
- 원주율값 return (3.141592653589793)
💡 np.sin() / np.cos() / np.tan()
✏️ 예제
💡 Numpy를 이용한 경향(trend) 찾기
- np.polyfit() :직선을 구성하기 위한 계수를 계산
- np.poly1d() : polyfit으로 찾은 계수를 파이썬에서 사용할 수 있는 함수로 만들어주는 기능
- np.linspace(a,b,n) : a부터 b까지 s개의 등간격 데이터 생성
# 지난 수업 (서울 CCTV 자료) 이어서
import numpy as np

fp1=np.polyfit(dataResult["인구수"],dataResult["소계"],1)
f1=np.poly1d(fp1)  # 경향(trend)
fx= np.linspace(100000,700000,100) #10만~70만 범위에서 100개
# fpl 결과값 : array([1.11155868e-03, 1.06515745e+03])
# f1 결과값 : poly1d([1.11155868e-03, 1.06515745e+03])
# f1(400000) 결과값 (40만 인구에서 서울시 경향에 맞는 CCTV 수는?) : 1509.7809252413335

def drawGraph():
    plt.figure(figsize=(14,10))
    plt.scatter(dataResult["인구수"],dataResult["소계"], s=50)
    plt.plot(fx, f1(fx), ls="dashed", lw=3, color="green")  #이 부분의 경향 line
    plt.xlabel("인구수")
    plt.ylabel("CCTV")
    plt.grid(True)
    plt.show()

drawGraph()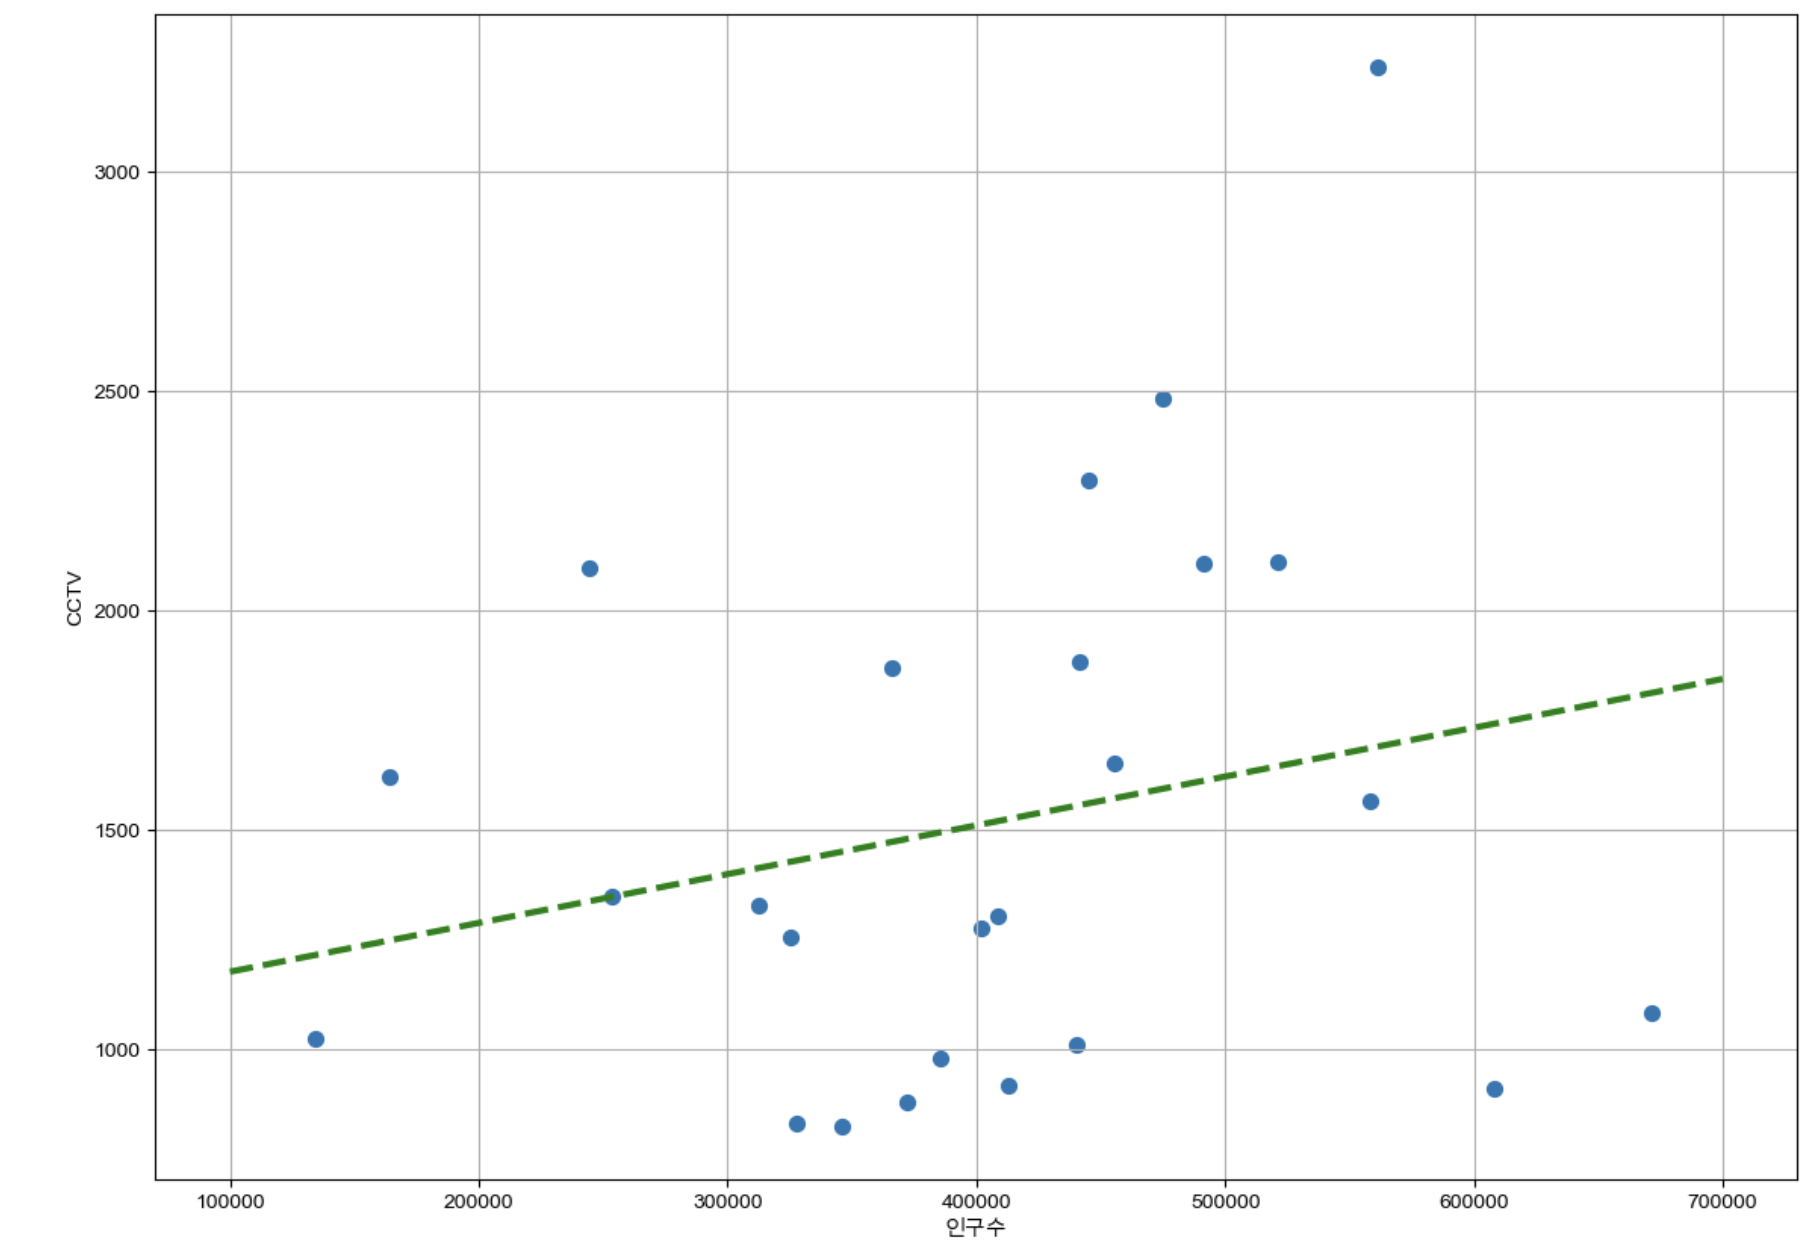
💡 오차
-
오차 구하기
- 위 자료에서 오차 컬럼 추가해서 값 구하고 정렬
dataResult["오차"]=dataResult["소계"]-f1(dataResult["인구수"])
df_sort_f=dataResult.sort_values(by="오차", ascending=False) # 내림차순
df_sort_t=dataResult.sort_values(by="오차", ascending=True) # 오름차순
df_sort_t.head(3)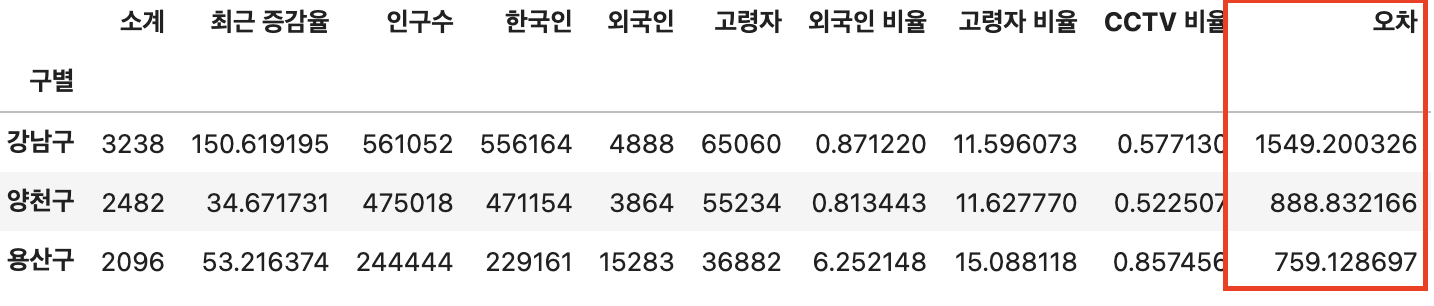
- 위 자료에서 오차 컬럼 추가해서 값 구하고 정렬
-
오차 구별하기
- 서브 패키지(matplolib.colors - ListedColormap) 사용
from matplotlib.colors import ListedColormap #colormap을 사용자가 컬러 지정하기 colorStep = ["#e74c3c","#2ecc71","#95a5a6","#2ecc71","#3498db",""#3498db"] myCmap=ListedColormap(colorStep) -
그래프 코드 입력하기
- c= : 어떤것을 기준 삼아서 색상을 입힐건지
- cmap= : 활용할 컬러
- .text(변수[컬럼 a][인덱스 숫자] n(도트와 글자 사이 간격),변수[컬럼 b][인덱스 숫자] 변수.index[인덱스 숫자]. fontsize = m)
: scatter dot 좌표에 맞춰 인덱스 명 입력하기
def drawGraph():
    plt.figure(figsize=(14,10))
    plt.scatter(dataResult["인구수"],dataResult["소계"], s=50, c=dataResult["오차"], cmap=myCmap)
    plt.plot(fx, f1(fx), ls="dashed", lw=3, color="green")  #이 부분의 경향 line

    #상위, 하위 5개만 도트에 인덱스 명 붙히기
    for n in range(5):
    	#상위 5개
    	plt.text(df_sort_f["인구수"][n]* 1, #x좌표
        df_sort_f["소계"][n]* 1,   #y좌표
        df_sort_f.index[n])

        #하위 5개
        plt.text(df_sort_t["인구수"][n]* 1, #x좌표
        df_sort_t["소계"][n]* 1,   #y좌표
        df_sort_t.index[n])

    plt.xlabel("인구수")
    plt.ylabel("CCTV")
    plt.colorbar()
    plt.grid(True)
    plt.show()

drawGraph()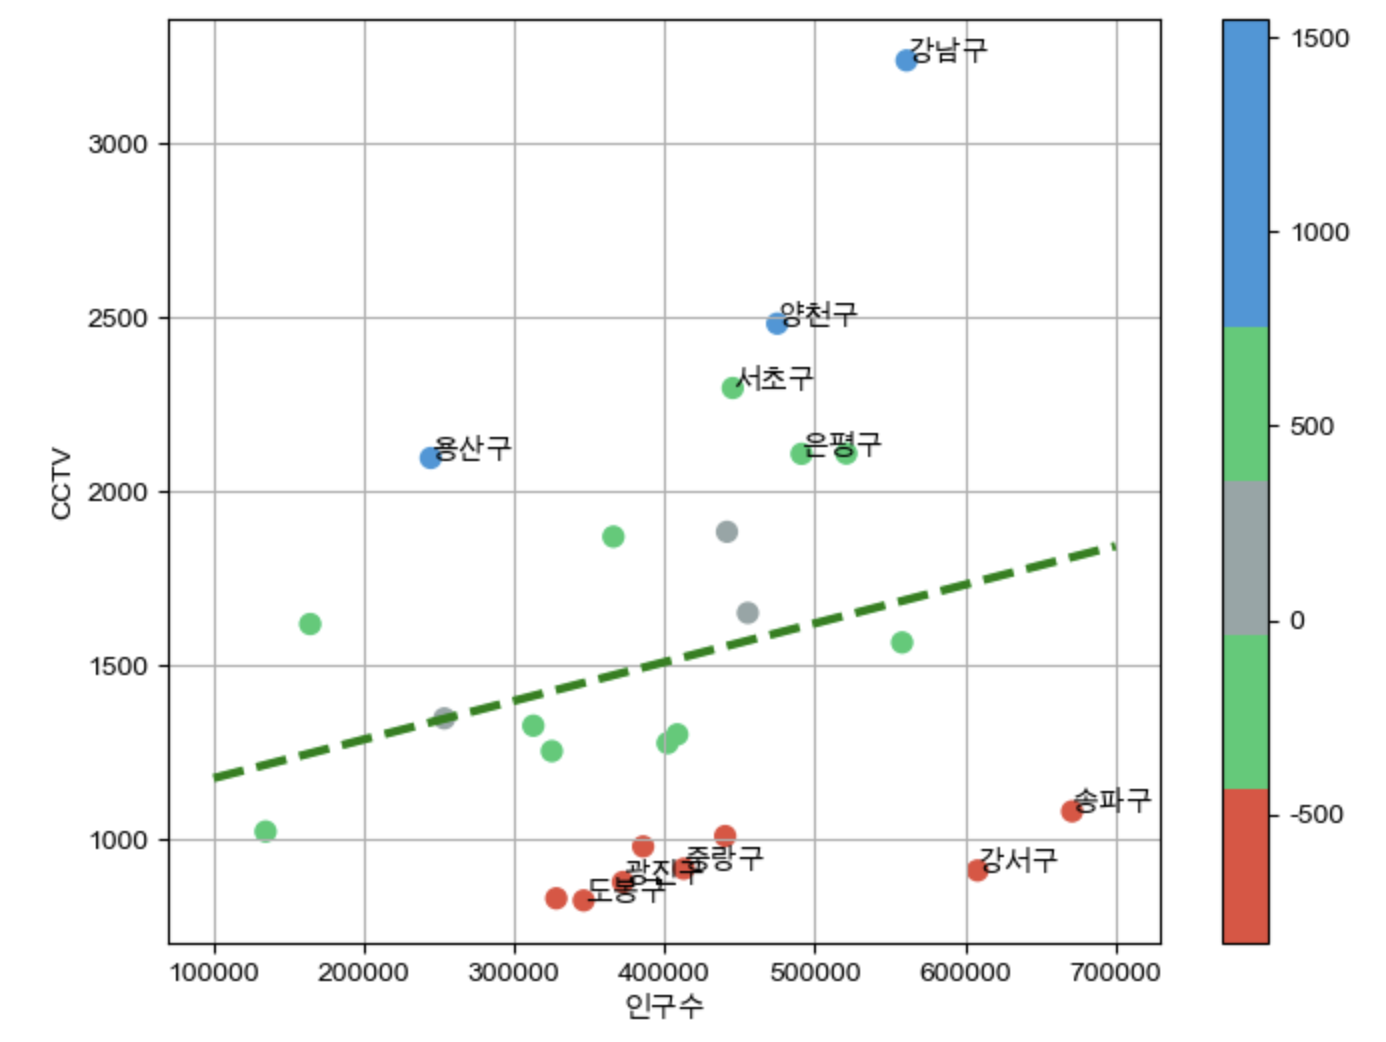

데린이인데요 ໒꒰ྀ ˶ • ༝ •˶ ꒱ྀིა (잘못 된 부분은 너그러이 알려주세요.)