<어제복습>
-
test1 <- data.frame(id=c(1,2,3,4,5), midterm=c(60,80,70,90,85))
칼럼 mid 바꿔서 올려주세요. -
반 데이터 1등 점수는
class %>% summarize(first=max(score))
class |> arrange(desc(score)) |>
head(1) |> select(score)
summarise를 단독으로 쓰지말라. group_by랑 같이 써라.
<결측치,이상치>
Tidy data:가지런한 데이터
구글링:cheatsheet(시험쪽지) -dplyr
is.na(df): 결측치 확인
table(is.na(df)):결측치 빈도 출력
mean(df$score):평균 산출
df %>% filter(is.na(score)):score가 na인 데이터만 출력.
df%>%filter(!is.na(score)):score 결측치 제거.
결측치(na):nac 쓸수 없다.
결측치가 몇개가 있나. is.na(df) 값 T,F로 나옴.
table:갯수를 세줌.
na,rm:na를 지워죠.
alt:자리옮김
alt+shift:한줄복사
df <- filter(is.na(score)):score가 na를 골랐다.
#airquality
#1.na가 모두 몇개 있습니까?
#2.어느 칼럼에 몇 개가 있습니까?
#3.평균 오존농도는?(mean)
#답:
summary(airquality)
ozone,solar.R 37/7
mean(airquality$Ozone,na.rm = T)
[1] 42.12931
na를 빼고 계산해줘요 뺀상태에 평균을 구하고 그 뒤 집어넣는다.
이상치:(outlier),이상한 수치.(평균치 이상의 수치)
상자수염그림(구글링하기)으로 이상치 확인
4분기,25%씩 2분기=중앙값
IQR:Inttr,1~3분기 사이. iqr*1.5배 앞,뒤 까지 정상치, 14%(7,7):이상치
outlier <- data.frame(sex=c(1,2,1,3,2,1),score=c(5,4,3,4,2,6))
table(outlierscore)
outlier <- data.frame(sex=c(1,2,1,3,2,1),score=c(5,4,3,4,2,6))
table(outlier$sex)
1 2 3
3 2 1
table(outlier$score)
2 3 4 5 6
1 1 2 1 1
outliersex==3,NA,outlier$sex)
outlier$sex
[1] 1 2 1 NA 2 1
outlier |> filter(!is.na(sex)&!is.na(score)) |>
group_by(sex) |> summarise(mean_score=mean(score))
outlier |> filter(!is.na(sex)&!is.na(score)) |>
- group_by(sex) |> summarise(mean_score=mean(score))
#A tibble: 2 × 2
sex mean_score
1 1 3
2 2 3
na.omit(outlier) |>
group_by(sex) |>
summarise(평균=mean(score))
outlier |> filter(!is,na(sex)) |>
group_by(sex) |>
summarise(평균=mean(score, na.rm=T))
boxplot(mpg$hwy) #상자 그림 통계치 출력
mpghwy <- 12|mpghwy )
table(is.na(mpg$hwy )):
mpghwy <- 12|mpghwy )
table(is.na(mpg$hwy ))
TRUE
234
#drv별로 고속도로연비의hwy 평균값을 알고싶다. 이상치는 제외하고.
이상치는?
boxplot(mpg$hwy)
입력되는 형태가 데이터프레임 인지 이미지 인지 알아야함.
mpg |> select(hwy) |> arrange(desc((hwy)) |> head
mpg |> select(drv,hwy) |> filter(hwy <41& hwy>12) |> group_by(drv) |> summarise(평균=mean(hwy))
mpg |> select(drv,hwy) |> filter(hwy <41& hwy>12) |> group_by(drv) |> summarise(평균=mean(hwy))
#A tibble: 3 × 2
drv 평균
1 4 19.5
2 f 27.7
3 r 21
mpg |> group_by(drv) |> summarise(mean_hwwy=mean(hwy,na.rm=T))
mpg |> group_by(drv) |> summarise(mean_hwwy=mean(hwy,na.rm=T))
#A tibble: 3 × 2
drv mean_hwwy
1 4 19.2
2 f 28.2
3 r 21
<ggplog2 그래픽 패키지>
더 다양한 시각화:
cheatsheat 사용! (ggplot2 cheatsheat 검색)
- plotly는 Interactive 그래프를 그려주는 라이브러리임.
- Scala, R, Python, Javascript, MATLAB 등에서 사용할 수 있슴.
- 시각화를 위해 D3.js를 사용하고 있슴.
- 사용해보면 사용이 쉽고, 세련된 느낌을 받는다.
[1]평면세팅
ggplot(data= ,aes(x= ,y= ))
<주요 함수>
. ggplot(data = 데이터 셋명) : 데이터를 불러오는 역할
. mapping = aes(x = , y = ) : x축, y축의 꾸미기로 사용한다
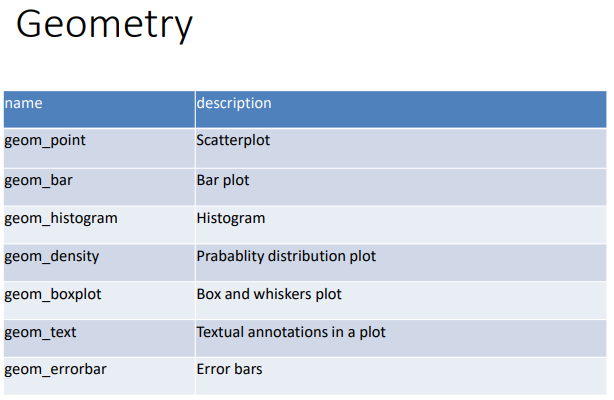
. geom_function() : 어떤 그래프를 그릴지 정하는 함수
. mapping = aes(항목1=값1, 항목2=값2)
: geom_function() 의 옵션으로 꾸미기로 사용한다.
. position(x, y), color(색상), fill(채우기), shape(모양), linetype(선 형태), size(크기) 등
[2]도형선택
<산점도 – 변수 간 관계 표현하기>
ggplot(data = , aes( x = , y = ) ) + geom_points + xlim( , ) + ylim( , )
- (1)배경설정(축)
: ggplot(data=mpg ,aes(x=displ ,y=hwy )) - (2)배경에서 산점도 추가
: ggplot(data=mpg ,aes(x=displ ,y=hwy ))+geom_point() - (3)x축 범위 3~6으로 지정
: ggplot(data=mpg ,aes(x=displ ,y=hwy ))+geom_point()+xlim(3,6) - (4)y축 범위 10~30으로 지정
: ggplot(data=mpg ,aes(x=displ ,y=hwy ))+geom_point()+xlim(3,6)+ylim(10,30)
=ggplot(mpg, aes(displ, hwy)+geom_point()+xlim(3,6)+ylim(10,30)
<결과값>

-범주형, 카테고리, 백터형 factor=category-
str(mpg)
#point,geom_boxplot()dplyr::glimpse(mpg)
#::뜻 : 패키지 라이브러리 안하고 한번만 쓸때 사용.
# glimpse():칼럼이 길면 행으로 표현됨.
head(mpg)

#연속성 변수일 때 컬러
- ggplot(data=mpg ,aes(x=displ ,y=hwy,color=cty))+geom_point(size=2)

*숫자는 그라데이션으로 표현됨(큰숫자:연하고,작으면:찐해짐) #범주형 변수일 때 컬러
- ggplot(data=mpg ,aes(x=displ ,y=hwy,color=drv))+geom_point(size=2)

#스스로 3가지 색 배치함.#aes()는 geom_point 에도 매길 수 있어요
-
ggplot(mpg ,aes(x=displ ,y=hwy ,
color=class))+geom_point()#원본,color는 aes의 컬러이다. -
ggplot(mpg ,aes(x=displ ,y=hwy )+geom_point(
aes(color=class))#위에꺼랑 같은 말 / aes(color=class)!!
#패키지 알아보기
-
ggplot(mpg ,aes(x=displ ,y=hwy ,
color="red"))+geom_point()
#위에꺼 안나오고 밑에꺼 됨.
-
ggplot(mpg ,aes(x=displ ,y=hwy ))+geom_point(
color="red")
코드를 재사용하기 쉽게
- p <- ggplot(dat= mpg ,aes(x=displ ,y=hwy ))
- p + geom_point(aes(color=class))
- q <- geom_point(aes(color=class))
... p + q
-
geom_test, geom_errorbar는 잘 사용 안함.
-
ggplot(mpg, aes(y=hwy,))+geom_boxplot()
#박스플롯은 한개의 와이만 되는것도 있음. 두개의 변수도 가능.
-
ggplot(data=mpg,aes(x=class, y=hwy,fill=class))+geom_boxplot()

#이상값 찾기
Q.1)ggplot(mpg,aes(drv,hwy))+geom_boxplot()
f형의 하위 이상값 회사명 제품 알아보기.

패키지 알아보기 ???
-
ggplot(mpg ,aes(x=displ ,y=hwy ,
color="red"))+geom_point()#위에꺼 안나오고 밑에꺼 됨.
-
ggplot(mpg ,aes(x=displ ,y=hwy ))+geom_point(
color="red")

<그래프 차이점>
- ggplot(mpg ,aes(x=displ ,y=hwy ))+
geom_smooth(method = lm)

- ggplot(mpg ,aes(x=displ ,y=hwy ,
color=drv))+geom_point()+geom_smooth():부드럽게표현

- ggplot(mpg ,aes(x=displ ,y=hwy ,color=drv))+geom_point()+
geom_smooth(method="lm"):직선표시

[테마]
<+theme_()>
(1)theme_dark()
- ggplot(mpg ,aes(x=displ ,y=hwy ,color=drv))+geom_point()+geom_smooth(method="lm")+
theme_dark()

(2)theme_economist()
- ggplot(mpg ,aes(x=displ ,y=hwy ,color=drv))+geom_point()+geom_smooth(method="lm")+
theme_economist()

(3)theme_wsj()
- ggplot(mpg ,aes(x=displ ,y=hwy ))+geom_point()+geom_smooth(method="lm")+
theme_wsj()

(4)theme_bw()
-
ggplot(mpg ,aes(x=displ ,y=hwy ))+geom_point()+geom_smooth(method="lm")+
theme_bw()#또는 ?them_bw

(5)theme_classic()
- ggplot(mpg ,aes(x=displ ,y=hwy ))+geom_point()+geom_smooth(method="lm")+
theme_classic()

