Linear Regression :: Linear Regression with sklearn
boston data를 활용하여 scikit-learn에서 제공하는 linear regression을 사용하여 실제로 Y값을 예측하는 코드를 작성하는 방법
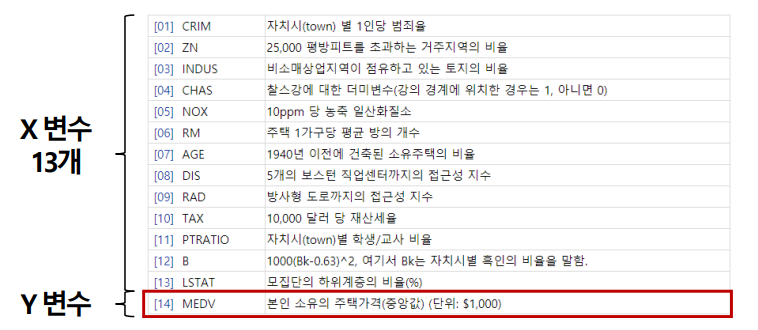
Boston House Price Dataset
-
머신러닝 등 데이터분석을 처음 배울 때, 가장 대표적으로 사용하는 Example Dataset
-
1978년에 발표된 데이터로, 미국 인구통계 조사 결과 미국 보스턴 지역의 주택 가격에 영향을 미친 요소들을 정리함

https://archive.ics.uci.edu/ml/datasets/Housing
데이터 로딩
from sklearn.datasets import load_boston
import matplotlib.pyplot as plt
import numpy as np
boston = load_boston()
boston["data"] array([[6.3200e-03, 1.8000e+01, 2.3100e+00, ..., 1.5300e+01, 3.9690e+02,
4.9800e+00],
[2.7310e-02, 0.0000e+00, 7.0700e+00, ..., 1.7800e+01, 3.9690e+02,
9.1400e+00],
[2.7290e-02, 0.0000e+00, 7.0700e+00, ..., 1.7800e+01, 3.9283e+02,
4.0300e+00],
...,
[6.0760e-02, 0.0000e+00, 1.1930e+01, ..., 2.1000e+01, 3.9690e+02,
5.6400e+00],
[1.0959e-01, 0.0000e+00, 1.1930e+01, ..., 2.1000e+01, 3.9345e+02,
6.4800e+00],
[4.7410e-02, 0.0000e+00, 1.1930e+01, ..., 2.1000e+01, 3.9690e+02,
7.8800e+00]])
x_data = boston.data
y_data = boston.target.reshape(boston.target.size, 1)y_data.shape(506, 1)
x_data[:3] array([[6.3200e-03, 1.8000e+01, 2.3100e+00, 0.0000e+00, 5.3800e-01,
6.5750e+00, 6.5200e+01, 4.0900e+00, 1.0000e+00, 2.9600e+02,
1.5300e+01, 3.9690e+02, 4.9800e+00],
[2.7310e-02, 0.0000e+00, 7.0700e+00, 0.0000e+00, 4.6900e-01,
6.4210e+00, 7.8900e+01, 4.9671e+00, 2.0000e+00, 2.4200e+02,
1.7800e+01, 3.9690e+02, 9.1400e+00],
[2.7290e-02, 0.0000e+00, 7.0700e+00, 0.0000e+00, 4.6900e-01,
7.1850e+00, 6.1100e+01, 4.9671e+00, 2.0000e+00, 2.4200e+02,
1.7800e+01, 3.9283e+02, 4.0300e+00]])
데이터 스케일링
from sklearn import preprocessing

minmax_scale = preprocessing.MinMaxScaler().fit(x_data)
# standard_scale = preprocessing.StandardScaler().fit(x_data)
x_scaled_data = minmax_scale.transform(x_data)

x_scaled_data[:3]
array([[0.00000000e+00, 1.80000000e-01, 6.78152493e-02, 0.00000000e+00,
3.14814815e-01, 5.77505269e-01, 6.41606591e-01, 2.69203139e-01,
0.00000000e+00, 2.08015267e-01, 2.87234043e-01, 1.00000000e+00,
8.96799117e-02],
[2.35922539e-04, 0.00000000e+00, 2.42302053e-01, 0.00000000e+00,
1.72839506e-01, 5.47997701e-01, 7.82698249e-01, 3.48961980e-01,
4.34782609e-02, 1.04961832e-01, 5.53191489e-01, 1.00000000e+00,
2.04470199e-01],
[2.35697744e-04, 0.00000000e+00, 2.42302053e-01, 0.00000000e+00,
1.72839506e-01, 6.94385898e-01, 5.99382080e-01, 3.48961980e-01,
4.34782609e-02, 1.04961832e-01, 5.53191489e-01, 9.89737254e-01,
6.34657837e-02]])
Train - Test Split
from sklearn.model_selection import train_test_split

X_train, X_test, y_train, y_test = train_test_split(x_scaled_data, y_data, test_size=0.33)X_train.shape, X_test.shape, y_train.shape, y_test.shape((339, 13), (167, 13), (339, 1), (167, 1))
Linear regression fitting
from sklearn import linear_model

regr = linear_model.LinearRegression(fit_intercept=True, normalize=False, copy_X=True, n_jobs=1)
regr.fit(x_scaled_data, y_data)

regr
LinearRegression(n_jobs=1)
# # The coefficients
print('Coefficients: ', regr.coef_)
print('intercept: ', regr.intercept_)
Coefficients: [[ -9.60975755 4.64204584 0.56083933 2.68673382 -8.63457306
19.88368651 0.06721501 -16.22666104 7.03913802 -6.46332721
-8.95582398 3.69282735 -19.01724361]]
intercept: [26.62026758]

수식 결과비교
regr.predict(x_data[0].reshape(1, -1))array([[-496.63540908]])
x_data[0].dot(regr.coef_.T) + regr.intercept_array([-496.63540908])
Metric 측정
from sklearn.metrics import r2_score
from sklearn.metrics import mean_absolute_error
from sklearn.metrics import mean_squared_error
y_true = y_test
y_hat = regr.predict(X_test)
r2_score(y_true, y_hat), mean_absolute_error(y_true, y_hat), mean_squared_error(y_true, y_hat)(0.748336752104465, 3.2828674717048387, 22.5102209338545)
y_true = y_train
y_hat = regr.predict(X_train)

r2_score(y_true, y_hat), mean_absolute_error(y_true, y_hat), mean_squared_error(y_true, y_hat)
(0.7364106098215966, 3.2649490104449903, 21.59167457817485)
