
  const nameList = ['CPM0000'];
  const defaultDataList = nameList.map((name) => ({
    name: name,
    data: [],
  }));

  const [dataList, setDataList] = React.useState(defaultDataList);

  useUpdateEffect(() => {
    console.log('rvsArr', rvsArr, 'Date', date.getSeconds());
//rvsArr이라는 배열안의 값들을 하나하나 가공해서 원하는 값으로 덮어씌우기
 let copyArr = rvsArr.map((r) => {
      return (r = { x: date, y: r });
      //return {...r, r:{ x: date, y: r}}
    });
원래 r은 숫자인데 오브젝트로 변환

    console.log('copyArr', copyArr);
    //dataList[0].data?.concat(copyArr);

    interval(copyArr);
    //insertChartXY(rvsArr);
  }, [rvsArr]);

  const interval = (rvsArr) => {
    rvsArr.map((r) => {
      setDataList(
        dataList.map((val) => {
          return {
            name: val.name,
            data: insertChartXY(val.data, r),
          };
        }),
      );
    });
  };

  // const interval = (rvsArr) => {
  //   setDataList(
  //     dataList.map((val) => {
  //       return {
  //         name: val.name,
  //         data: insertChartXY(val.data, rvsArr),
  //       };
  //     })
  //   );
  // };

  const insertChartXY = (xyData, r) => {
    if (dataList[0]?.data?.length === 50) {
      console.log('꽉 참');
      //return [...xyData.slice(1)];
      return (xyData = xyData.filter((n, index) => {
        return index > 10;
      }));
    } else {
      console.log('여기서 추가', r);
      return [...xyData, r];
      //return (xyData = rvsAr.concat(xyData));
    }
  };

  // const insertChartXY = (xyData, rvsAr) => {
  //   if (dataList[0]?.data?.length === 15) {
  //     console.log("꽉 참");
  //     //return [...xyData.slice(0, 5)];
  //     return (xyData = xyData.filter((n, index) => {
  //       return index > 4;
  //     }));
  //   } else {
  //     console.log("여기서 rvs 배열 인덱스만큼 추가");
  //     return (xyData = xyData.concat(rvsAr));
  //     //return (xyData = rvsAr.concat(xyData));
  //   }
  // };

  // const insertChartXY = (xyData, rvsAr) => {
  //   rvsAr.map((r) => {
  //     if (dataList[0]?.data?.length === 50) {
  //       console.log("꽉 참");
  //       //return [...xyData.slice(1)];
  //     } else {
  //       console.log("여기서 추가");
  //       return [
  //         ...xyData,
  //         {
  //           x: date.getSeconds(),
  //           y: r,
  //         },
  //       ];
  //     }
  //   });
  // };
A라는 Map 안의 또 다른 배열 변수의 Map을 돌려서, return 하는 것이 불가능한 것 같다. 콘솔은 정상적으로 찍히는데, return은 상위만 먹히는 것 같다. 마지막 값만 반영해주네.. 그래서 상위에서 스플릿을 할때 변수를 하나씩 set 해줘서 인자를 전달하도록 짰다.
import React, { useEffect, useState } from "react";
import { StyledFont, StyledLineCss, StyledCharjsLine } from "./style";
import { useDispatch, useSelector } from "react-redux";
import { PatientRequestAction } from "./../store/reducers/patient";
import useUpdateEffect from "../store/hooks/useUpdateEffect";
import dynamic from "next/dynamic";
const ReactApexChart = dynamic(() => import("react-apexcharts"), {
ssr: false,
});
import RealTimeLineChart from "./RealTimeLineChart";
const LineChart = (props) => {
const now = new Date();
const [tv, setTv] = useState(null);
const [mv, setMv] = useState(null);
const [rr, setRr] = useState(null);
const [spo2, setSpo2] = useState(null);
const [rvsArr, setRvsArr] = useState(null);
const { d, eventSource } = props;
const TIME_RANGE_IN_MILLISECONDS = 30 * 1000;
// const [ID, setID] = useState(null);
// const [Age, setAge] = useState(null);
const [ResultData, setResultData] = useState(null);
const nameList = [d];
const defaultDataList = nameList.map((name) => ({
name: name,
data: [],
}));
let i = 1;
const [dataList, setDataList] = React.useState(defaultDataList);
const clasfy = (measureData) => {
switch (measureData?.parame) {
case "mv":
setMv(measureData?.value);
break;
case "rr":
setRr(measureData?.value);
break;
case "rvs":
measureData?.value.split("^").map((r) => {
setRvsArr(Number(r));
});
break;
case "spo2":
setSpo2(measureData?.value);
break;
case "tv":
setTv(measureData?.value);
break;
}
};
useEffect(() => {
console.log("d: ", d);
//Custom listener
eventSource?.addEventListener(d, (event) => {
const result = JSON.parse(event.data);
console.log("처음 오는 데이터", result);
clasfy(result);
// setID(result.patientUserId);
// setAge(result.age);
setResultData(result);
});
}, []);
useUpdateEffect(() => {
console.log("r", rvsArr);
// let copyArr = rvsArr?.map((r) => {
// return (r = { x: now, y: r });
// });
// console.log("copyArr", copyArr);
interval(rvsArr);
}, [rvsArr]);
const interval = (r) => {
setDataList(
dataList?.map((val) => {
return {
name: val.name,
data: insertChartXY(val.data, r),
};
})
);
};
const insertChartXY = (xyData, r) => {
if (dataList[0]?.data?.length === 500) {
console.log("꽉 참");
return (xyData = xyData.filter((n, index) => {
return index > 100;
}));
} else {
console.log("여기서 추가", r);
console.log("xyData", xyData);
return [
...xyData,
{
x: now,
y: r,
},
];
}
};
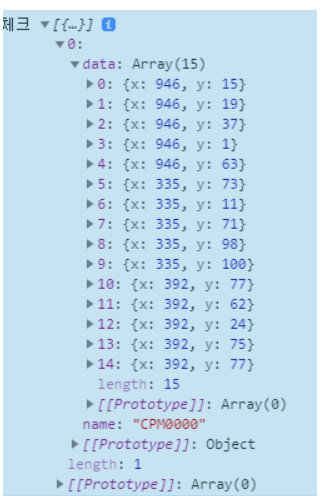
const check = () => {
console.log("check", dataList);
};
return (
<>
<div
className="LineChartWrapper"
style={{
display: "flex",
height: "9rem",
}}
>
<div className="LineClass">
<div
style={{
color: "white",
display: "flex",
justifyContent: "space-between",
border: "solid rgb(16, 16, 20)",
}}
>
<p style={{ fontWeight: "bold" }}>bed1</p>
<div onClick={check}>체크</div>
<p>Age:{ResultData?.age}</p>
<p>ID:{ResultData?.patientUserId}</p>
</div>
<div>
<StyledLineCss>
<p style={{ fontWeight: "bold", color: "white" }}>RVS</p>
<RealTimeLineChart
chartList={dataList}
range={TIME_RANGE_IN_MILLISECONDS}
/>
</StyledLineCss>
</div>
</div>
<div className="LineData" style={{ width: "100%" }}>
<div
style={{
backgroundColor: "red",
fontSize: "1rem",
fontWeight: "bold",
marginBottom: "0px",
textAlign: "center",
}}
>
Alarm Comment
</div>
<div
style={{
display: "flex",
justifyContent: "space-around",
}}
>
<div className="LineDiv">
<div
style={{
fontWeight: "bold",
color: "white",
}}
>
<p style={{ fontSize: "17px" }}>TV</p>
</div>
<div style={{ display: "flex", justifyContent: "center" }}>
<p
style={{
color: "rgb(183, 183, 183)",
fontSize: "40px",
fontWeight: "bold",
marginBottom: "0px",
}}
>
{0 <= tv && tv <= 2000 ? Math.round(tv) : "-"}
</p>
<p
style={{
color: "rgb(183, 183, 183)",
fontWeight: "bold",
marginTop: "20%",
}}
>
mL
</p>
</div>
</div>
<div className="LineDiv">
<p
style={{
fontWeight: "bold",
color: "white",
fontSize: "17px",
}}
>
MV
</p>
<div style={{ display: "flex", justifyContent: "center" }}>
<p
style={{
fontSize: "40px",
fontWeight: "bold",
marginBottom: "0px",
textAlign: "center",
}}
>
{0 <= mv && mv <= 100 ? Math.round(mv * 10) / 10 : "-"}
</p>
<p
style={{
fontWeight: "bold",
marginTop: "20%",
}}
>
L/min
</p>
</div>
</div>
<div className="LineDiv">
<p
style={{
fontWeight: "bold",
color: "white",
fontSize: "17px",
}}
>
RR
</p>
<div style={{ display: "flex", justifyContent: "center" }}>
<p
style={{
color: "rgb(50, 197, 255)",
fontSize: "40px",
fontWeight: "bold",
marginBottom: "0px",
textAlign: "center",
}}
>
{0 <= rr && rr <= 100 ? Math.round(rr) : "-"}
</p>
<p
style={{
color: "rgb(50, 197, 255)",
fontWeight: "bold",
marginTop: "20%",
}}
>
bpm
</p>
</div>
</div>
</div>
<div
className="LineBottomDiv"
style={{
display: "flex",
justifyContent: "space-between",
}}
>
<div style={{ display: "flex" }}>
<span
style={{
fontSize: "30px",
fontWeight: "bold",
}}
>
S
</span>
<span
style={{
marginTop: "1rem",
fontWeight: "bold",
fontSize: "17px",
}}
>
p
</span>
<span
style={{
fontSize: "30px",
fontWeight: "bold",
}}
>
O
</span>
<span
style={{
marginTop: "1rem",
fontWeight: "bold",
fontSize: "17px",
}}
>
2
</span>
</div>
<div style={{ display: "flex", marginRight: "12%" }}>
<p
style={{
fontSize: "30px",
fontWeight: "bold",
color: "rgb(102, 255, 255)",
}}
>
{0 <= spo2 && spo2 <= 100 ? Math.floor(spo2) : "-"}
</p>
<p
style={{
marginTop: "30%",
marginLeft: "10%",
fontWeight: "bold",
}}
>
%
</p>
</div>
</div>
</div>
</div>
</>
);
};
export default LineChart;

시간대비효율