
Prometheus란?
Prometheus는 오픈소스 시스템 모니터링 경보 도구로, 시계열(데이터)를 수집하고, 이를 기준으로 상태를 분석하거나 Grafana 같은 시각화 툴과 연동할 수 있다.
특히 서버나 컨테이너 환경의 상태를 모니터링하는 데 많이 쓰인다.
프로메테우스 역시 그래프를 그릴 수 있는데, 그라파나를 사용하는 이유가 있다.
그라파나의 경우 대시보드를 커스텀할 수 있고, 다른 사람이 만든 대시보드를 이용할 수 있다는 장점이 있다.
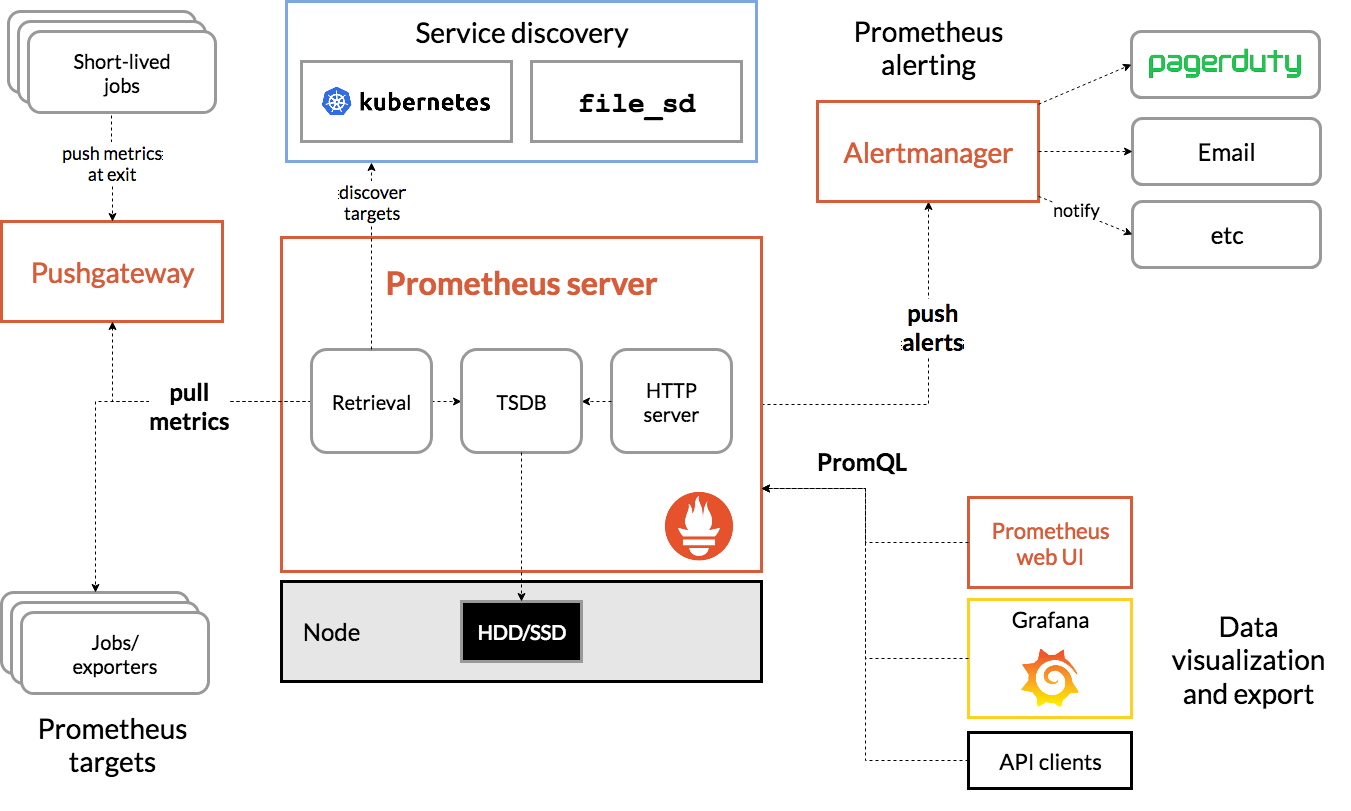
프로메테우스 공식 홈페이지에 있는 프로메테우스의 아키텍쳐이다.
- 모니터링 대상에 직접 접근하여 데이터 수집 (Pull 방식)
- 시계열 데이터를 기준으로 쿼리 작성 가능 (PromQL)
- Grafana와 쉽게 연동 가능
- 경고(alert) 시스템 내장
Prometheus 설치 (Ubuntu 24.04기준)
프로메테우스 사용자 계정 생성
sudo useradd --no-create-home --shell /bin/false prometheus
디렉토리 구성
sudo mkdir /etc/prometheus
sudo mkdir /var/lib/prometheus

sudo chown prometheus:prometheus /var/lib/prometheus
바이너리 다운로드
cd /tmp
wget https://github.com/prometheus/prometheus/releases/download/v2.53.4/prometheus-2.53.4.linux-amd64.tar.gz

tar -xvf prometheus-2.53.4.linux-amd64.tar.gz

cd prometheus-2.53.4.linux-amd64
압축해제하고 디렉토리 안으로 이동
실행 파일 및 설정 복사
sudo cp prometheus /usr/local/bin/
sudo cp promtool /usr/local/bin/
sudo chown prometheus:prometheus /usr/local/bin/prometheus /usr/local/bin/promtool

sudo cp -r consoles/ console_libraries/ /etc/prometheus/
sudo cp prometheus.yml /etc/prometheus/
sudo chown -R prometheus:prometheus /etc/prometheus
Prometheus 서비스 등록
sudo nano /etc/systemd/system/prometheus.service- 다음 설정을 파일에 포함하고 저장한 후 종료
[Unit]
Description=Prometheus
Wants=network-online.target
After=network-online.target

[Service]
User=prometheus
Group=prometheus
Type=simple
ExecStart=/usr/local/bin/prometheus \
    --config.file /etc/prometheus/prometheus.yml \
    --storage.tsdb.path /var/lib/prometheus/ \
    --web.console.templates=/etc/prometheus/consoles \
    --web.console.libraries=/etc/prometheus/console_libraries

[Install]
WantedBy=multi-user.target
서비스 실행 및 상태확인
sudo systemctl daemon-reload

sudo systemctl enable prometheus
sudo systemctl start prometheus

sudo systemctl status prometheus- Systemd 다시로드
- Prometheus 서비스 시작
- Prometheus 상태 확인
접속 확인
http://localhost:9090 로 접속해서 Prometheus 웹사이트가 나오면 성공이다.
Grafana에 Prometheus 연동
- 브라우저에서 Grafana 접속 :
http://localhost:3000 - 로그인 후 Add data source를 클릭하고
- Prometheus 선택한다.
- URL에
http://localhost:9090입력 후 저장
간단한 대시보드 생성
Grafana 좌측 메뉴에서 Dashboards를 클릭하고, New Dashboard를 클릭한다.
그 이후 Add visualization을 클릭하고 예시 쿼리로 Prometheus 자신의 상태를 볼 수 있는 up을 Metrics에서 입력합니다.
그 이후 Apply 버튼 클릭하면, 1이면 살아있는 타겟, 0이면 죽어있는 타겟으로 상태확인이 가능합니다.
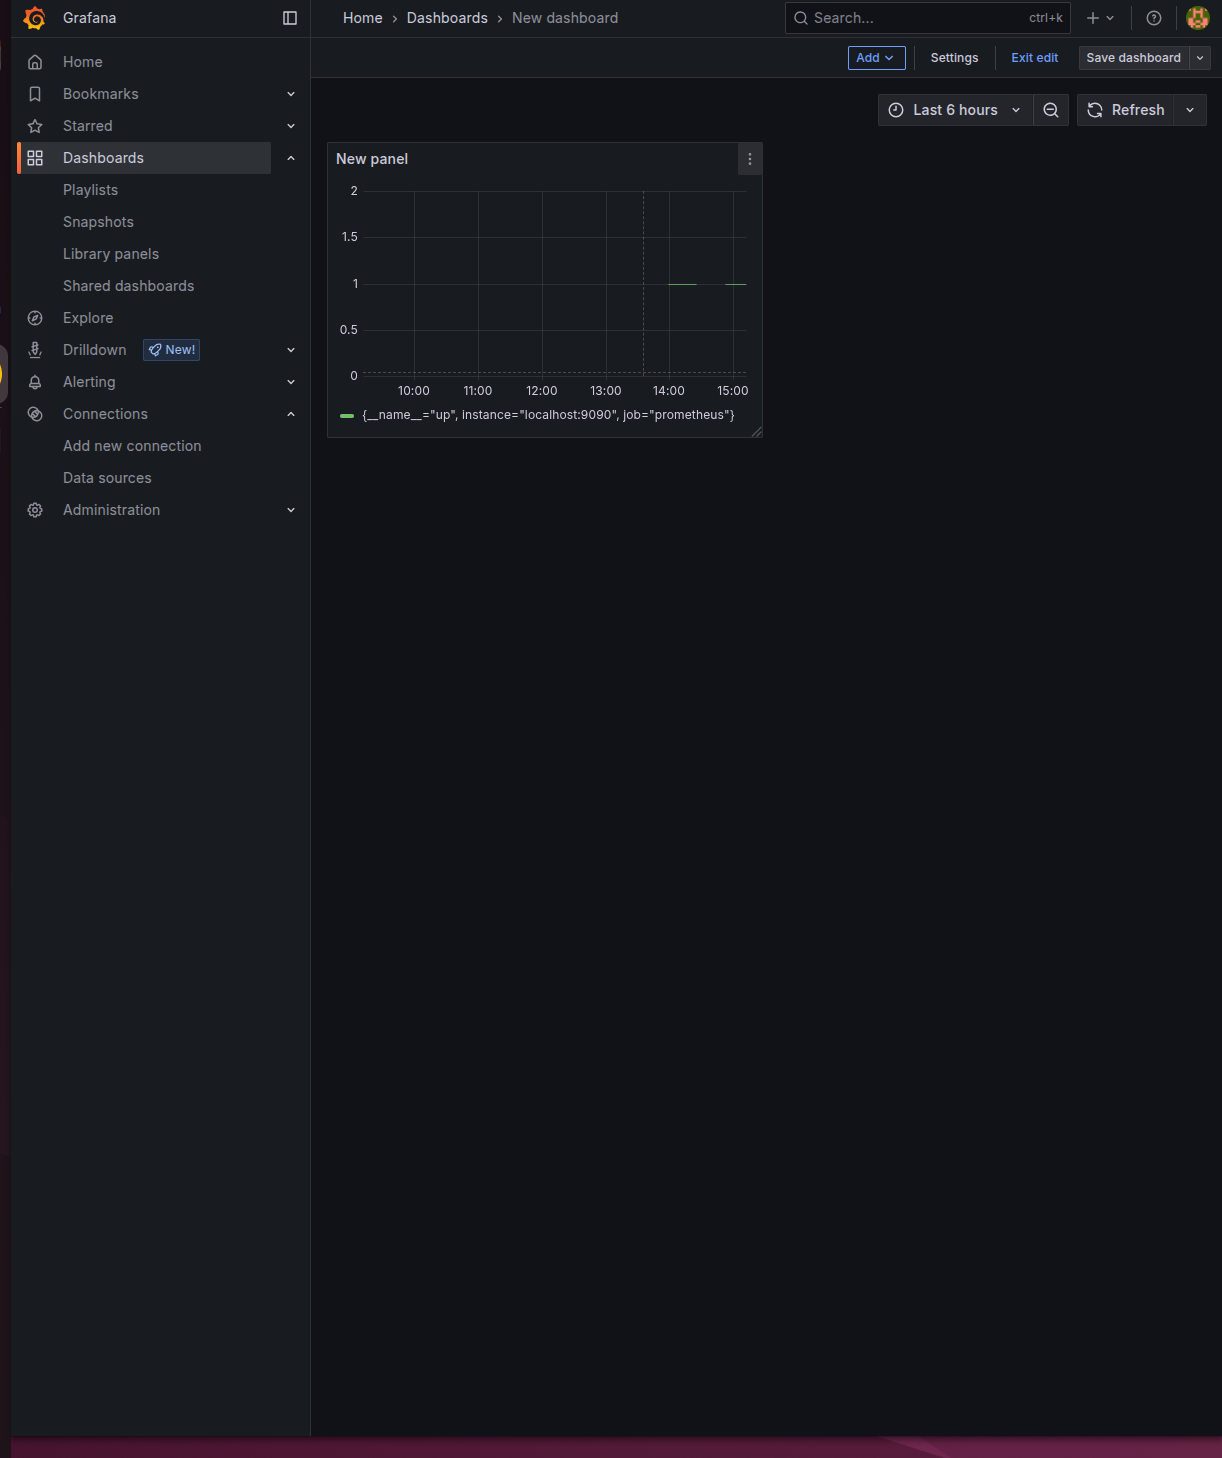
Prometheus만 설치하면 자기 자신만 모니터링 하기 때문에, 시스템 리소스를 수집하려면 node_exporter 설치가 필요하다.
마무리
Prometheus는 Grafana와 함께 사용할 때 매우 강력한 모니터링 시스템이 된다. 이번 설치를 통해 Grafana로 시각화하는 기반을 마련했다. 이후에 기회가 되면 다양한 Exporter를 연동해보며 모니터링 대상을 확장해보려한다.

학생입니다