Python Day 13_PLOTLY(반응형 그래프)
Bar ChartsBox PlotConfigurationGraph_objectsLine ChartPlotly ExpressPlotly FundamentalsSunburst ChartTime SeriesTreeMapanimationgapminderhistogramirisplotlyscattersubplotstemplatesviolin plot글자 표현법
Python
목록 보기
2/6
.png)
5. PLOTLY(반응형 그래프)
- 인터랙티브 그래프 생성한다.
- dict 형식으로 명령어 작성한다.
- JSON 데이터 형식으로 저장한다.
- 다양한 방식으로 Export 가능하다.
- 한글 지원이 되어 따러 환경설정할 게 없다.
- 로그스케일을 사용하는 이유

0) 환경설정
!pip install plotly
!pip install --upgrade plotly
# 런타임 다시 실행 해야한다.
import plotly.io as pio # Plotly input output
import plotly.express as px # 빠르게 그리는 방법
import plotly.graph_objects as go # 디테일한 설정
import plotly.figure_factory as ff # 템플릿 불러오기
from plotly.subplots import make_subplots # subplot 만들기
from plotly.validators.scatter.marker import SymbolValidator # Symbol 꾸미기에 사용됨
import numpy as np
import pandas as pd
from urllib.request import urlopen
import json
0_1) 내보내기(저장)
with open('파일명.json', 'a') as f:
    f.write(fig.to_json())
#json 대신 html과 같이 다른 형식으로 변경하면 된다.
1) dict 형식으로 그리는 방법
fig = dict({ #plotly를 사용하는 첫번쨰 방법 - dict
    "data": [{"type": "bar",
              "x": [1, 2, 3],
              "y": [1, 3, 2]}],
    "layout": {"title": {"text": "딕셔너리로 그린 그래프"}} # 제목을 제시하려면?
})
pio.show(fig) #모아보여주기
2) Express를 통해서 그리는 방법
- px를 통해 템플릿으로 그래프를 빠르게 그리기 가능
Plotly Express
#tips
	total_bill	tip	sex	smoker	day	time	size
0	16.99	1.01	Female	No	Sun	Dinner	2
1	10.34	1.66	Male	No	Sun	Dinner	3
2	21.01	3.50	Male	No	Sun	Dinner	3
3	23.68	3.31	Male	No	Sun	Dinner	2
4	24.59	3.61	Female	No	Sun	Dinner	4
...	...	...	...	...	...	...	...
239	29.03	5.92	Male	No	Sat	Dinner	3
240	27.18	2.00	Female	Yes	Sat	Dinner	2
241	22.67	2.00	Male	Yes	Sat	Dinner	2
242	17.82	1.75	Male	No	Sat	Dinner	2
243	18.78	3.00	Female	No	Thur	Dinner	2
fig1 = px.그래프명(tips, # 데이터명(데이터프레임 형식)
x='tip', # x축에 들어갈 컬럼
y='total_bill', # y축에 들어갈 컬럼
color='sex', # 색상 구분 기준이 될 컬럼명 (seaborn의 hue와 같은 역할)
size='tip', # tip 에 따라 크기를 변화
marginal_x = 'box', # scatterplot의 옵션 중 하나인 인접 그래프의 스타일 지정 (박스)
marginal_y = 'histogram',# scatterplot의 옵션 중 하나인 인접 그래프의 스타일 지정 (히스토그램)
trendline="ols", # x축과 y축으로 지정된 데이터에 대해서 회귀분석(ols로)
trendline_color_override="grey", # trendline 색상 지정
hover_name='day', # 팝업 데이터 최상단에 데이터프레임 컬럼명
hover_data=['day', 'size'], # 참고할 데이터 추가 - tips.columns로 설정하면 다 보여줌
title='Tips by Total Bill - Scatter Plot', # 그래프 타이틀 지정
facet_col='day', #day 기준으로 분할
width=800, # 그래프의 크기 조절
height=600)
fig1.show()3) Graph_objects를 통해서 그리는 방법
- Graph_objects의 약자인 go를 통해서 Figure객체를 선언하고 Figure내에 필요한 Data와 Layout등을 설정함
- 섬세한 커스터마이징이 가능
- 그래프를 겹쳐그릴 수 있음
- graph-objects
- Reference
A) fig
- go.Figure
- data : 데이터에 관한 정보
- layout : 제목, 폰트, 축, 범례 등 레이아웃 설정 정보
- go.update_layout : fig에 레이아웃 추가 업데이트
- go.add_trace : fig에 시각요소 추가 삽입 (subplot, map, 추가 그래프 등)
B) tips 데이터셋으로 실습
fig2 = go.Figure(

    # data 파트는 데이터에 관한 정보를 지정
    data=[go.Histogram(name ='Tips per Size',  # 그래프 제목
                 x=tips['size'],  # x축 값 해당 컬럼명
                 y=tips['tip'],  # y축 값 해당 컬럼명
                 hoverlabel = dict(bgcolor = 'white'),  # 마우스를 올렸을 때 뜨는 정보창의 배경 설정
                ),
         ],

    # layout 파트에서 그래프의 축, 범례 등 부가정보 기입.
    layout=go.Layout(
        title='Tips 데이터 분석',  # 메인 타이틀 입력
        xaxis=dict(  # x축 설정
            title = '팁금액과 방문인원수',
            titlefont_size=20,
            tickfont_size=10),
        yaxis=dict(  # y축 설정
            title= '전체 금액',
            titlefont_size=15,
            tickfont_size=10),
        bargroupgap=0.3, # 그래프 간의 거리 조절
        autosize=True))


fig2.show()
C) iris 데이터셋으로 실습
iris = px.data.iris() #데이터셋 불러오기
iris
import plotly.graph_objects as go
#하나씩 빼면서 보자
fig = go.Figure(data=go.Scatter( # x축 값을 생략한 경우 DataFrame의 Index에 의해 배치됨
    y = iris['sepal_length'], # y축 값 sepal_length 값에 따라 배치
    mode='markers', # Scatter Plot을 그리기 위해 Markers
    marker=dict(    # Marker에 대한 세부 설정을 지정
        size=20,    # 점 크기
        color=iris['petal_length'], # 색깔 값을 petal_length에 따라 변하도록 설정
        colorscale='Viridis', # one of plotly colorscales
        showscale=True,  # colorscales 보여줌
        line_width=1, # 마커 라인 두께 설정

    )
))
fig.update_layout(title='Iris Data')
fig.show()
4) 그래프 종류
A) scatter
gapminder = px.data.gapminder() # 1952~2007년 대륙, 나라별 인구수, 평균수명, GDP를 담은 데이터
#gapminder 데이터프레임에서 2007년에 해당하는 자료만을 추출하여 gap2007 이라는 변수에 저장하여 출력하세요.
gap2007 = gapminder[gapminder['year'] == 2007]
#Plotly를 이용하여 데이터프레임 gap2007을 '2007년의 대륙별 기대수명'이라는 제목으로 대륙별로 색깔을 다르게 지정하여 x축은 GDP, y축은 기대수명으로 하는 스캐터플롯으로 출력하세요.
fig5 = px.scatter(gap2007, # 데이터명(데이터프레임 형식)
                 x='gdpPercap', # x축에 들어갈 컬럼
                 y='lifeExp', # y축에 들어갈 컬럼
                 color='continent', # 색상 구분 기준이 될 컬럼명 (seaborn의 hue와 같은 역할)
                 size='pop', # petal_length 에 따라 크기를 변화
                 log_x=True, #대소비교하기
                 size_max=40,
                #  trendline='ols', #회귀분석으로 경향 보기
                #  facet_col='day',
                 hover_name='country', # 팝업 데이터 최상단에 데이터프레임 컬럼명
                #  hover_data=['time', 'size'], # 참고할 데이터 추가 - tips.columns로 설정하면 다 보여줌
                 title='2007년의 대륙별 기대수명', # 그래프 타이틀 지정
                 )

fig5.show().png)
B) Line Chart
#gapminder 데이터셋에서 아시아 지역의 데이터만을 추출하여 gapAsia라는 이름의 데이터프레임으로 저장하세요.
gapAsia = gapminder[gapminder['continent']=='Asia']

#PlotlyExpress를 사용하여 gapAsia 데이터셋을 x축은 연도, y축은 기대수명을 축으로 하는 라인그래프로 출력하세요.
fig = px.line(gapAsia,
              x="year",
              y="lifeExp",
              color='country',
              hover_name='country',
              title='Life expectancy in Asia')
fig.show().png)
B_1) scatter + Line Chart
.png)
C) Time Series(시계열)
a) 환경설정
!pip install yfinance #모듈 설치

import pandas as pd
import numpy as np
import yfinance as yf

samsung = yf.download('005930.KS', #삼성전자 주식의 오늘까지 데이터를 가져온다.
                      start='2001-11-12',
                      end='2022-03-31',
                      progress=False)

samsung = samsung.reset_index() #인덱스 재설정

fig = px.line(samsung,
              x="Date",
              y="Close",
              hover_name='Date',
              range_x=['2020-01-01', '2022-03-29'], #범위 설정하기
              title='samsung')
fig.show().png)
D) Bar Charts
canada = gapminder[gapminder['country']=='Canada']
fig = px.bar(canada,
              x='year',
              y='pop',
              hover_data=['gdpPercap', 'lifeExp'],
              color='lifeExp', #기대 수명에 따른 색 변화
              #orientation='h' #가로로 돌리기
              title='Life expectancy in Canada',
              width=600, height=600,
             labels={'pop':'population of Canada for y', 'year':'year for x'}
              )
fig.show().png)
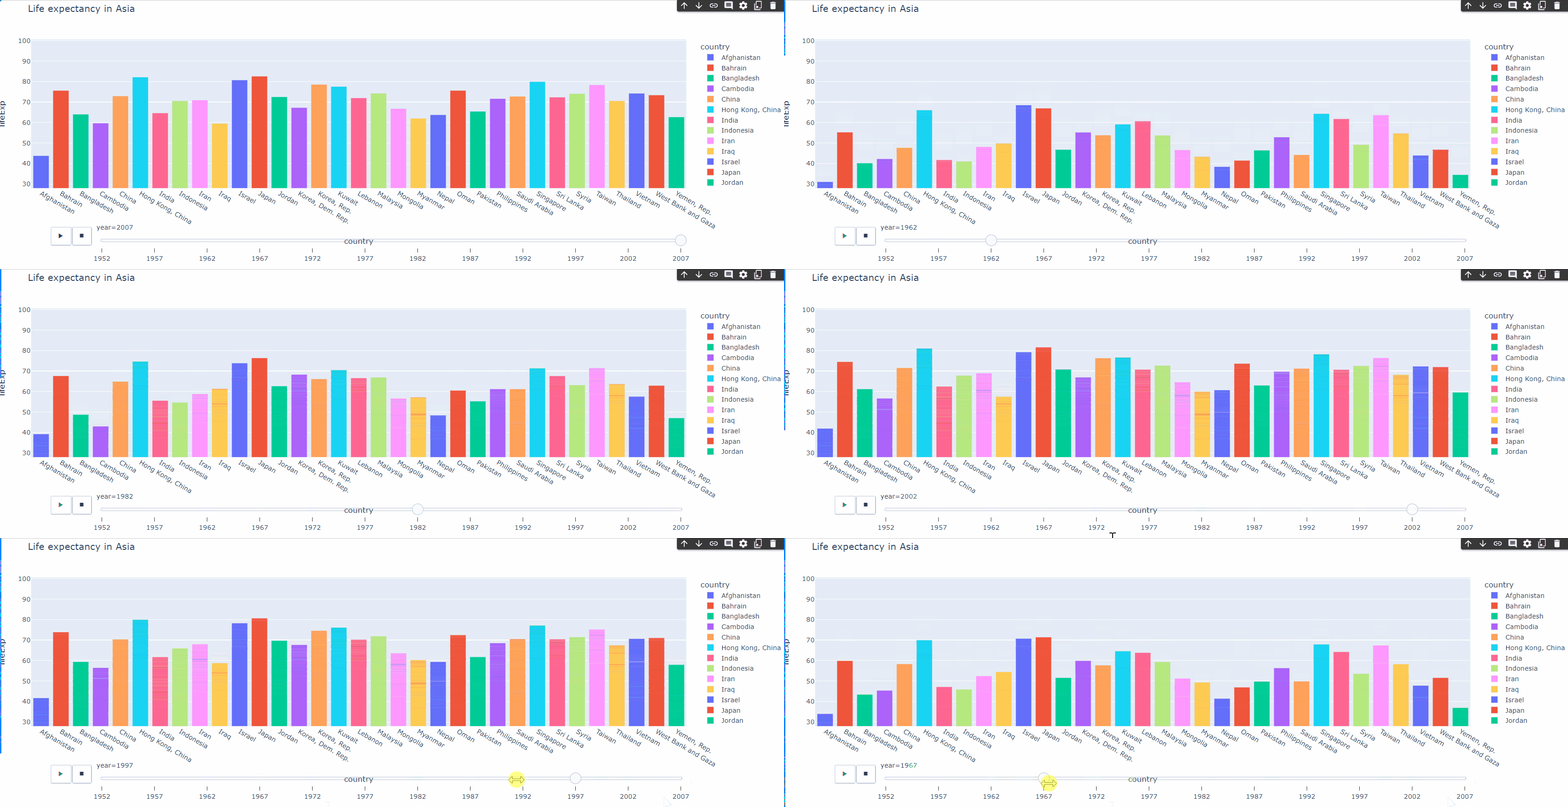
D_1) Bar + animation
fig = px.bar(Asia, x='country', y='lifeExp', color='country',
             animation_frame='year', #경과기준
             animation_group='country', #경과에 따라 바뀔 컬럼
             title='Life expectancy in Asia',
             range_y=[28 ,100.603000]) #범위 설정
fig.show()
E) Box Plot & Violin Plot
df = px.data.tips()
fig = px.box(df, x="time", y="total_bill", points='all')
fig.show().png)
F) Histogram
fig = px.histogram(tips,
                   x='total_bill',
                   color='sex',
                   nbins=20, # 20개 묶음
                   opacity=0.6, #투명도 설정
                   color_discrete_sequence=['red', 'blue']) #컬러 각각 지정
fig.show().png)
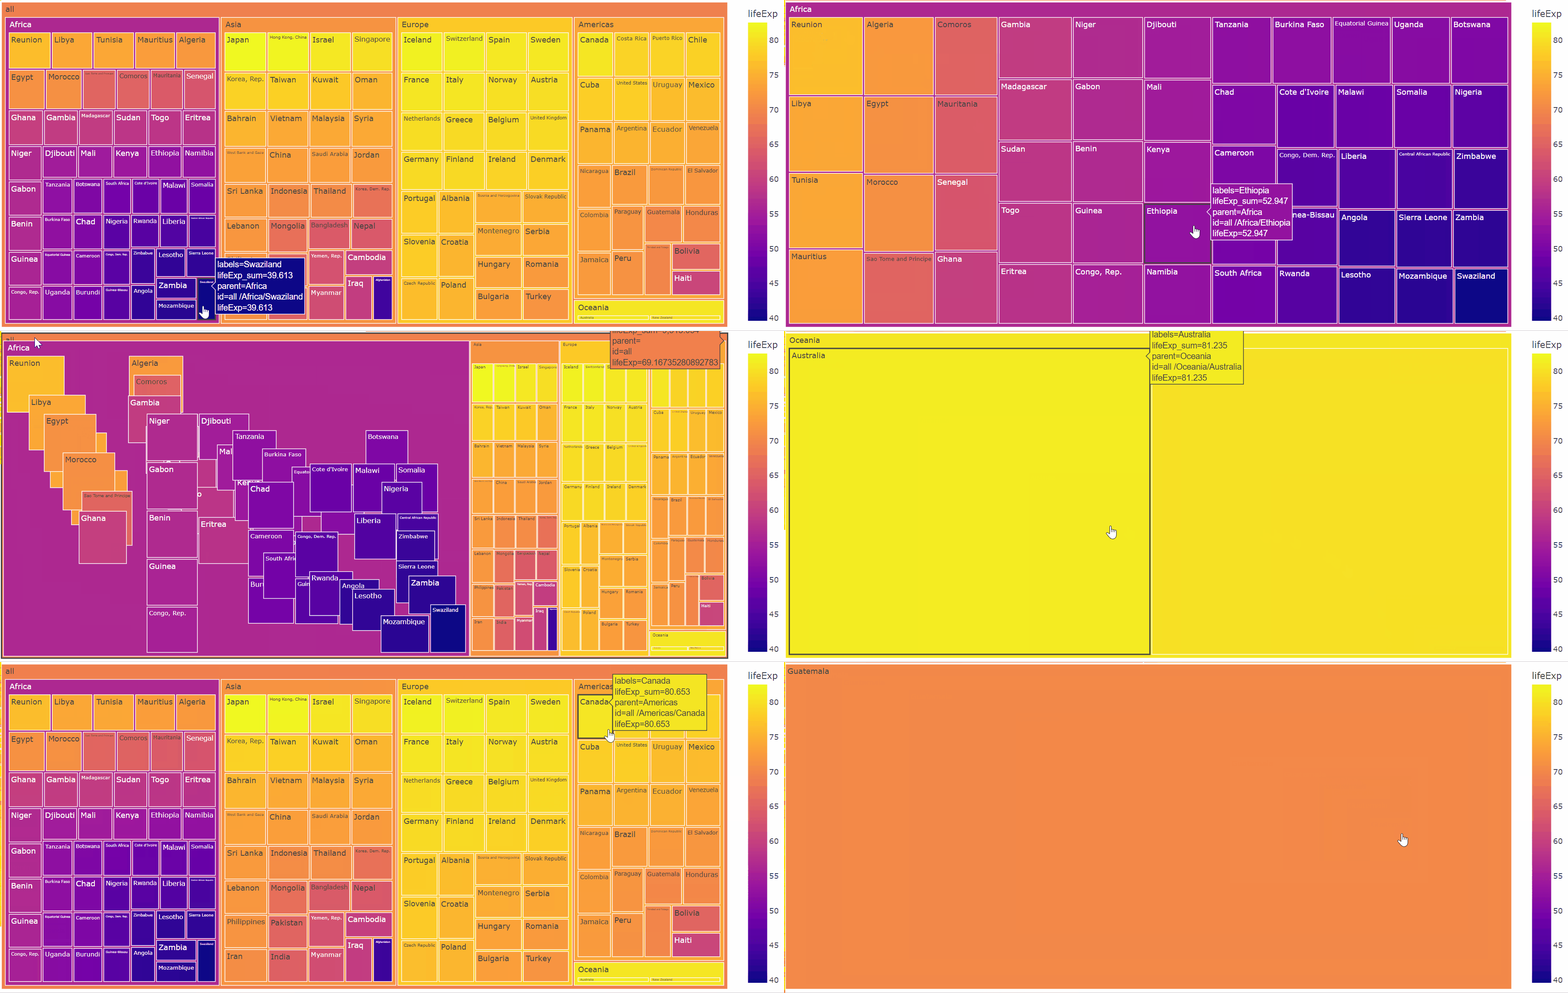
G) TreeMap
※ query 이용하여 불린 인덱싱 대신하기
자료명.query('조건')import plotly.express as px
import plotly
# 국가별 기대수명
# df = gapminder[gapminder['year']==2007 & gapminder['continent']=='Americas']
df = px.data.gapminder().query("year == 2007") #query로 위 과정을 간략히 할 수있다.
fig = px.treemap(df,
path=[px.Constant("all "),'continent','country'],
values='lifeExp', #values 정렬 기준
color='lifeExp',
labels={'lifeExp':'기대수명'}) #라벨링
fig.update_layout(margin = dict(t=50, l=25, r=25, b=25)) #위 왼 오 아래 여백 지정
fig.show()
5) Plotly Fundamentals
A) 템플릿(Templates)
- 사용 가능한 템플릿
- 'plotly'(기본)
- 'ggplot2'
- 'seaborn'
- 'simple_white'
- 'plotly'
- 'plotly_white'
- 'plotly_dark'
- 'presentation'
- 'xgridoff'
- 'ygridoff'
- 'gridon'
- 'none'
import plotly.io as pio
import plotly.express as px

pio.templates.default = "plotly" #기본

df = px.data.gapminder()
df_2007 = df.query("year==2007")

fig = px.scatter(df_2007,
                 x="gdpPercap", y="lifeExp", size="pop", color="continent",
                 log_x=True, size_max=60,
                 title="Gapminder 2007: current default theme")
fig.show()
a) 'plotly'(기본)
.png)
b) 'ggplot2'
.png)
c) 'plotly_dark'
.png)
B) 구성(Configuration)

config = dict({'scrollZoom':True, 'displaylogo':False,'displayModeBar': True, 'editable':True, 'responsive': False, 'staticPlot': True}) #구성 빼고 넣기
B_1) 그리기 기능 넣기
fig.show(config={'modeBarButtonsToAdd':['drawline',
                                        'drawopenpath',
                                        'drawclosedpath',
                                        'drawcircle',
                                        'drawrect',
                                        'eraseshape'
                                       ]})
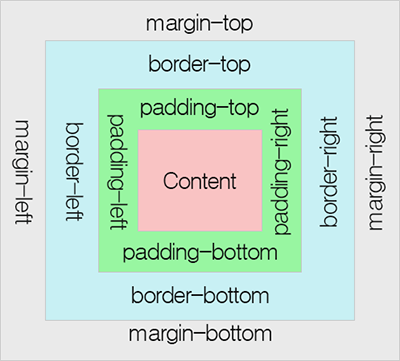
C) 높이, 너비 및 여백 조정
fig.update_layout(title='Tips by Total Bill',
                  margin=dict(l=10, r=20, t=30, b=40, pad=2),
                  paper_bgcolor='yellow',
                  width=500, height=500)
fig.show(config=config)
D) 글자 표현법
a) 날짜표현, 소숫점 자릿수 표현, 축 그리기
fig.update_layout(
    xaxis_tickformat = '%d %B (%a)<br>%Y' #x축 날짜표현 %d - day %B - month %a - 요일 %Y -year,
    yaxis_tickformat = '.2%' #소수점 둘 째자리까지 표현

)
fig.update_xaxes( #x축에 바운더리 그어주기  #y축에 하려면 y만 바꿔주면 된다.
    showgrid=True,
    ticks="outside",
    tickson="boundaries",
    ticklen=20
    #,ticks="inside" #인라인으로 바꾸기
 )
b) 라벨링
fig =  px.scatter(iris, x='petal_length', y='petal_width', color='species',
                  labels={'petal_length':'Petal Length (cm)',
                          'petal_width':'Petal Width (cm)',
                          'species' : 'Species'}) #라벨링
c) 폰트 설정
fig.update_layout(
    font_family="Courier New",
    font_color="blue",
    title_font_family="Times New Roman",
    title_font_color="red",
    legend_title_font_color="green"
)
E) 서브플롯(Subplots)
- rows: 행의 갯수 (ex) 2)
- cols: 열의 갯수 (ex) 3)
- shared_xaxes: x축을 공유할지 여부 (True, False)
- shared_yaxes: y축을 공유할지 여부 (True, False)
- start_cell: 시작위치 정하기 (ex) "top-left")
- print_grid: 그리드 출력여부 (True, False)
- horizontal_spacing: 그래프간 가로 간격
- vertical_spacing: 그래프간 가로 간격
- subplot_titles: 플롯별 타이틀
- column_widths: 가로 넓이
- row_heights: 세로 넓이
- specs: 플롯별 옵션
- insets: 플롯별 그리드 레이아웃 구성
- column_titles: 열 제목
- row_titles: 행 제목
- x_title: x축 이름
- y_title: y축 이름
from plotly.subplots import make_subplots
import plotly.graph_objects as go

fig = make_subplots(rows=1, cols=2) #도화지 분할
#가로1 도화지에 그리기
fig.add_trace(
    go.Scatter(x=[1, 2, 3], y=[4, 5, 6]),
    row=1, col=1
)
#가로2 도화지에 그리기
fig.add_trace(
    go.Scatter(x=[20, 30, 40], y=[50, 60, 70]),
    row=1, col=2
)

fig.update_layout(height=600, width=800, title_text="Side By Side Subplots")
fig.show()
#-----------------------------------------------------
fig = make_subplots(rows=3, cols=1) #세로로 분할

fig.append_trace(go.Scatter(
    x=[3, 4, 5],
    y=[1000, 1100, 1200],
), row=1, col=1)

fig.append_trace(go.Scatter(
    x=[2, 3, 4],
    y=[100, 110, 120],
), row=2, col=1)

fig.append_trace(go.Scatter(
    x=[0, 1, 2],
    y=[10, 11, 12]
), row=3, col=1)
#-----------------------------------------------------
fig = make_subplots(rows=1, cols=2, column_widths=[0.7, 0.3]) #도화지 분할하고 도화지 면적 지정하기

fig.add_trace(go.Scatter(x=[1, 2, 3], y=[4, 5, 6]),
              row=1, col=1)

fig.add_trace(go.Scatter(x=[20, 30, 40], y=[50, 60, 70]),
              row=1, col=2)

fig.show()