1. t-SNE 이란?
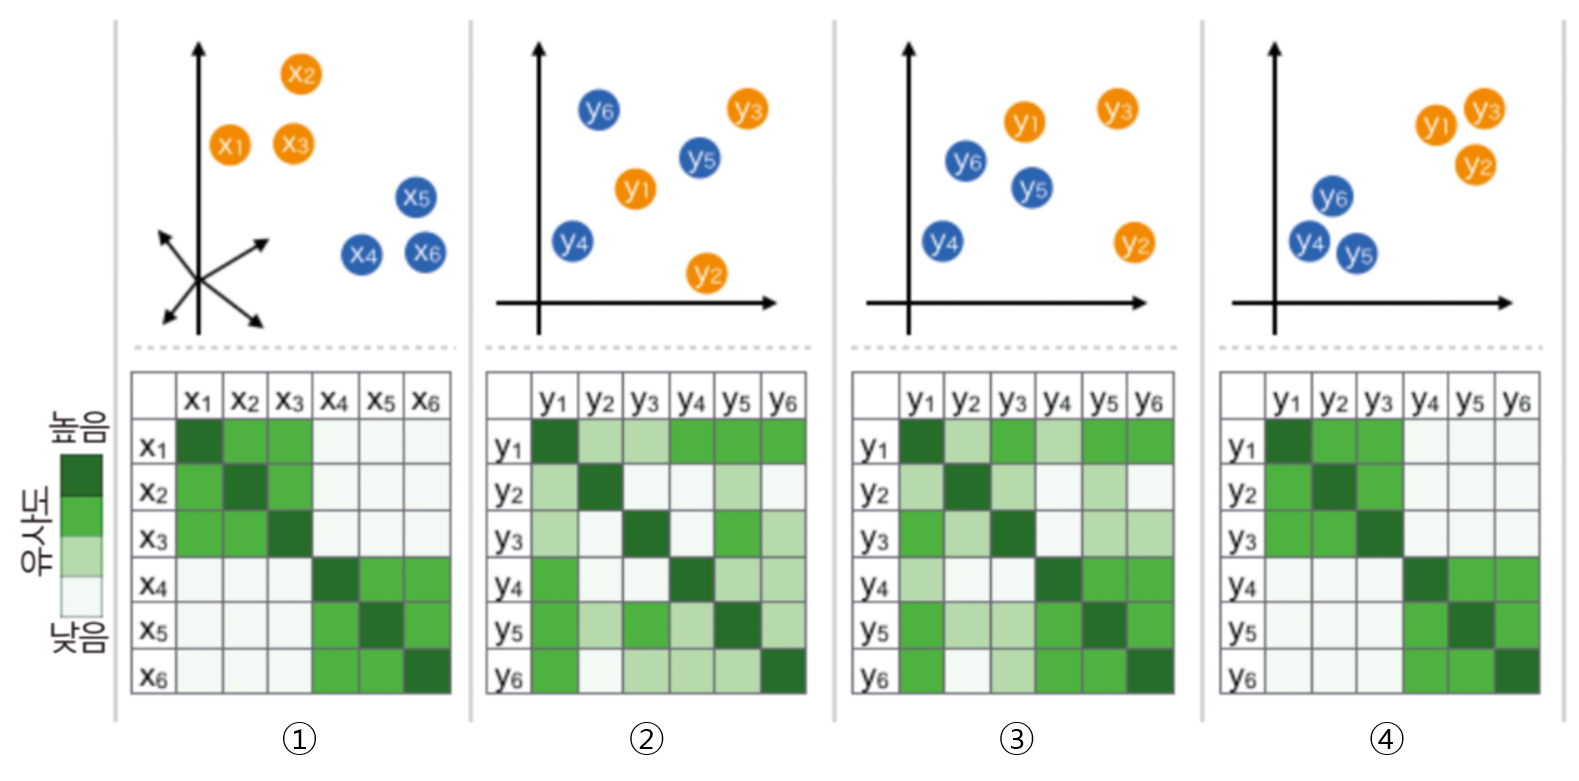
T-SNE (t-distributed stochastic neighbor embedding)라고 불리는 방법은 높은 차원의 복잡한 데이터를 2차원에 차원 축소하는 방법이다. 낮은 차원 공간의 시각화에 주로 사용하며 차원 축소할 때는 비슷한 구조끼리 데이터를 정리한 상태이므로 데이터 구조를 이해하는 데 도움을 준다.
- 매니폴드 학습의 하나로 복잡한 데이터의 시각화가 목적이다. 높은 차원의 데이터를 2차원 또는 3차원으로 축소시켜 시각화한다.
- t-SNE를 사용하면 높은 차원 공간에서 비슷한 데이터 구조는 낮은 차원 공간에서 가깝게 대응하며, 비슷하지 않은 데이터 구조는 멀리 떨어져 대응된다.
- 이웃 데이터 포인트에 대한 정보를 보전하려고 한다.
2. t-SNE에 대한 수식적 의미
- 비선형적인 차원 축소 방법이다. (특히 고차원의 데이터 셋을 시각화하는 것에 성능이 좋음)
- t-SNE 알고리즘은 고차원 공간에서의 점들의 유사성과 그에 해당하는 저차원 공간에서의 점들의 유사성을 계산한다.
- 점들의 유사도는 A를 중심으로 한 정규 분포에서 확률 밀도에 비례하여 이웃을 선택하면 포인트 A가 포인트 B를 이웃으로 선택한다는 조건부 확률로 계산된다.
그리고 저 차원 공간에서 데이터 요소를 완벽하게 표현하기 위해 고차원 및 저 차원 공간에서 이러한 조건부 확률 (또는 유사점) 간의 차이를 최소화하려고 시도한다. - 조건부 확률의 차이의 합을 최소화하기 위해 t-SNE는 gradient descent 방식을 사용하여 전체 데이터 포인트의 KL-divergence 합계를 최소화한다. Kullback-Leibler divergence 또는 KL divergence는 한 확률 분포가 두 번째 예상 확률 분포와 어떻게 다른지 측정하는 척도이다.
- 정리하면 t-SNE는 두가지 분포의 KL divergence를 최소화 한다.
- 입력 객체(고차원)들의 쌍으로 이루어진 유사성을 측정하는 분포
- 저차원 점들의 쌍으로 유사성을 측정하는 분포
- 이러한 방식으로, t-SNE는 다차원 데이터를보다 낮은 차원 공간으로 매핑하고, 다수의 특징을 갖는 데이터 포인트의 유사성을 기반으로 점들의 클러스터를 식별함으로써 데이터에서 패턴을 발견한다.

- 하지만 t-SNE 과정이 끝나면 input feature를 확인하기가 어렵다. 그리고 t-SNE 결과만 가지고 무언가를 추론 하기는 어려움이 있다.
- 따라서 t-SNE는 주로 시각화 툴로 사용 된다.
t-SNE에서 낮은 차원에 임베딩 할 때, 정규 분포를 사용하지 않고 t-분포를 사용한다. t-분포는 일반적인 정규분포보다 끝단의 값이 두터운 분포를 가지기 때문이다.
t-SNE가 전제하는 확률 분포는 정규 분포이지만, 정규 분포는 꼬리가 두텁지 않아서 i번째 개체에서 적당히 떨어져 있는 이웃 j와 아주 많이 떨어져 있는 이웃 k가 선택될 확률이 크게 차이가 나지 않게 된다. 또한 높은 차원 공간에서는 분포의 중심에서 먼 부분의 데이터 비중이 높기 때문에 데이터 일부분의 정보를 고차원에서 유지하기가 어렵다.
이러한 문제로 인하여 구분을 좀 더 잘하기 위해 정규 분포보다 꼬리가 두터운 t분포를 쓰게 되며 꼬리가 부분이 상대적으로 더 두텁게 degree of freedom(자유도) = 1로 적용하여 사용한다.
또한 t-분포도 마찬가지로 표본 평균, 표본 분산으로 정의되는 확률변수이기 때문에 표본의 수가 많아질수록 중심 극한 정리에 의해 결국에는 정규 분포로 수렴하게 된다.
3. Python 코드로 구현
- scikit-learn에 있는 손글씨 데이터셋
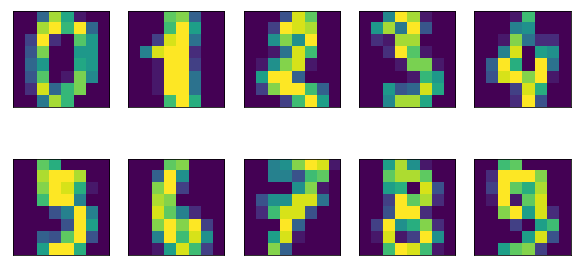
- 각 포인트는 0~9 사이의 손글씨 숫자를 표현한 8*8 크기의 흑백 이미지
- 아래는 숫자 데이터셋의 샘플 이미지이다.
import matplotlib.pyplot as pltdigits = load_digits() fig, axes = plt.subplots(2,5,figsize=(10,5), subplot_kw = {'xticks':(), 'yticks':()}) for ax, imgs in zip(axes.ravel(), digits.images): ax.imshow(imgs)
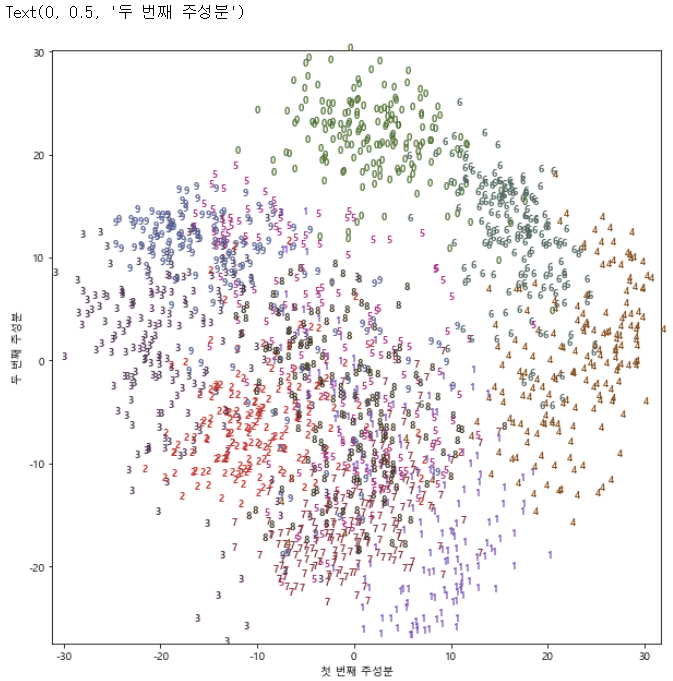
- PCA로 구현 시,
from sklearn.decomposition import PCA
from matplotlib import font_manager
plt.rc('axes', unicode_minus=False)
#2차원으로 축소 pca = PCA(n_components=2) pca.fit(digits.data)#처음 두 개의 주성분으로 숫자 데이터를 변환 digits_pca = pca.transform(digits.data) colors = ["#476A2A", "#7851B8", "#BD3430", "#4A2D4E", "#875525", "#A83683", "#4E655E", "#853541", "#3A3120","#535D8E"] plt.figure(figsize=(10,10)) plt.xlim(digits_pca[:, 0].min(), digits_pca[:, 0].max()) plt.ylim(digits_pca[:, 1].min(), digits_pca[:, 1].max()) for i in range(len(digits.data)): plt.text(digits_pca[i, 0], digits_pca[i,1], str(digits.target[i]), color = colors[digits.target[i]] ,fontdict={'weight': 'bold', 'size':9} ) ##fontdict={'weight': 'bold', 'size':9} plt.xlabel("첫 번째 주성분") plt.ylabel("두 번째 주성분")
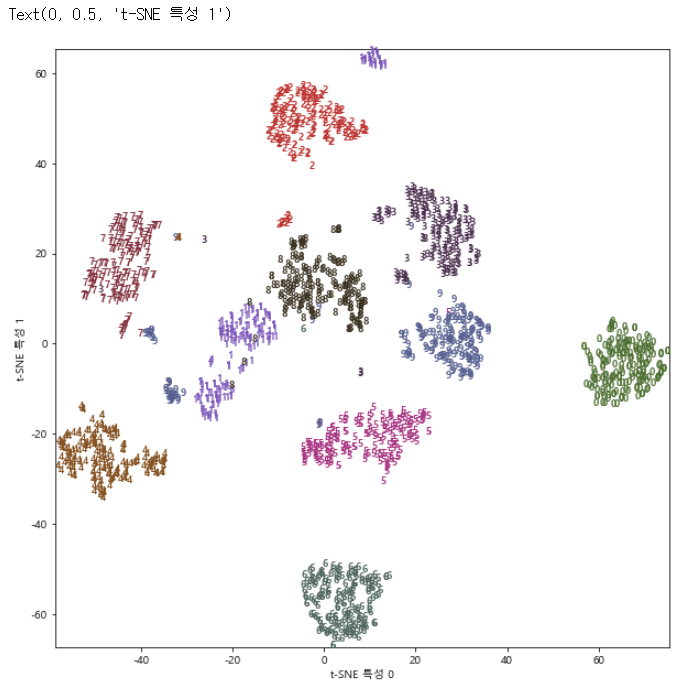
- T-SNE로 구현 시,
from sklearn.manifold import TSNE
plt.rc('axes', unicode_minus=False)
tsne = TSNE(random_state = 42)
#TSNE에는 transform 메서드가 없으므로 대신 fit_transform을 사용한다. digits_tsne = tsne.fit_transform(digits.data) plt.figure(figsize=(10,10)) plt.xlim(digits_tsne[:,0].min(), digits_tsne[:,0].max()+1) plt.ylim(digits_tsne[:,1].min(), digits_tsne[:,1].max()+1) for i in range(len(digits.data)): plt.text(digits_tsne[i,0], digits_tsne[i,1], str(digits.target[i]), color = colors[digits.target[i]], fontdict = {'weight':'bold','size':9}) plt.xlabel("t-SNE 특성 0") plt.ylabel("t-SNE 특성 1")
출처:
https://angeloyeo.github.io/2020/10/27/KL_divergence.html
https://gaussian37.github.io/ml-concept-t_sne/
https://log-laboratory.tistory.com/340
https://lovit.github.io/nlp/representation/2018/09/28/tsne/


화이팅!!