🔎 Stanford CS231n 강의를 듣고 기록용도로 정리하는 게시글입니다.
Image Classification
- a core task in CV
- input: image
- system is aware of predetermined set of categories(labels) (ex. dog, cat ...)
- assign each images one of these fixed category labels
- a really hard problem for a machine
The Problem: Semantic Gap
- Computer represents an image as a gigantic grid of numbers
- Each pixel is represented by three numbers (RGB)
- It's difficult to distill(추출해 내다?) the 'catness' out of this gigant array of many different numbers
= semantic gap - the label 'cat' is a semantic label that we're assigning to this image
- but there is a huge gap between the semantic idea of a cat and these pixel values
Challenges
- our algorithm needs to be robust to this
Viewpoint variation
- a small, subtle change in the image → cause the pixel grid to change entirely
- ex) 같은 자세로 움직이지 않는 고양이를 다른 각도에서 찍은 이미지 → 같은 고양이이지만 픽셀 값이 완전히 달라짐
- our algorithm needs to be robust to this
Illumination
- different lighting condition in the scene
- dark, moody or sunny ...
Deformation
- different and varied poses and positions
Occlusion (맞물림)
- a part of a cat (ex. face, a tail) → easy for a person to realize and recognize that this is cat, but difficult for the computer
Background Clutter
- foreground object of the cat could actually look quite similar in appearance to the background
- 고양이가 배경이랑 비슷할 수도 있음
Intraclass Variation
- notion of 'catness' spans a lot of different appearances(shapes, colors, ages ...)
우리 머리는 이러한 것들에 적합하게 튜닝되어있기 때문에 다양한 물체를 보고 인식하는 것이 얼마나 어려운지 모름.
컴퓨터를 사용해서 동시에 이 문제를 다루게 하고 싶다면, 굉장히 어려운 문제임.
그러나 이러한 것이 어떤 경우에는 사람이 처리하는 것과 같은 정도의 시간이 걸리기도 함.
Coding an image classifier
Hard coding?
def classify_image(image):
	# Some magic here?
return class_label- 위처럼 할 수 있지 않을까? 생각할 수도 있음
- but, no obvious way to hard-code the algorithm for recognizing a cat, or other classes
- 물체를 인식하려고 할 때, 직관적이고 clear, explicit한 알고리즘은 없음 → very challenging
Hard coding attempts that have been made
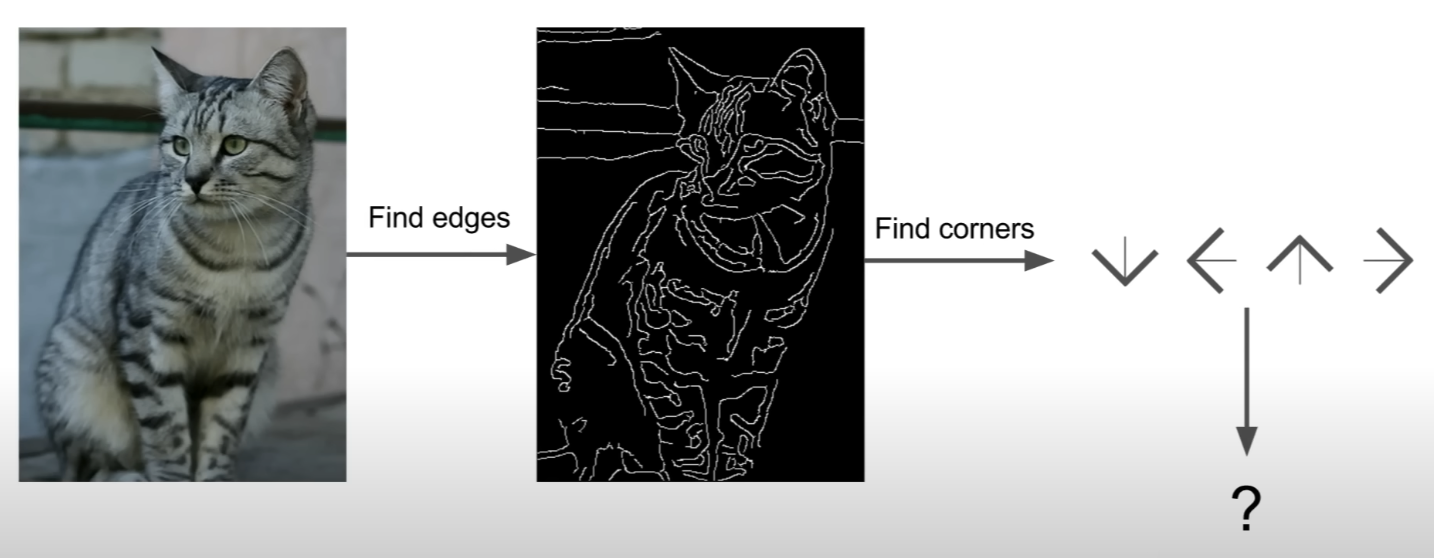
- Cats have ears, eyes, mouths, and noses
- Edges are important when it comes to visual recognition
- Compute the edges of this image and categorize all the different corners, boundaries → write down an explicit set of rules for recognizing cats
- But this does not work well
1. too brittle (불안정, 잘 부서지는)
2. another category → have to start all over again
⇒ we need something for all of the objects in the world
Data-driven approach
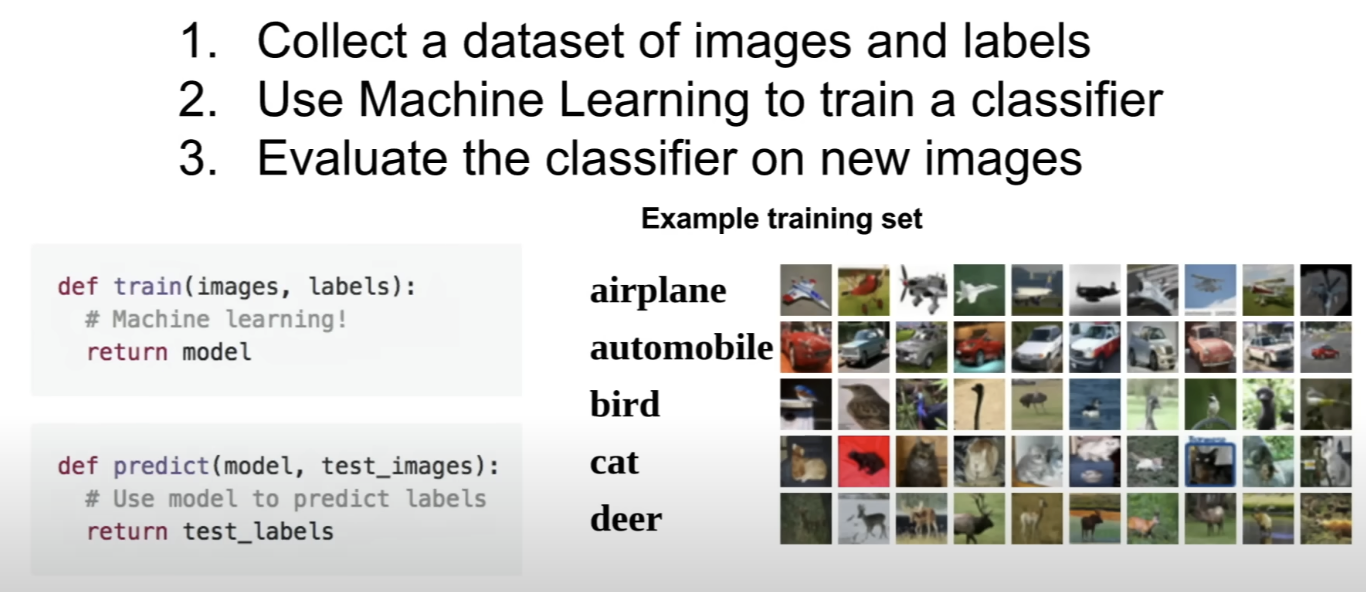
-
rather than writing rules,
1. Collect a large dataset of many cats or airplanes... (use tools like Google Image Search...)
2. Train this ML classifier that ingests all of the data and summarizes it some way and then spits out a model that summarizes the knowledge of these different categories
3. Use this model and apply it on a new image(→ determine the category of the image) -
need two functions
1.train- input images, output the model
2.predict- input the model and make predictions
Classifiers
1. Nearest Neighbor
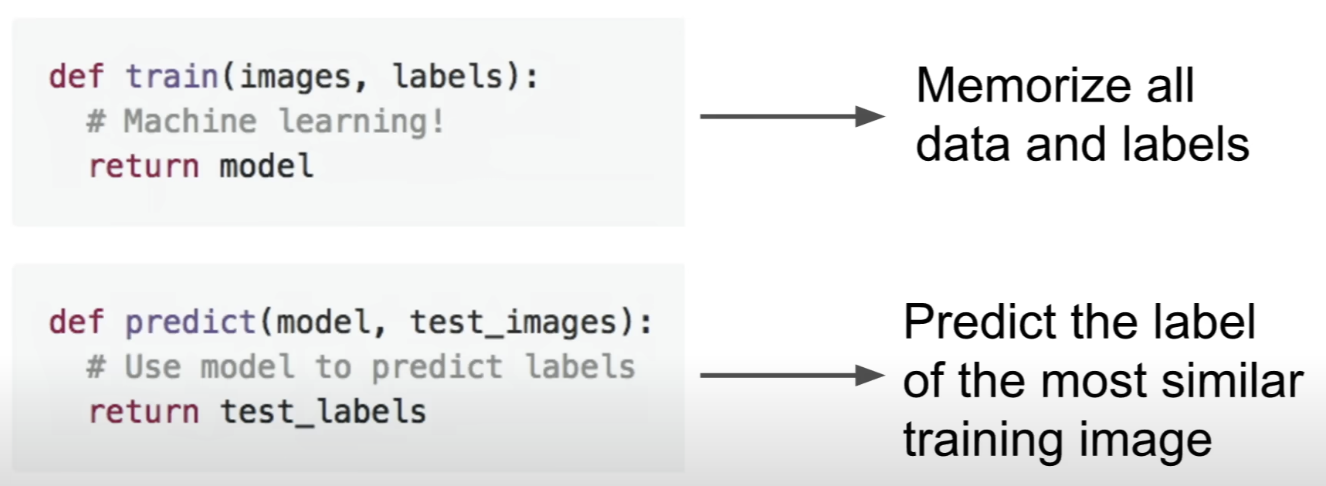
train- memorize all of the training data (그냥 저장한다는 뜻인 것 같음)predict- find the most similar image in the trainig data to a new image, and predict the label of that most similar image
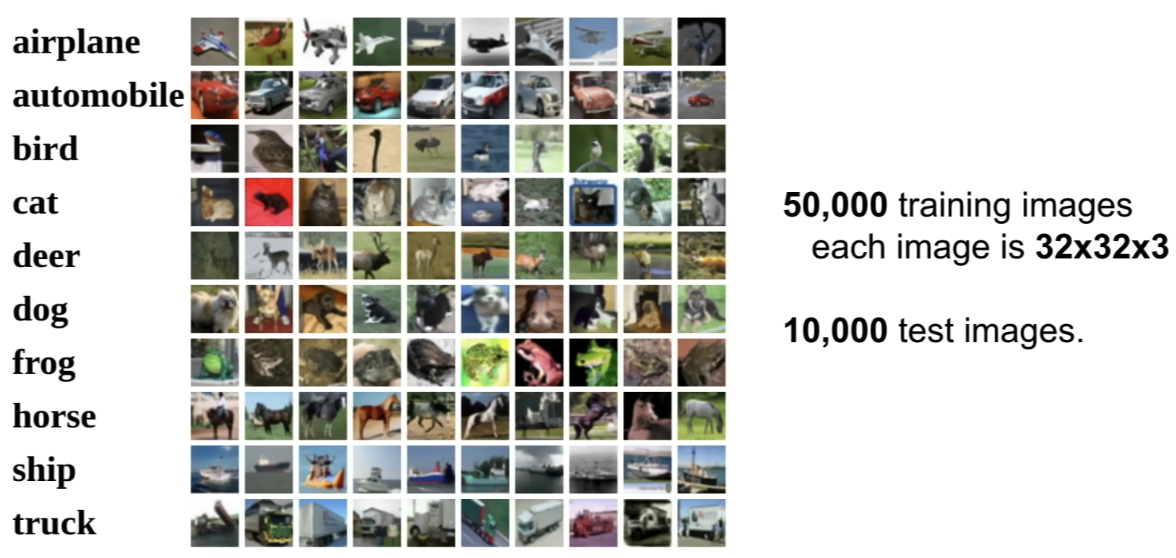
Example dataset: CIFAR10
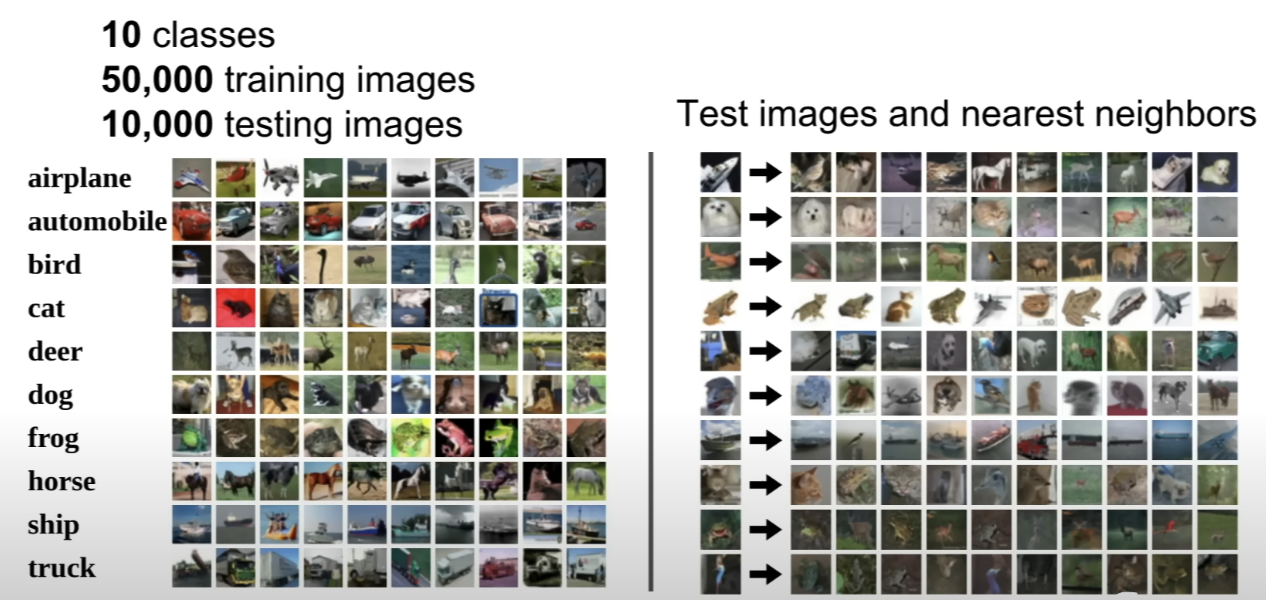
- a commonly used data in ML
- doesn't work very well
Distance Metric to compare images
-
We have many choices for what the comparison function should look like
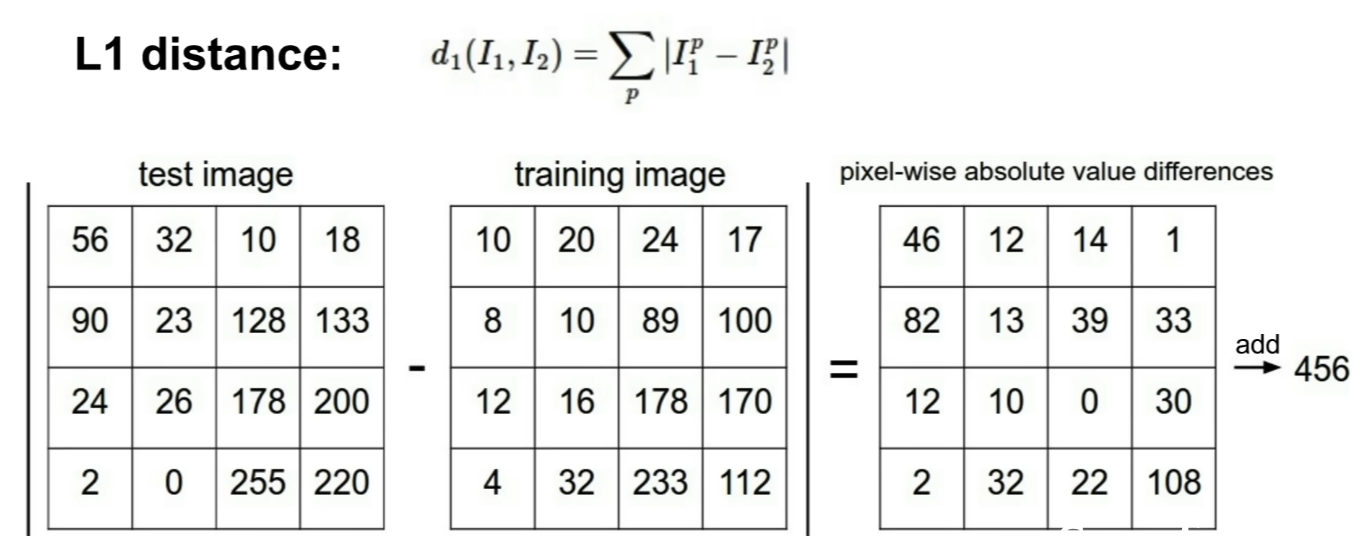
-
위에서 본 예제에서는 L1 distance (= Manhattan Distance)가 사용됨
-
각각의 픽셀 값에 대해 계산 진행
-
(test image pixel - training image pixel) ⇒ 결과에 절댓값 씌움
Code for NN classifier
import numpy as np

class NearestNeighbor:
	def __init__(self):
    	pass

    # 많은 것을 하지 않음. training data를 memorize하기만 함
    def train(self, X, y):
    	""" X is N x D where each row is an example. Y is 1-dimension of size N """
        # the nearest neighbor classifier simply remembers all the training data
        self.Xtr = X
        self.ytr = y

    def predict(self, X):
    	""" X is N x D where each row is an example we wish to predict label for """
        num_test = X.shape[0]
        # lets make sure that the output type matches the input type
        Ypred = np.zeros(num_test, dtype = self.ytr.dtype)

        # 각각의 테스트 이미지에 대해, 가까운 train 이미지를 찾고 그것의 label을 예측함
        # loop over all test rows
        for i in xrange(num_test):
        	# find the nearest training image to the i'th test image
            # using the L1 distance (sum of absolute value differences)
            distances = np.sum(np.abs(self.Xtr - X[i,:]), axis = 1)
            min_index = np.argmin(distances) # get the index with smallest distance
            Ypred[i] = self.ytr[min_index] # predict the label of the nearest example

return Ypred- N개의 example이 있다면, training 과 prediction의 수행 시간은?
⇒Train= O(1),Predict= O(N) - 이는 별로 좋지 않음. Classifiers that are fast at prediction, slow for training is ok
- 실제 실행을 모바일 환경 등에서 실행한다면 빠르게 실행되기를 원하기 때문.
Decision regions
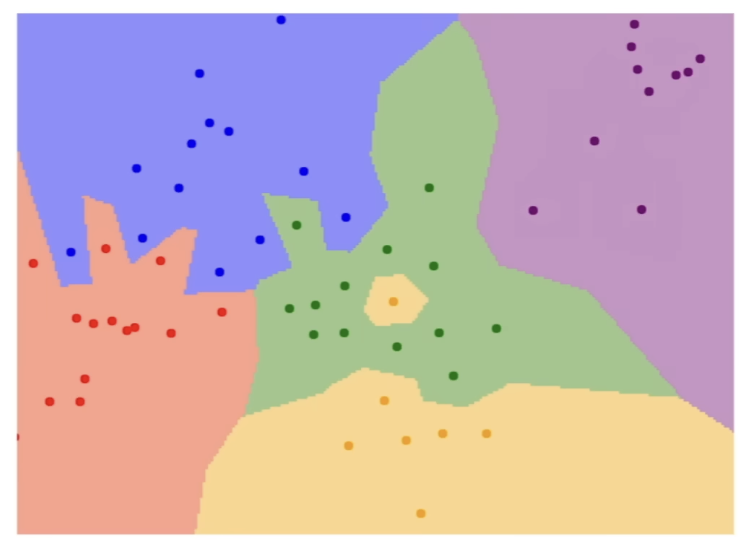
- 색 = class label, 점 = training set
- problem?
- Central region contains mostly green points, but one yellow point in the middle
- It's because we're just looking at the nearest neighbors → this causes a little yellow island to appear in the middle of the green cluster
- not so great
- fingers of the region - noisy or spurious(거짓된) data
- Central region contains mostly green points, but one yellow point in the middle
2. K-Nearest Neighbors
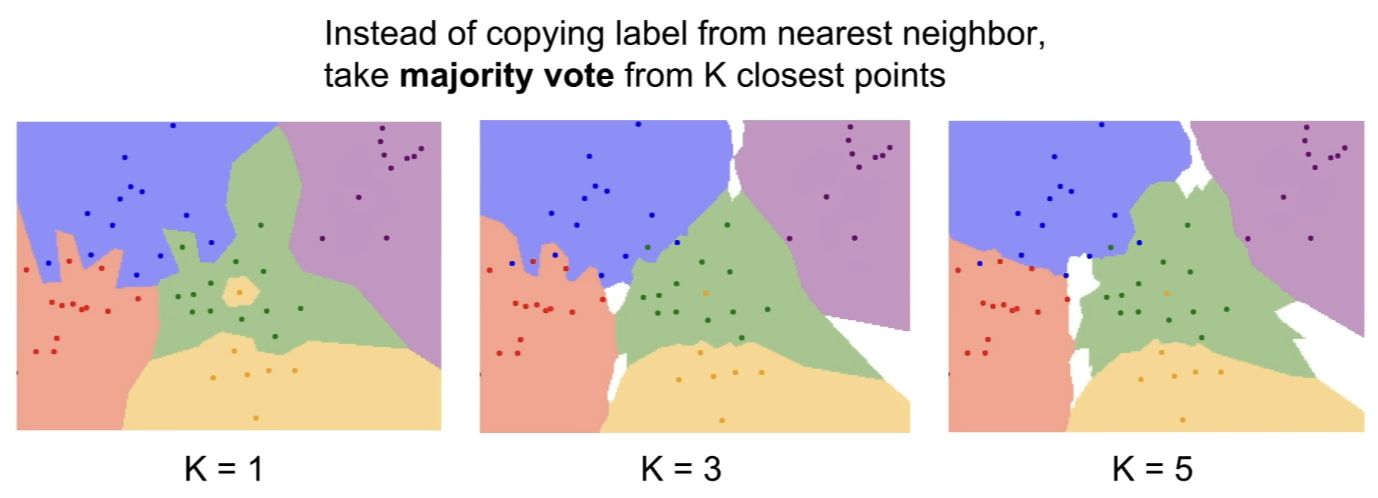
- rather than looking for a single nearest neighbor, find K of nearest neighbors, and take a vote among each of the neighbors and take the majority
- 위에서 본 두 문제가 해결됨.
- K = 3: spurious yellow point is no longer causing the point near that regions to be classified yellow, and the fingers are becoming smoothed out
- K = 5: decision boundaries became smooth
- Choosing k is important!
Distance Metric
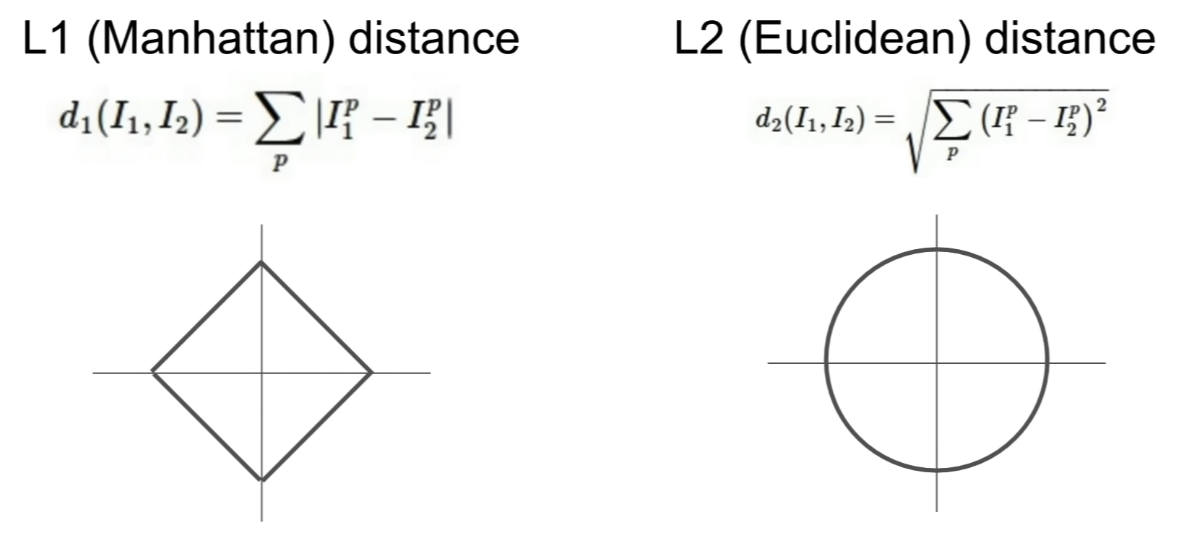
- Different metric makes different assumptions about the underlying geometry or topology that you'd expect in the space
L1 (Manhattan)
- 저 사각형 위에 있는 점들은 같은 거리임
- Depends on your choice of coordinate system.
- If you rotate the coordinate frame, it would change the L1 distance
- If the individual entries in the vector has important meaning for the task, L1 might be a more natural fit
L2 (Euclidean)
- 원 위에 있는 것들은 같은 거리
- Changing the coordinate frame doesn't matter
- If it's generic vector in some space and we don't know what they actually mean, L2 might be more natural
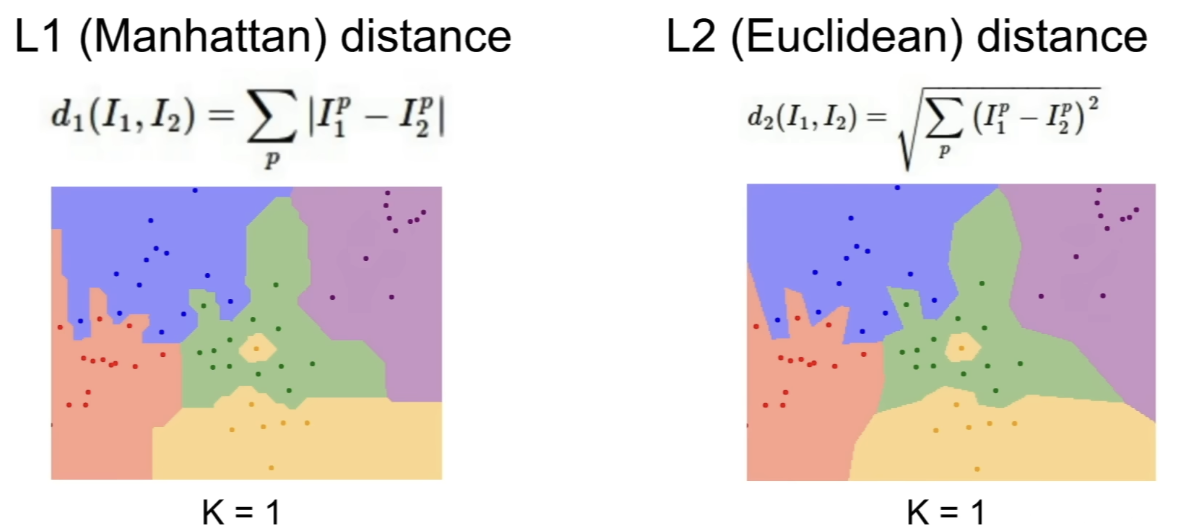
- Shapes of these decision boundaries change a bit between the two metrics
- L1 - decision boundaries tend to follow the coordinate axes (b/c L1 depends on our choice of coordinate system)
- L2 - doesn't care about the coordinate axis, puts the boundaries where they should fall naturally
Hyperparameters
- choices like K and distance metrics = hyperparameter
- Hyperparameters are not learned from the training data, but are choices about the algorithm that you make ahead of time, no way to learn them directly from the data
- how to set these things?
- very problem-dependent
- simply must try them all out and see what works best
1. Choose hyperparameters that work best on the data

- Choosing the hyperparameter that gives the best accuracy or best performance on the training data
- very terrible idea, should never do this
- ex) KNN
- if we set K = 1, we will always classify the training data perfectly
- Setting K equal to larger values will misclassify but a better performance for other datas
- In ML, we don't care about fitting the training data, we care about how our method will perform on an unseen data, after training
2. Split data into train and test

- Train algorithm with different choices of hyperparameters on the training data
- Apply that on test data and pick the set of hyperparameters that perform the best on the test data
- terrible idea, never do this
- Point of the test set is to give us some estimate of how our classifier will do on unseen data
- But selecting the one that does the best on test data?
- may have picked the right set of hyperparameter to work well on test set
- BUT performance on test set will no longer be representative of our performance on new, unseen data
3. Split data into train, val, and test

- More common way
- Choose hyperparameters on val and evaluate on test
- Put most of the data into train data
- Train the algorithm with many different choices of hyperparamters on the training set
- Evaluate on the validation set, pick the set of hyperparameters which performs best on the validation set
- After doing everything, take the best classifier and run it once on the test set
= this is the number that's actually telling you how your algorithm is doing on unseen data
4. Cross validation
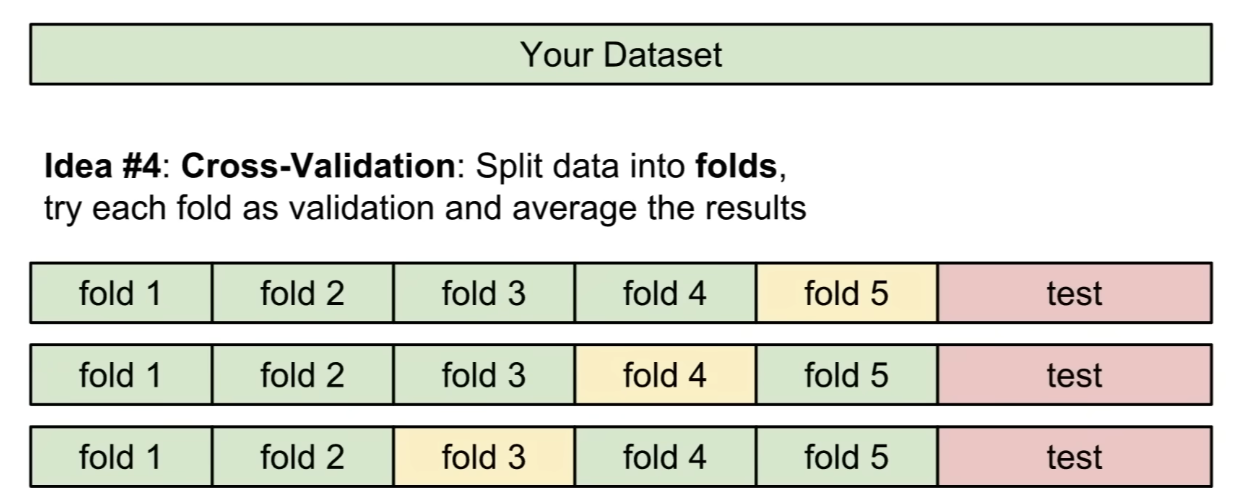
- More commonly used for small data sets, not used so much in Deep Learning
- Take the data set, and hold out some test set to use at the very end
- Rest of the data - split the training data into many different folds → cycle through choosing which fold is going to be the validation set
- ex) 5 fold cross validation - train with 1 set of hyperparameters on first 4 folds, and evaluate performance on fold 5, and retrain on folds 1, 2, 3, 5, evaluate on fold 4, and cycle through all the different folds
→ Much more confidence about which hyperparemeters are going to perform more robustly
-
When training large models, this doesn't get used in practice
-
Q: What is the difference between training and validation set?
- ex) in KNN, training set is the set of images with labels where we memorize the labels
- To classify an image, take the image, compare it to each element in the training, and transfer the label from the nearest training point
- Take each element of validation set, compare it to each element in the training data, use this to determine the accuracy of this classifier when it's applied on the validation set
- Algorithm can see the label of the training set, but doesn't have direct access to the label of validation set
- Only use the lables of validation set to check how well our algorithm is doing
-
Q: Is it possible that the test set might not be representative of data out there in the wild?
- Can be a problem in practice
- But, the underlying statistical assumption is that the data are all independently distributed. All the data points are drawn from the same underlying probability distribution.
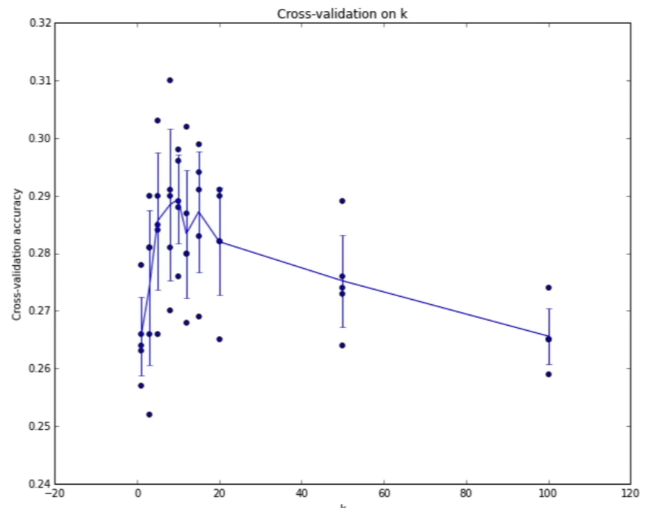
- after going through cross validation, we end up with a graph
Xaxis: value of K (KNN)Yaxis: accuracy of classifier on some dataset for different values of K
- 5 fold cross validation → each value of K, 5 different examples of how well this algorithm is doing
- in the graph above, maybe K = 7 works best for this problem
KNN is never used on images
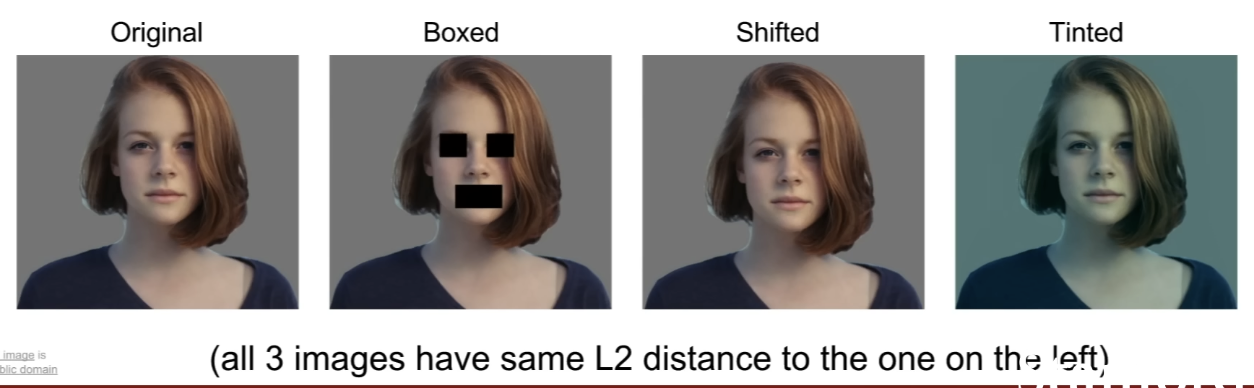
- Because of the problems above
- Very slow at test time (reverse of what we want)
- Distance metrics on pixels are not informative
- these vectorial distance functions do not correspond well to perceptual similarity between images
- Euclidean distance between (Original, Boxed), (Original, Shifted), (Original, Tinted) are all the same → may not be so good, L2 distance is not doing a good job at capturing perceptional distances between the images
- Curse of dimensionality (차원의 저주)
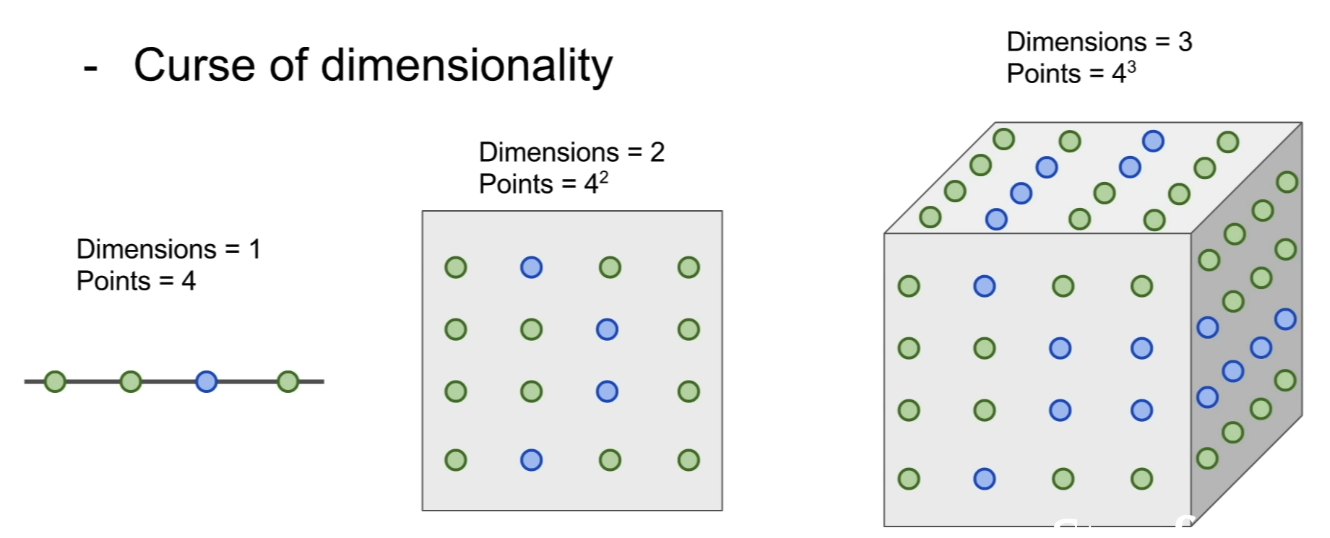
- If we want KNN to work well, we need the training set to cover the space densely, otherwise nearest neighbors could actually be far away and not be similar to our testing points
- Densely covering the space means that we need a number of training example, which is exponential in the dimension of the problem
- Exponential growth is always bad, but there is not enough images to densely cover the space of pixels in the high dimensional space
KNN: Summary
- In image classification, with a training set of images and labels, and use that to predict labels on the test set
- K-Nearest Neighbors classifier predicts labels based on nearest training examples
- Distance metric and K are hyperparameters
- Choose hyperparameters using the validation set; only run on the test set once at the very end
Linear Classification
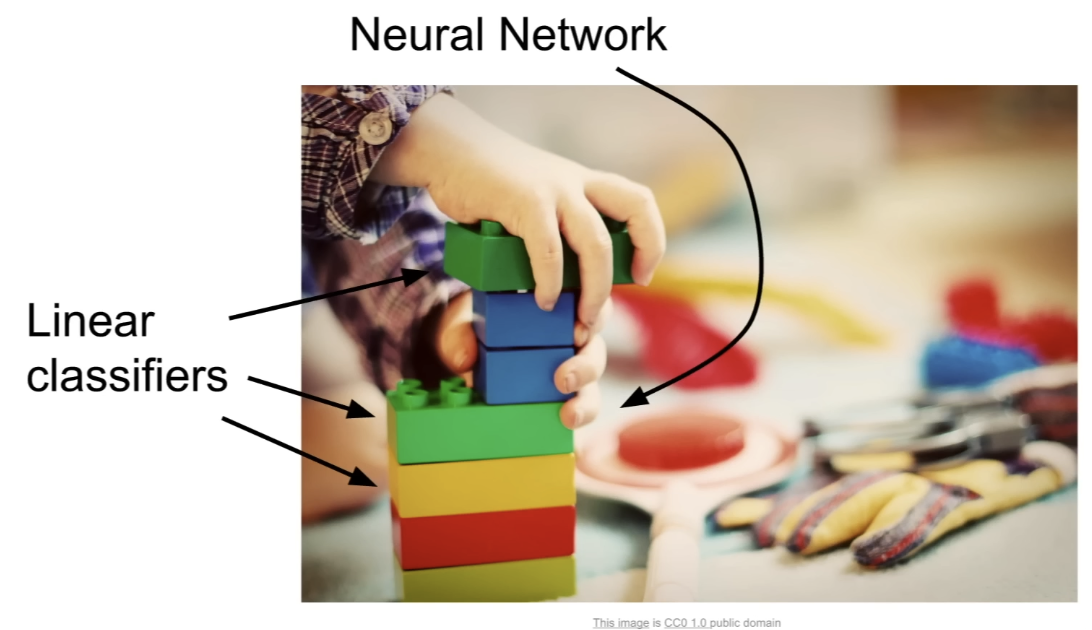
- Think of neural networks as lego blocks
- Different kinds of components of neural networks, stick them together to build large different towers of convolutional networks
- One of the most basic building blocks in different types of Deep Learning applications is linear classifier
- Understanding linear classification is important
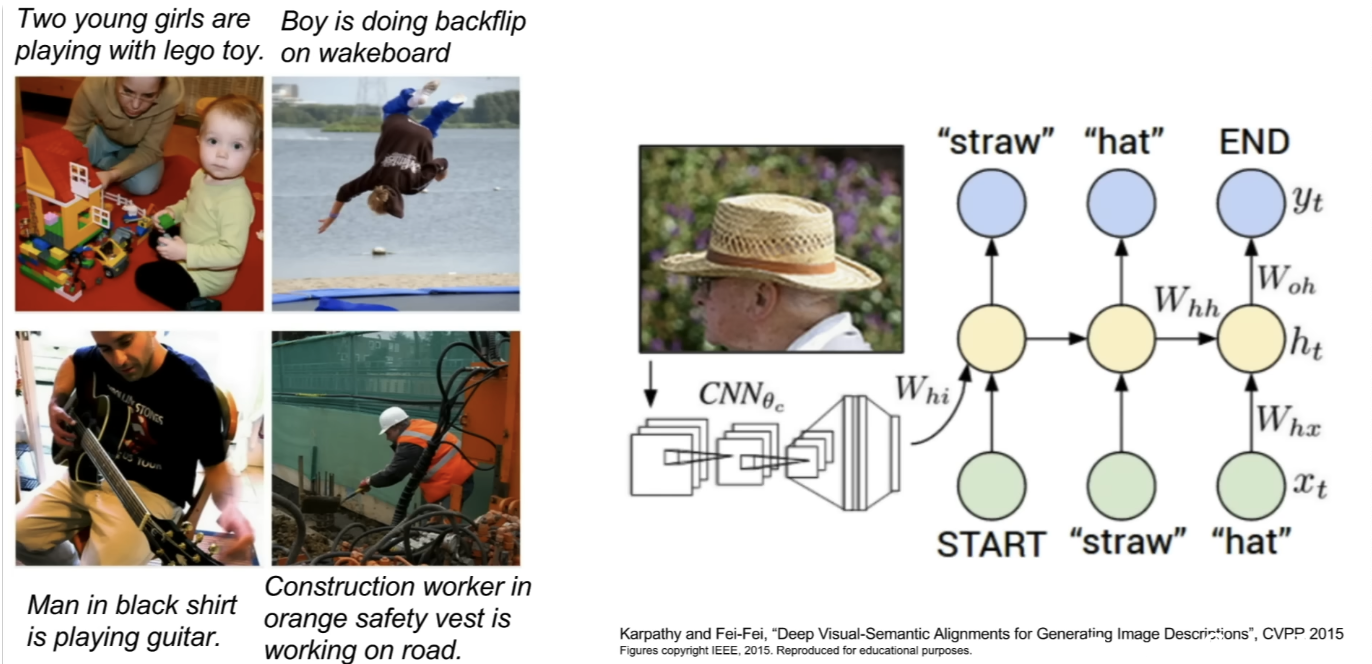
- ex) input an image and then output a descriptive sentence describing this image
- one convolutional neural network looking at the image, and a recurrent neural network that knows the language → stick these two together → train the whole thing together
Recall CIFAR-10
Parametric Approach
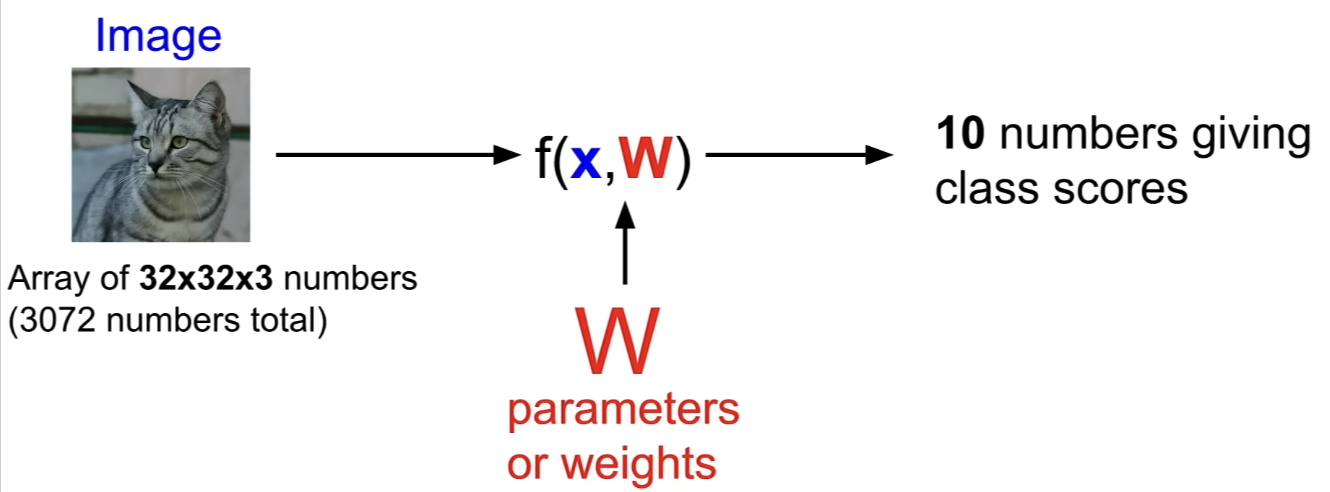
- Parametric model has two components; an image (=
X), weights(=W) - Write a function which..
- takes in both
XandW - output 10 numbers describing what the scores corresponding to the categories in CIFAR-10 (larger score = larger probability)
- takes in both
- We are going to summarize our knowledge of the training data and stick all that knowledge into the parameter
W→ test time, we only needW
⇒ More efficient, and might actually run on small devices like smartphones
Linear Classifier
- whole story in DL is coming up with the right structure for this function
F- ex) writing down different functional forms for how to combine weights and data in different complex ways, and these could correspond to different network architecture
- Simplest example of combining these two things is to multiply them = linear classifier
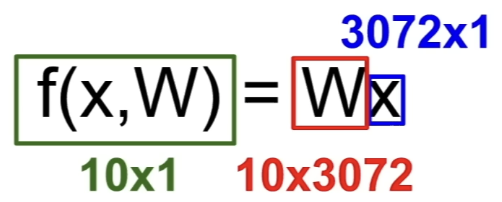
- Image was 32 x 32 x 3 value → stretch them out in a long column vector ⇒
3072by one entries - We want to end up with 10 class scores → meaning that matrix
Wneeds to be10 x 3072 - Multiply these two things →
10 x 1matrix → 10 scores
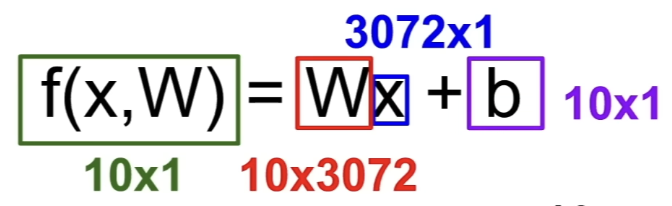
- We often add a bias term
- a constant vector of 10 elements that doesn't interact with training data
- but gives us data independent preferences for some classes over another
- If dataset had more cats than dogs → Bias element corresponding to cat would be higher than others
Example: 4 pixels of image, 3 classes
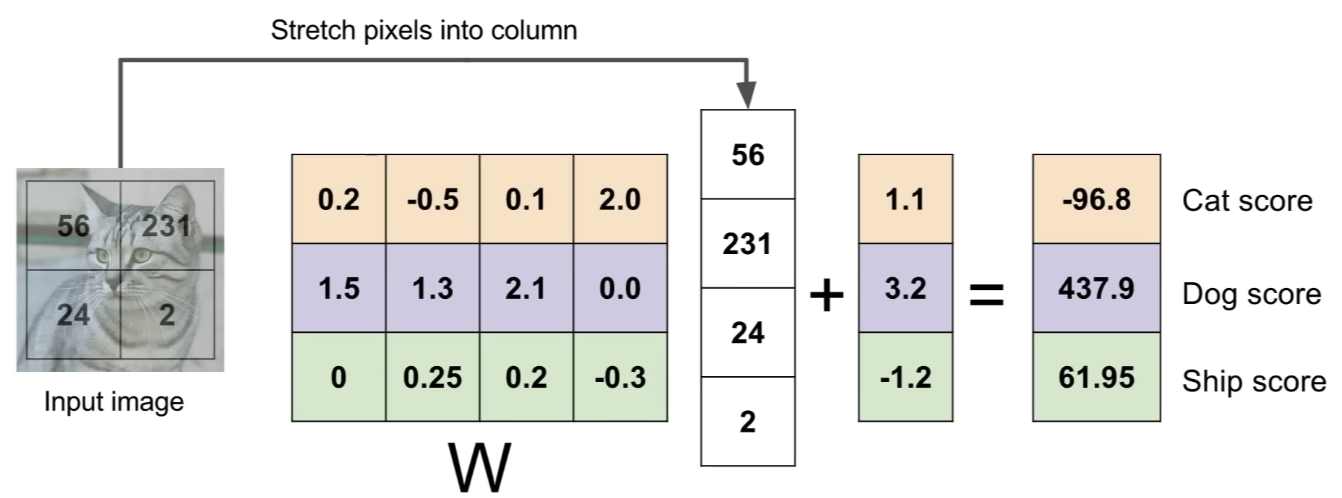
- Linear classification as kind of template matching approach
- Each row of the matrix corresponds to the template of the image
- the dot product between the row of the matrix and the column (pixels of the image) = similarity between this template for the class and the pixels of the image
- bias = data independence scaling offset for each of the classes
- from the viewpoint of template matching,
- take the rows of the
Wmatrix and unravel(매듭을 풀다) them back into images
⇒ actually visualize those templates as images
⇒ sense of what linear classifier might be doing to try to understand the data
- take the rows of the
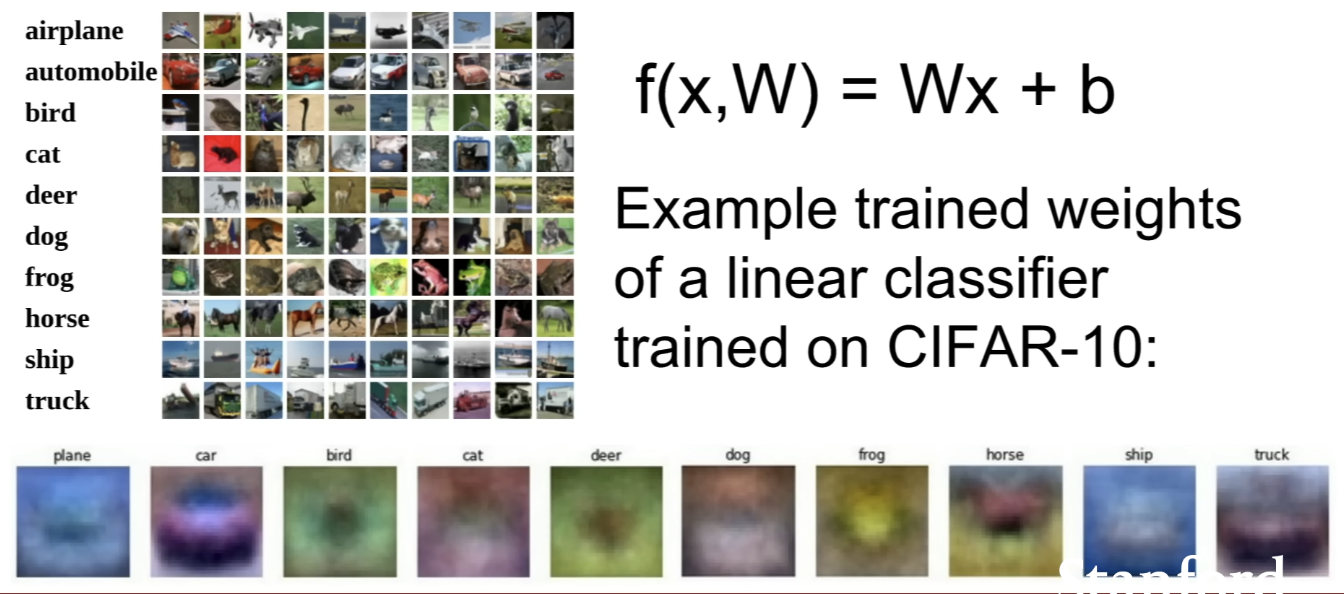
- Trained a linear classifier on the images, bottom is the visualization of the rows in the learned
Wmatrix corresponding to each of the 10 categories in CIFAR-10- template for the plane class
- consists of blue blobby thing in the middle and blue background
- meaning that the linear classifier for plane is looking for something blue and blobby → those features will cause the classifier to like planes more
- template for the car class
- red blobby thing in the middle, blue blobby thing at the top
- but this is weird and doesn't look like a car...
- Problem is that linear classifier is only learning one template for each class
⇒ If there's variation for how that class might appear, it's trying to average out all the appearances and use one single template to recognize each of those categories
- template for the plane class
- More complex models have much more better accuracy
- b/c they no longer have the restriction of learning one template per category
-
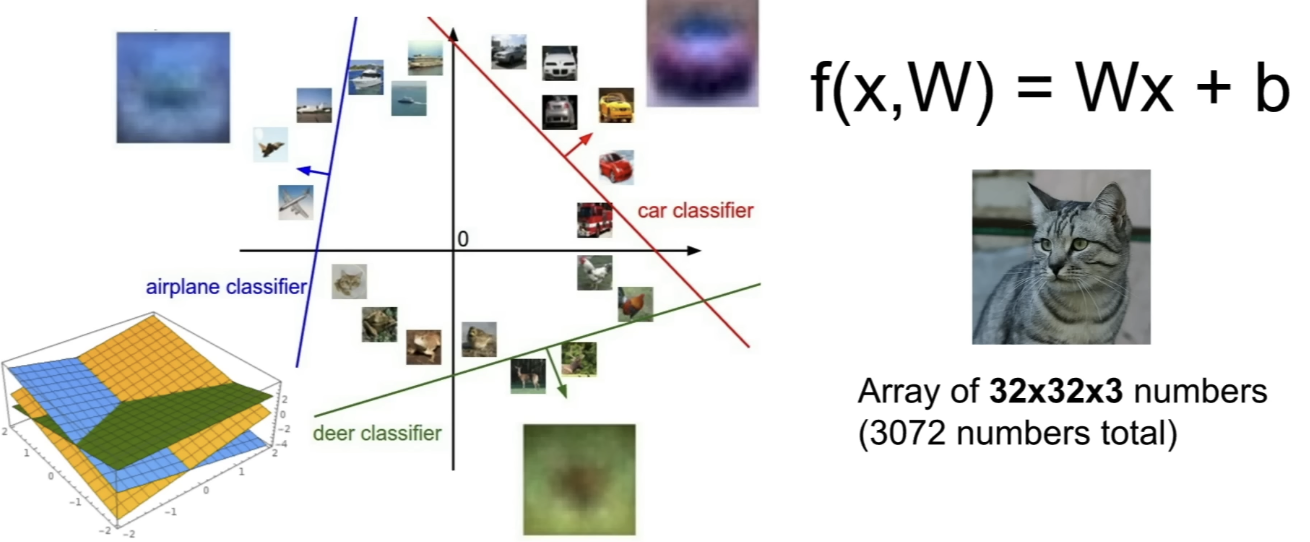
Another viewpoint of LC is to go back to the idea of images as points and high dimensional space
-
Each image is like a point in this high dimensional space
→ LC is putting in these linear decision boundaries to draw linear seperation between one category and the rest -
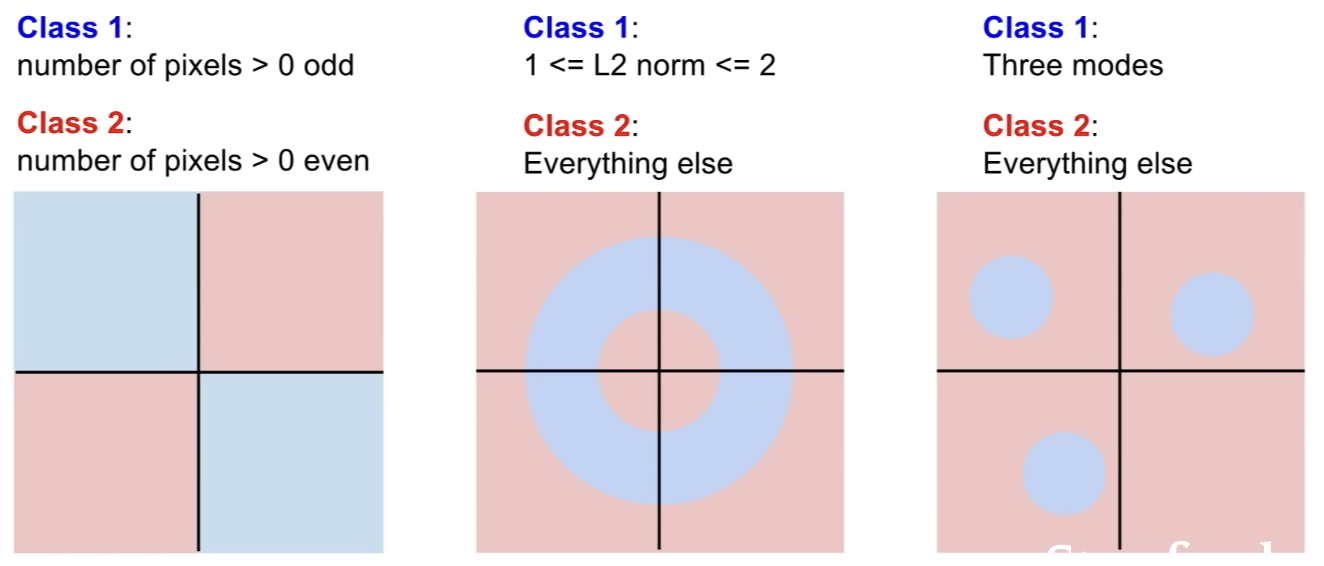
Hard cases for a linear classifier
-
dataset of two categories, blue and red
- Blue = data whose number of pixels in the image > 0 is odd
- Red = data whose number of pixels > 0 is even
- Blue classes are two quadrants of the plane
⇒ There is no way to draw a single linear line to separate the blue from the red
-
Multimodal situation (one class that can appear in different regions of space)
- blue category has 3 different islands, and everything else is red
- something like horses (horses looking at the left, horses looking at the right... )
- No good way to draw a single linear boundary between the isolated islands of data
- L1 distance는 어떤 좌표계를 선택하냐에 따라 달라진다 → ?
- Bias term의 역할은 train dataset의 분포에 맞게 하기 위함인것인가? 얘가 필요한 이유가 이해가 되지 않는다..
- weight를 template으로 바라보는 그 개념이 잘 이해가 가지 않는다.
- 이미지와 weight의 곱셈 결과 = 유사도 ??? 왜?
