We are going to use a conditional Bernoulli distribution for each vote. Let V=a vote to be read, W=an outcome sorted by the machine. The distribution of W given V is a Bernoulli distribution, i.e. W|V~Bernoulli(prob). Here is only one parameter for the probability, and we just need to assign a value for this prob.
a) Set up a Bernoulli distribution with p=0.958 if V=Park. It will generate a binary output, zero or 1. If one, send the vote to Park. If zero, to the unclassified. W will be highly likely Park but there are still some misclassified.
b) Set up a Bernoulli distribution with p=0.972 if V= Moon. It will generate a binary output, zero or one. If one, send the vote to Moon. If zero, send it to the unclassified.
c) Similar set up for Others & Unclear.
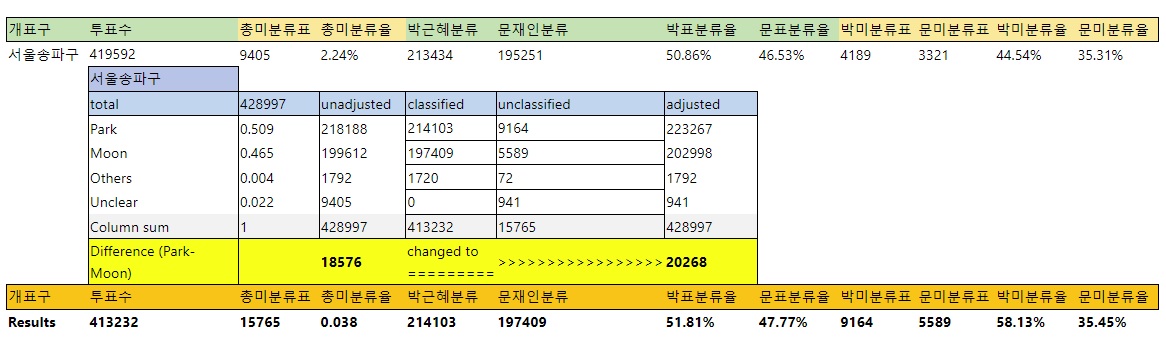
아래 송파구의 결과는, 우리가 Bernoulli distribution을 각각 표마다 사용한 것이 아니라, 기대값으로 "classified" & "unclassified"를 처리한 것입니다 (through a Binomial distribution).
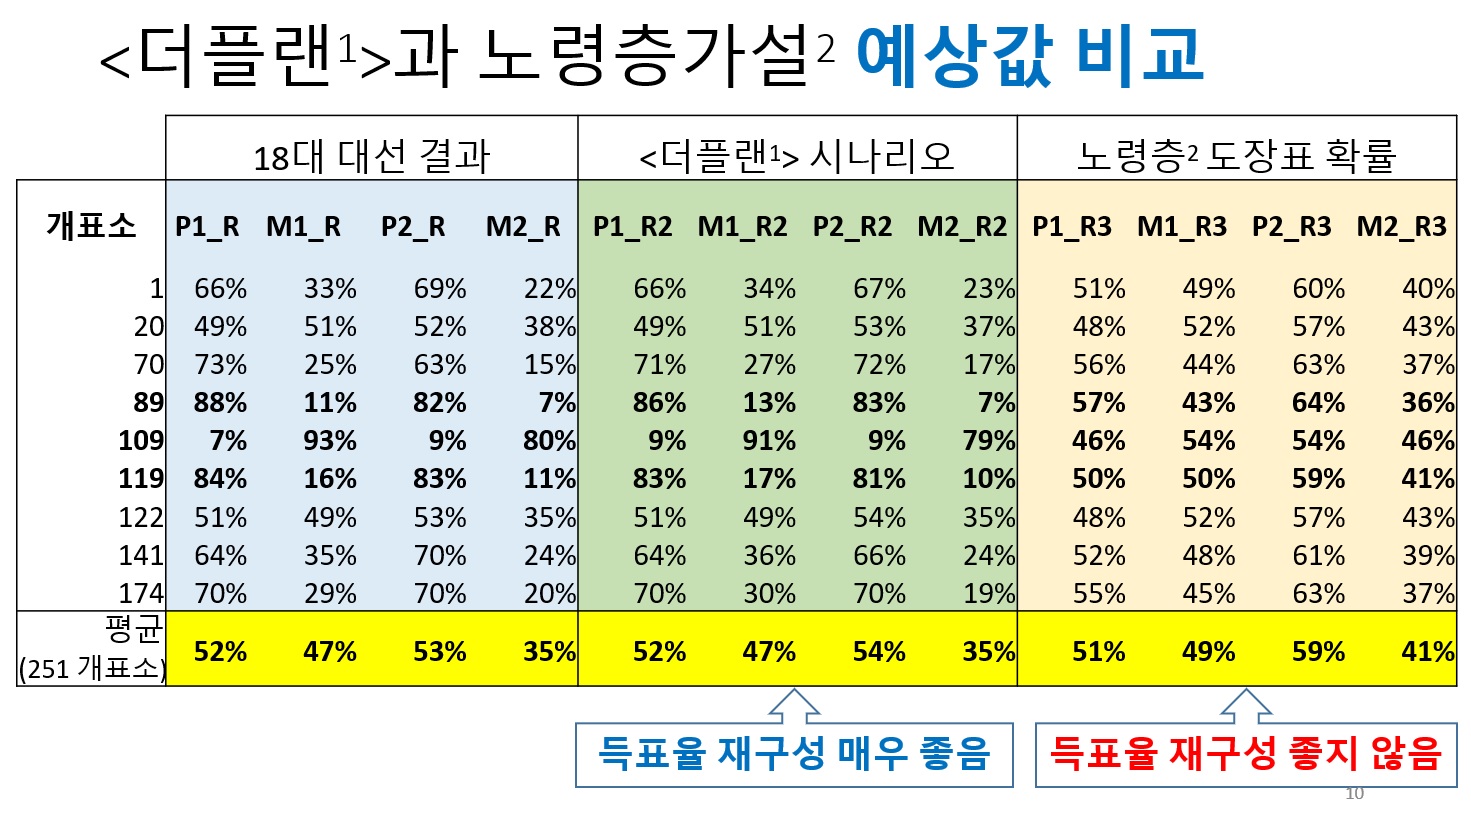
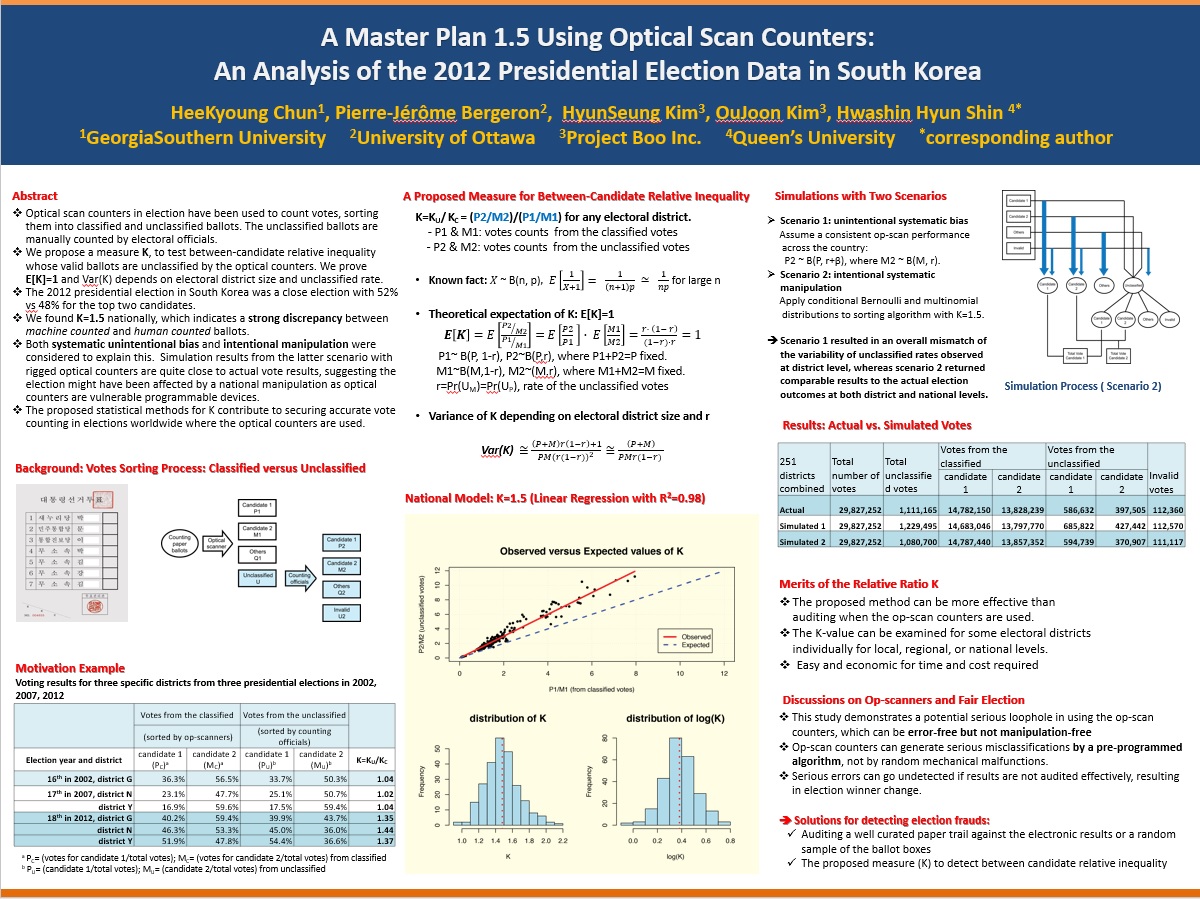
Scenario 1: unintentional systematic bias. Assume a consistent op-scan performance across the country: P2 ~ B(P, r+β), where M2 ~ B(M, r).
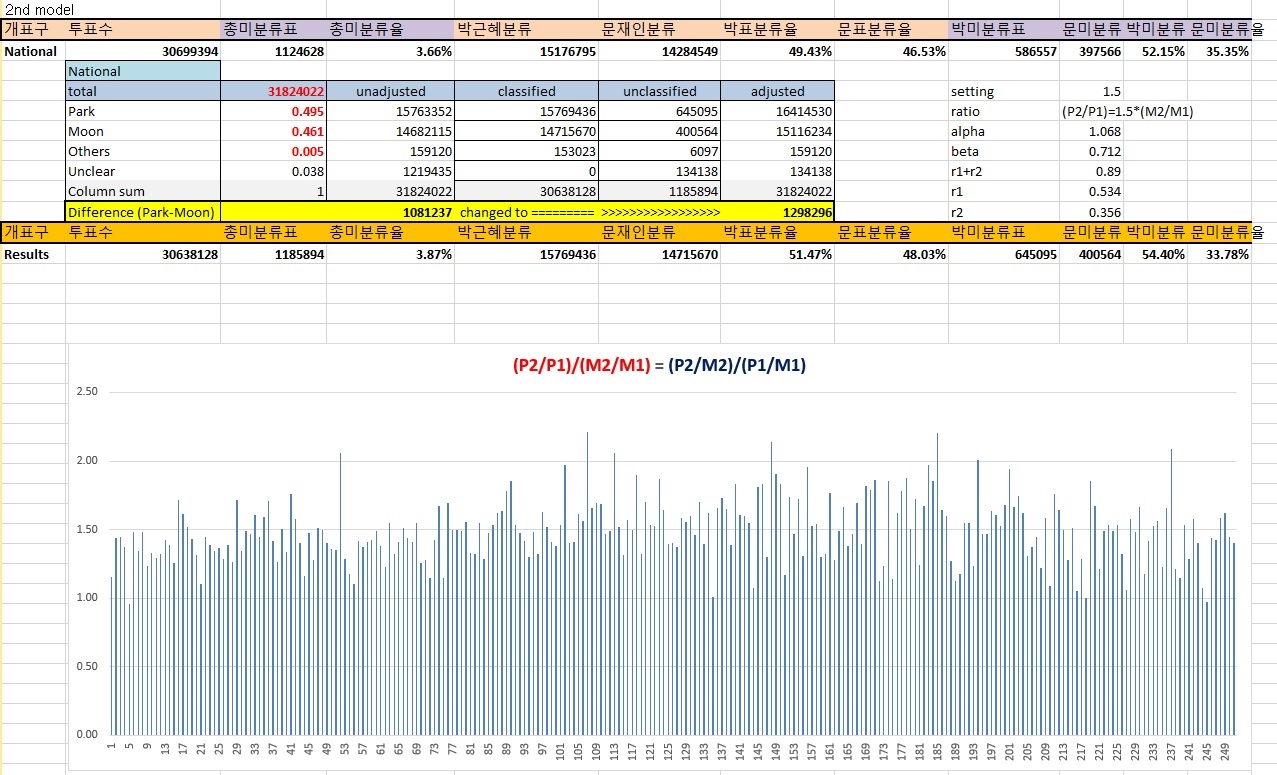
Scenario 2: intentional systematic manipulation
Apply conditional Bernoulli and multinomial distributions to sorting algorithm with K=1.5.
Scenario 1 resulted in an overall mismatch of the variability of unclassified rates observed at district level, whereas scenario 2 returned comparable results to the actual election outcomes at both district and national levels.
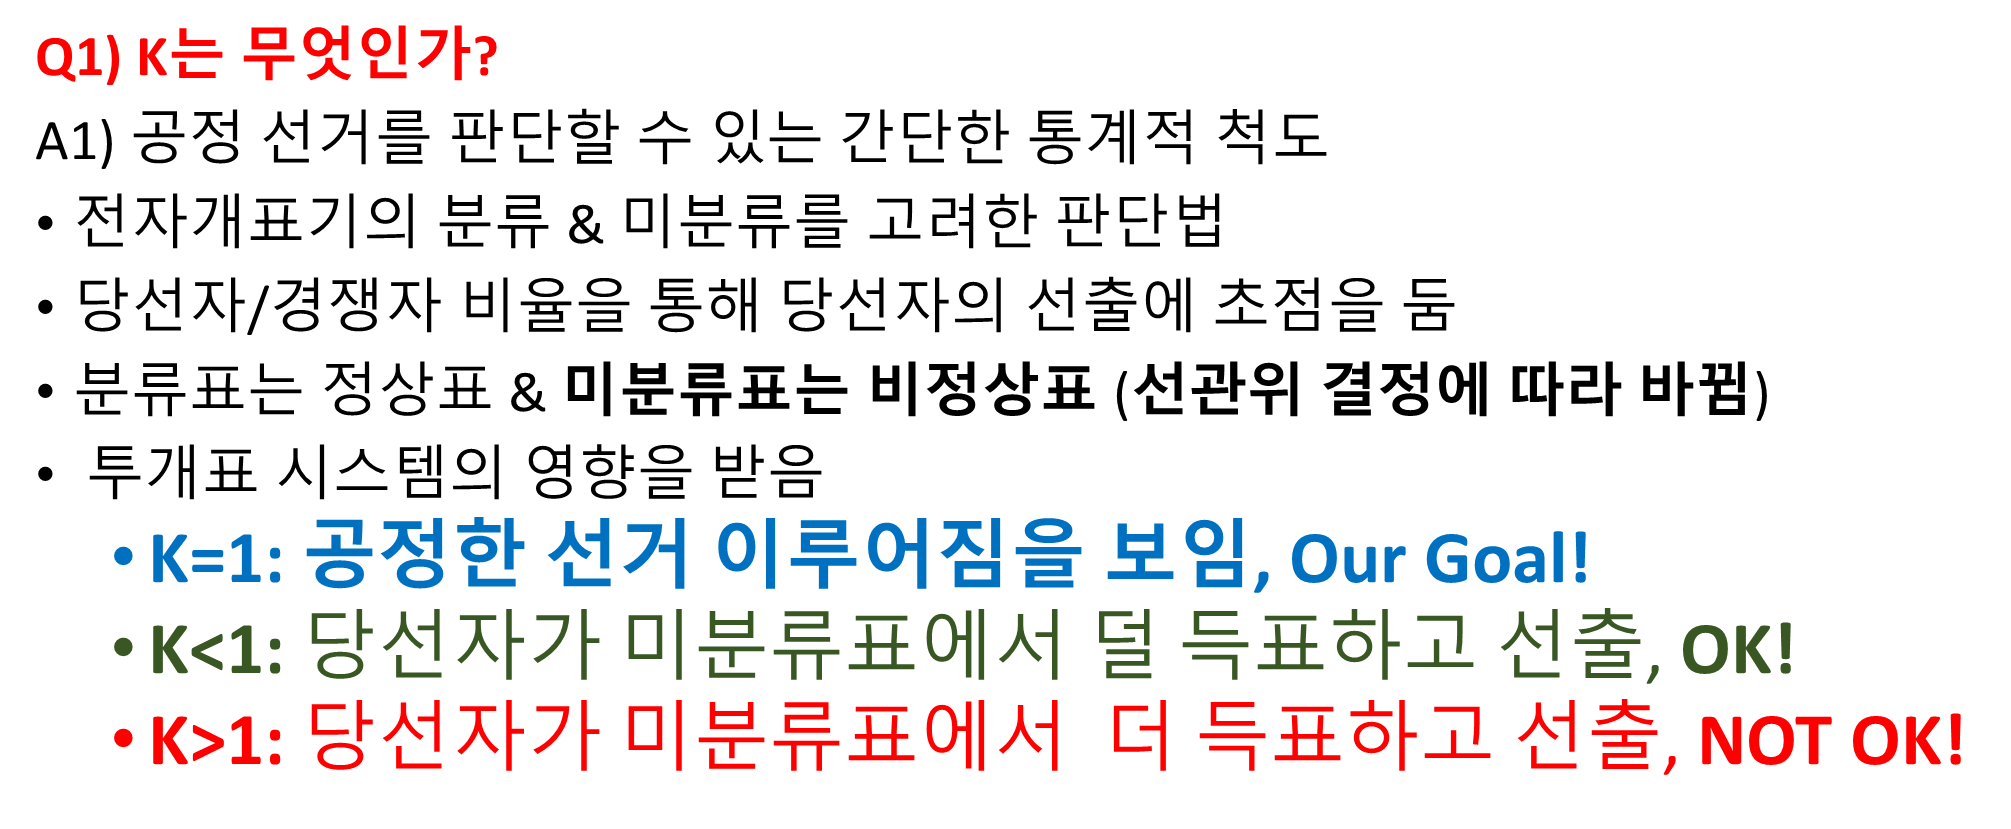
K>1 당선자가 비정상표인 미분류표 더 받고 당선. 미분류표 원인 규명 필요. (*특히 박빙의 선거에서)