설치를 위한 환경 세팅
yum -y install git
- 로컬 저장소 생성
git init monitoring
git config --global init.defaultBranch main
cd monitoring
- remote 추가 ([root@k8s-master monitoring]*#)
git remote add -f origin https://github.com/k8s-1pro/install.git
- checkout 설정
git config core.sparseCheckout true
echo "ground/k8s-1.27/prometheus-2.44.0" >> .git/info/sparse-checkout
echo "ground/k8s-1.27/loki-stack-2.6.1" >> .git/info/sparse-checkout
- pull
git pull origin main
Prometheus & Grafana 설치
- 설치 (monitoring 디렉토리 들어가서 설치) pwd ⇒ /root/monitoring
kubectl apply --server-side -f ground/k8s-1.27/prometheus-2.44.0/manifests/setup
kubectl wait --for condition=Established --all CustomResourceDefinition --namespace=monitoring
kubectl apply -f ground/k8s-1.27/prometheus-2.44.0/manifests
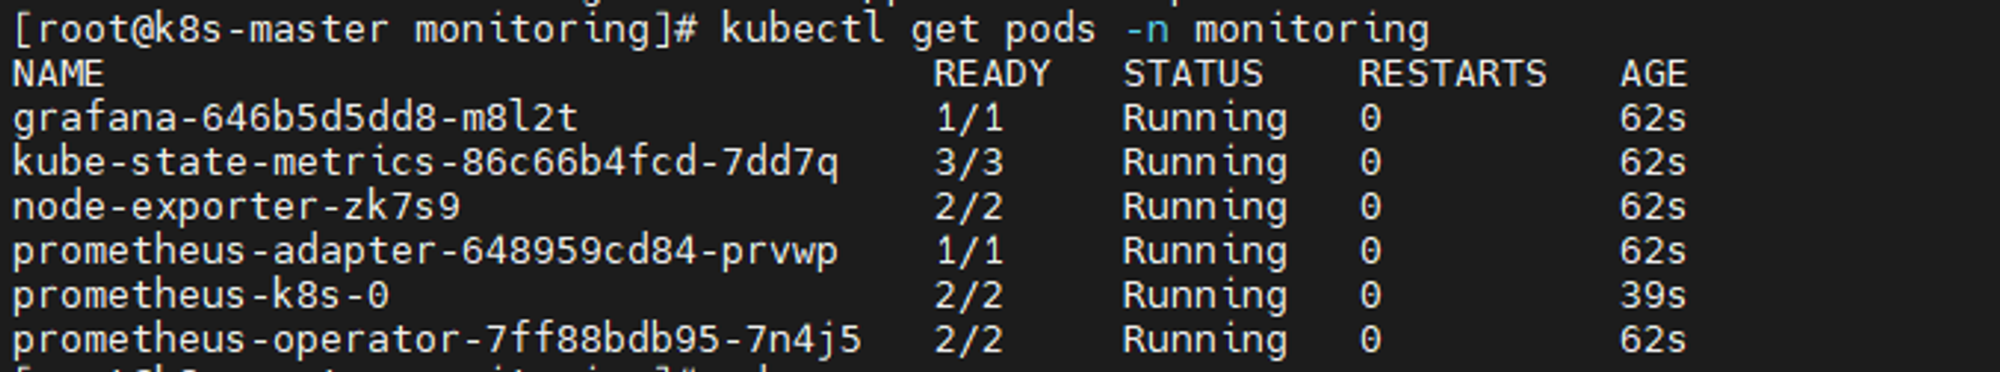
- 설치확인
kubectl get pods -n monitoring
Loki-Stack 설치
- 로깅을 위한 툴
- 설치 (monitoring 디렉토리 들어가서 설치)
kubectl apply -f ground/k8s-1.27/loki-stack-2.6.1
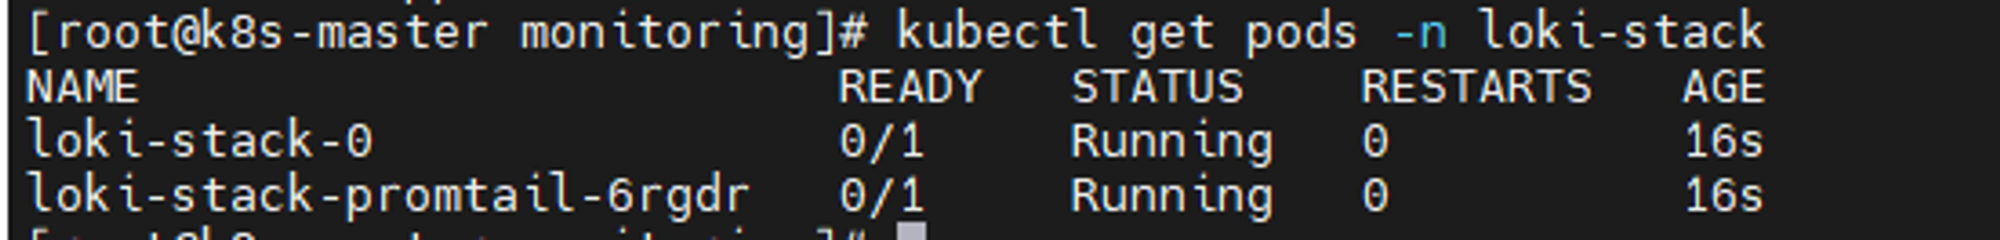
- 설치 확인
그라파나 접속
주소창에 http://192.168.56.30:30001
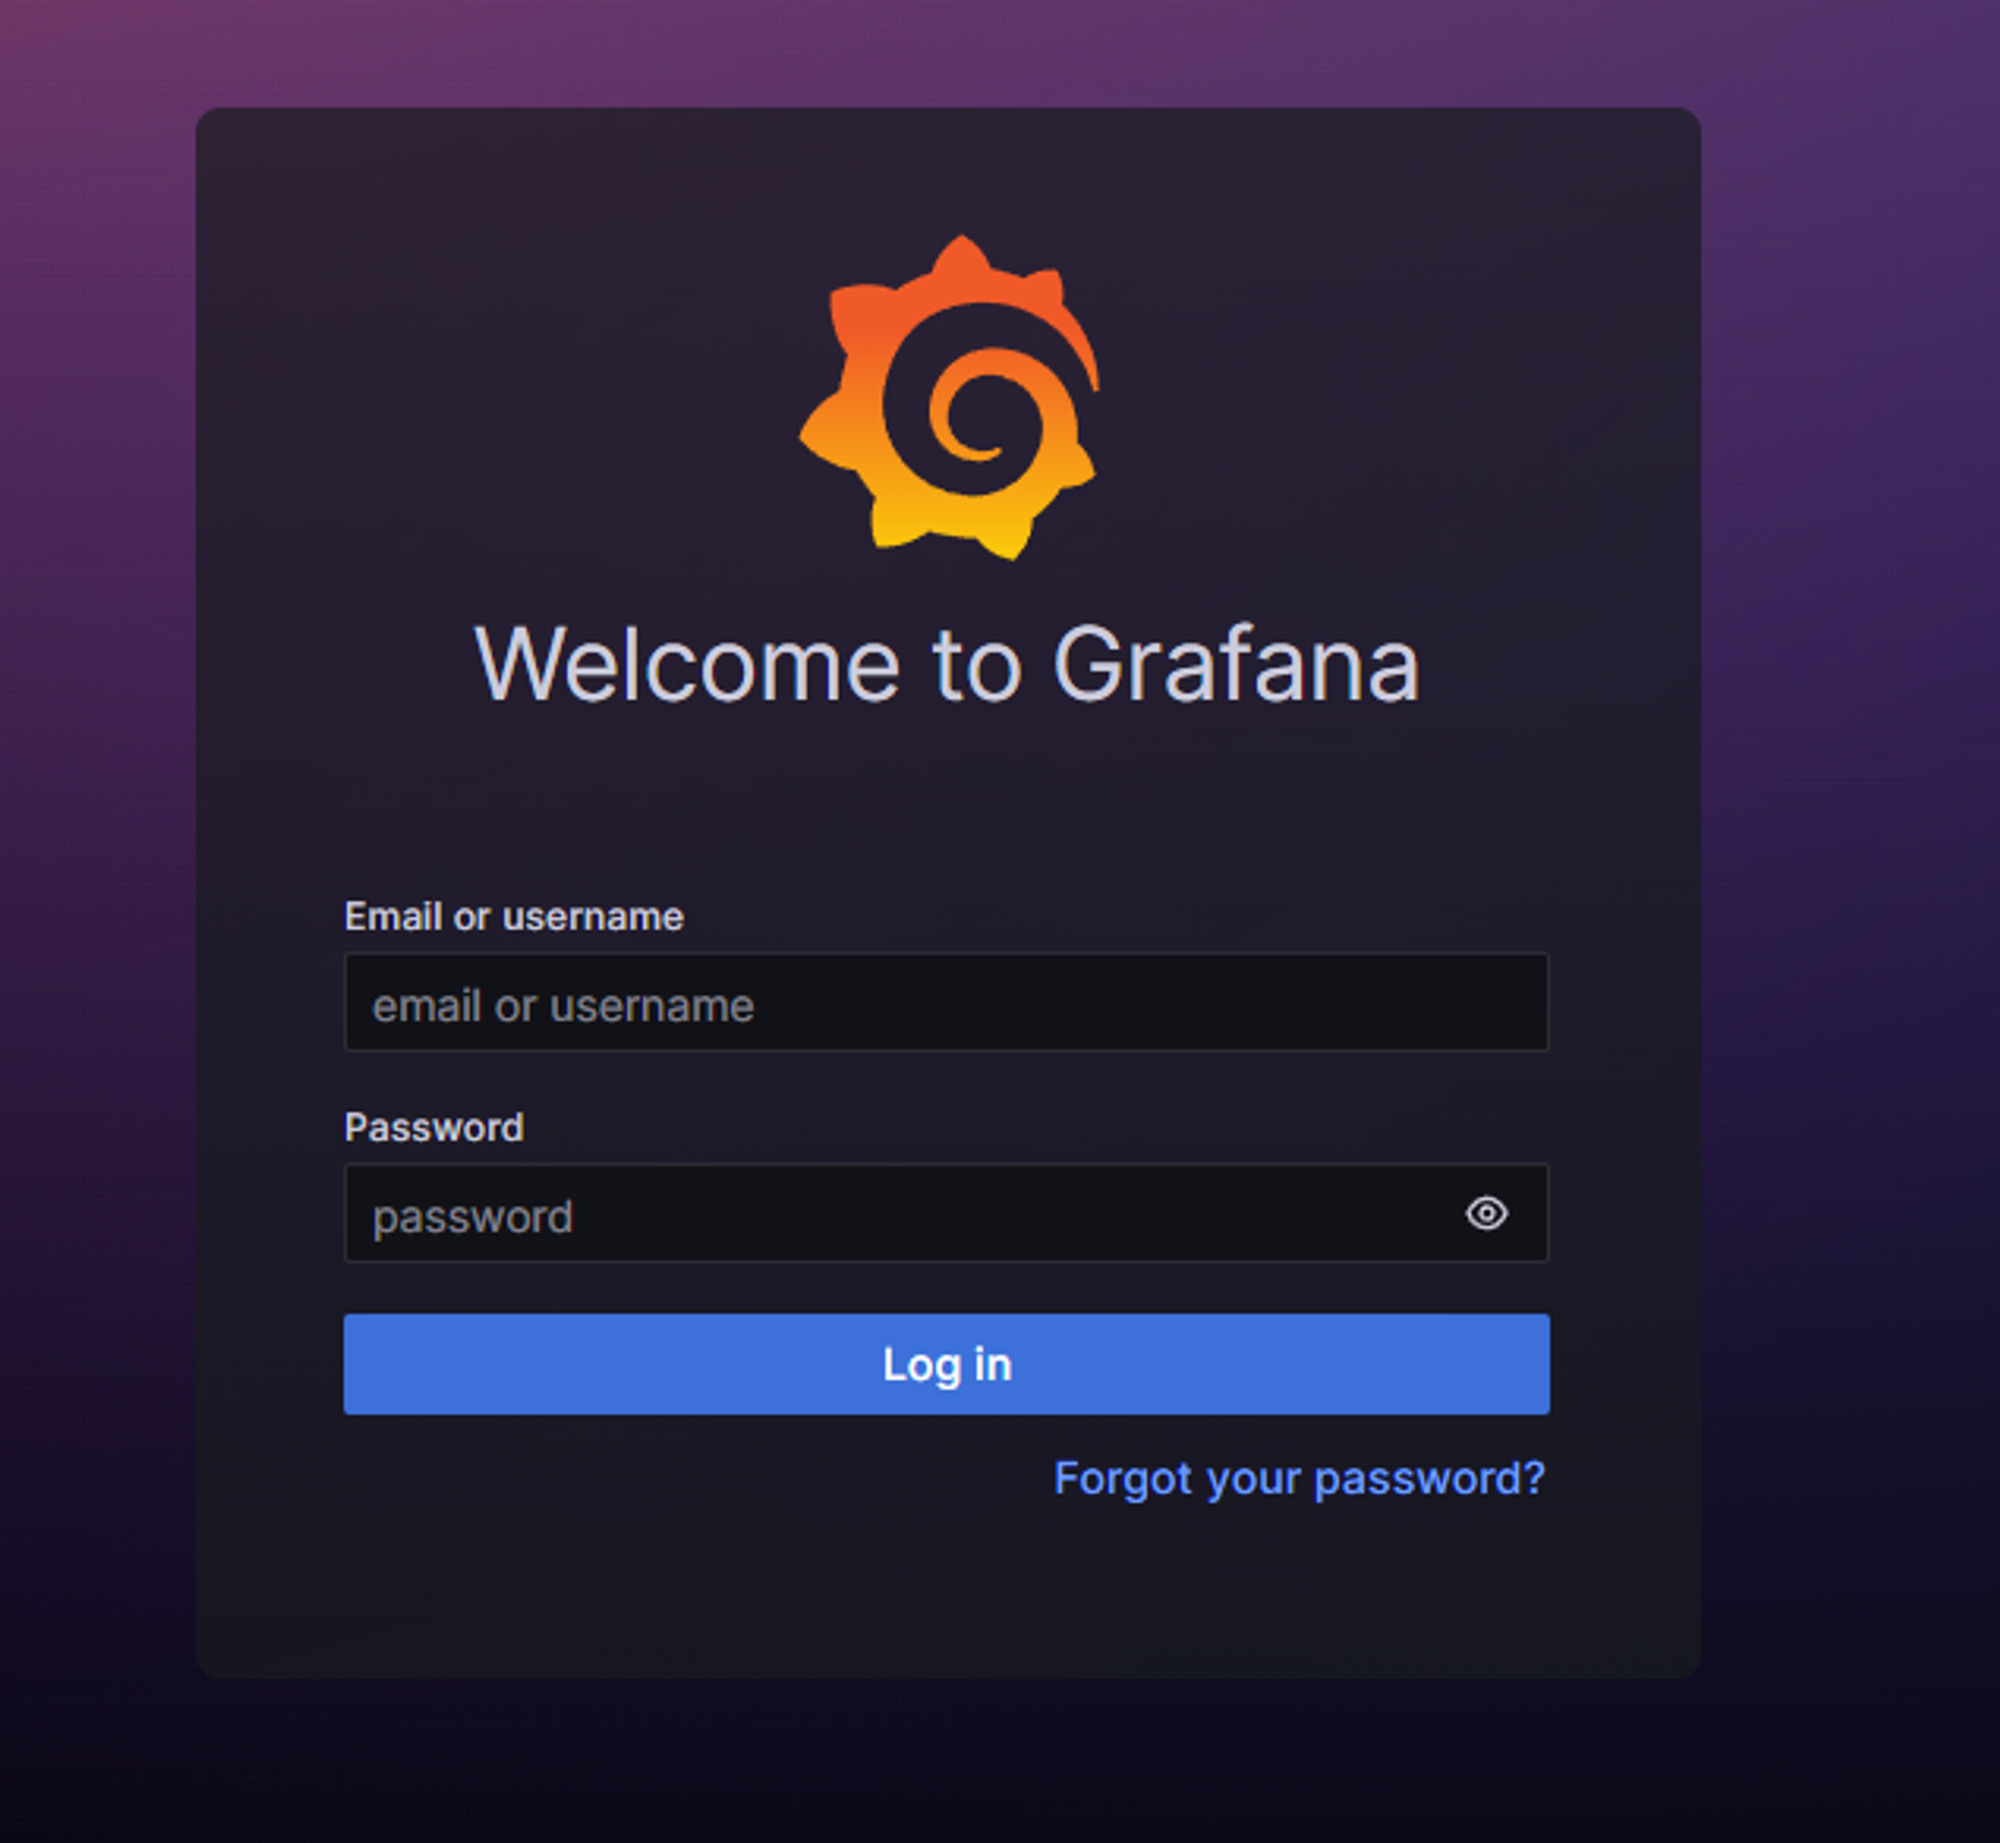
id,pw 입력
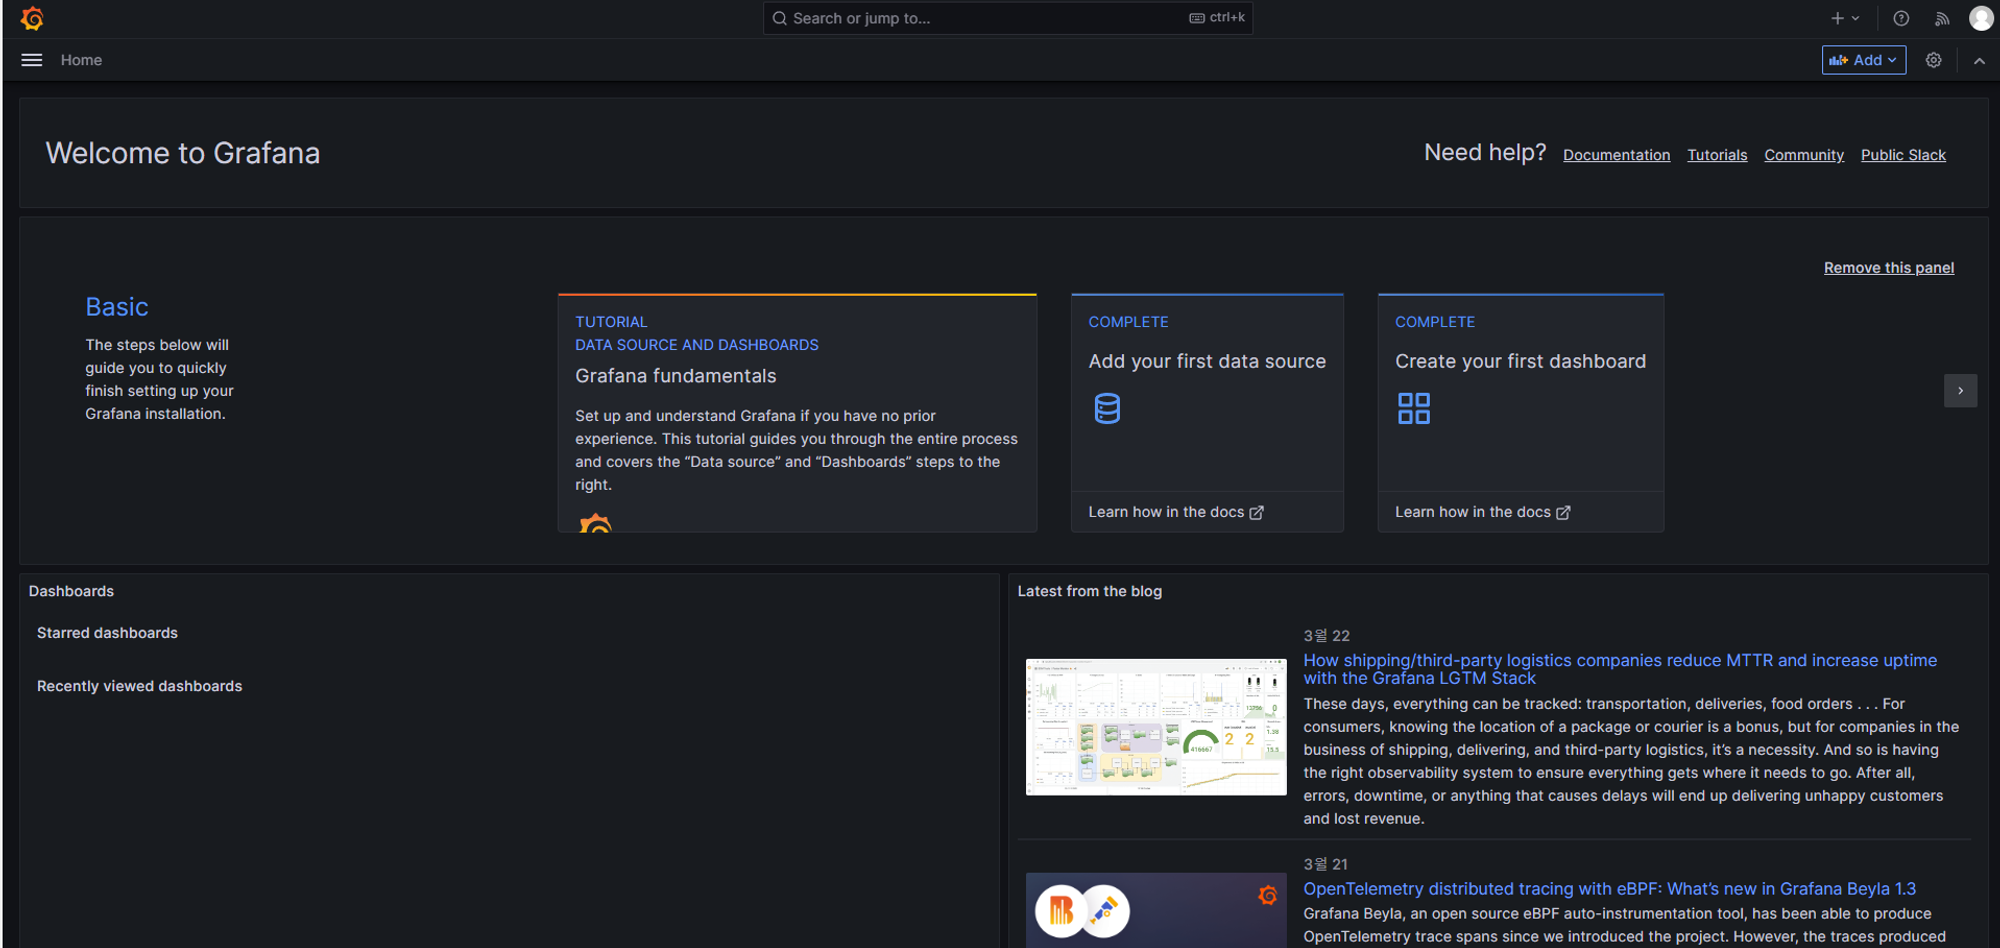
접속 완료
그라파나에서 로키스택 연결
- 프로메테우스는 자동으로 연결이 되지만 로키스택은 추가로 연결을 해줘야 됨
- 왼쪽 위 home → connections 누른 뒤 loki 검색
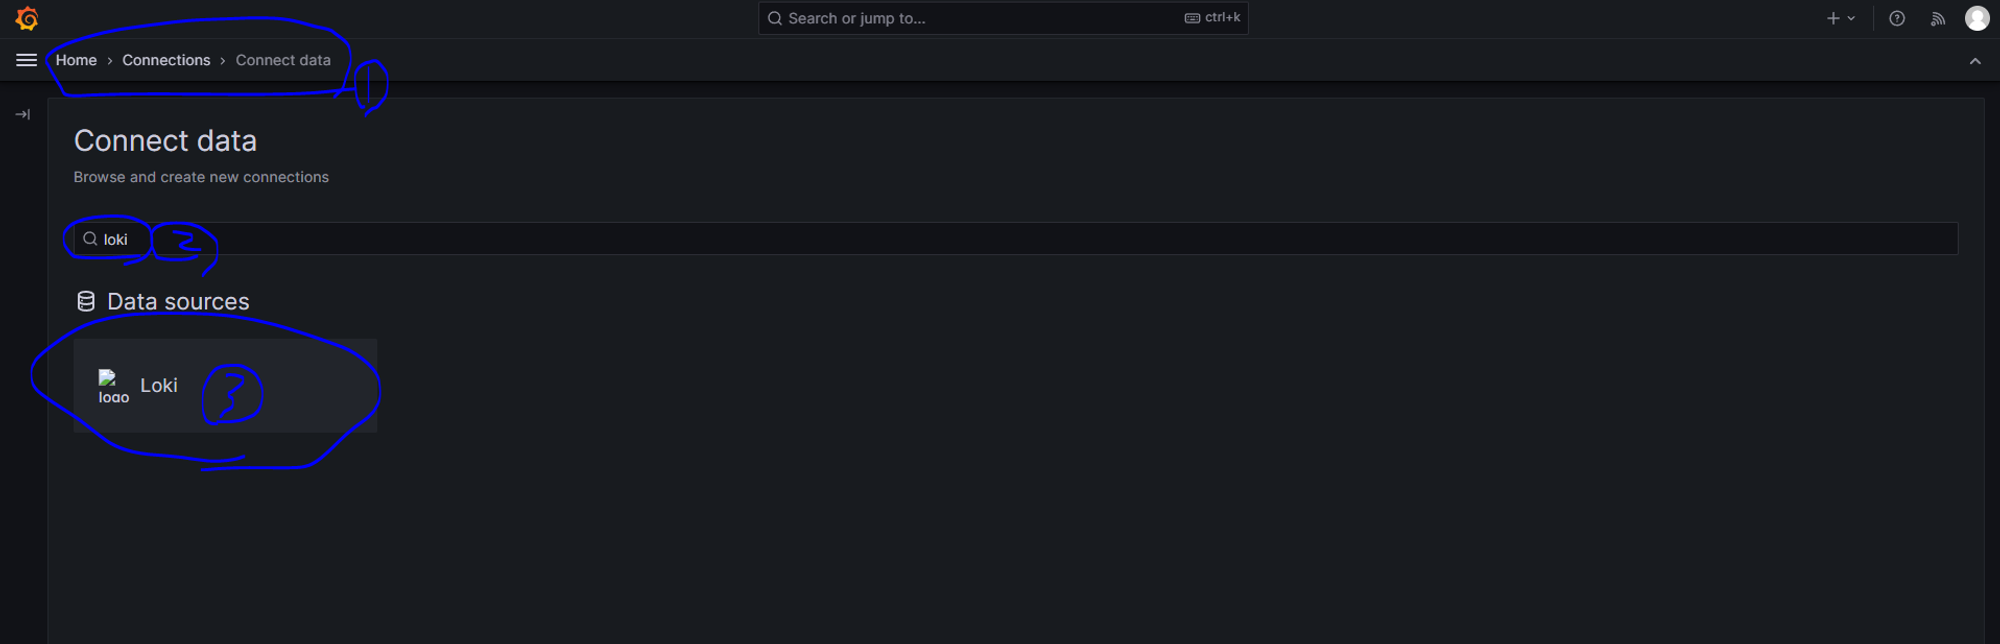
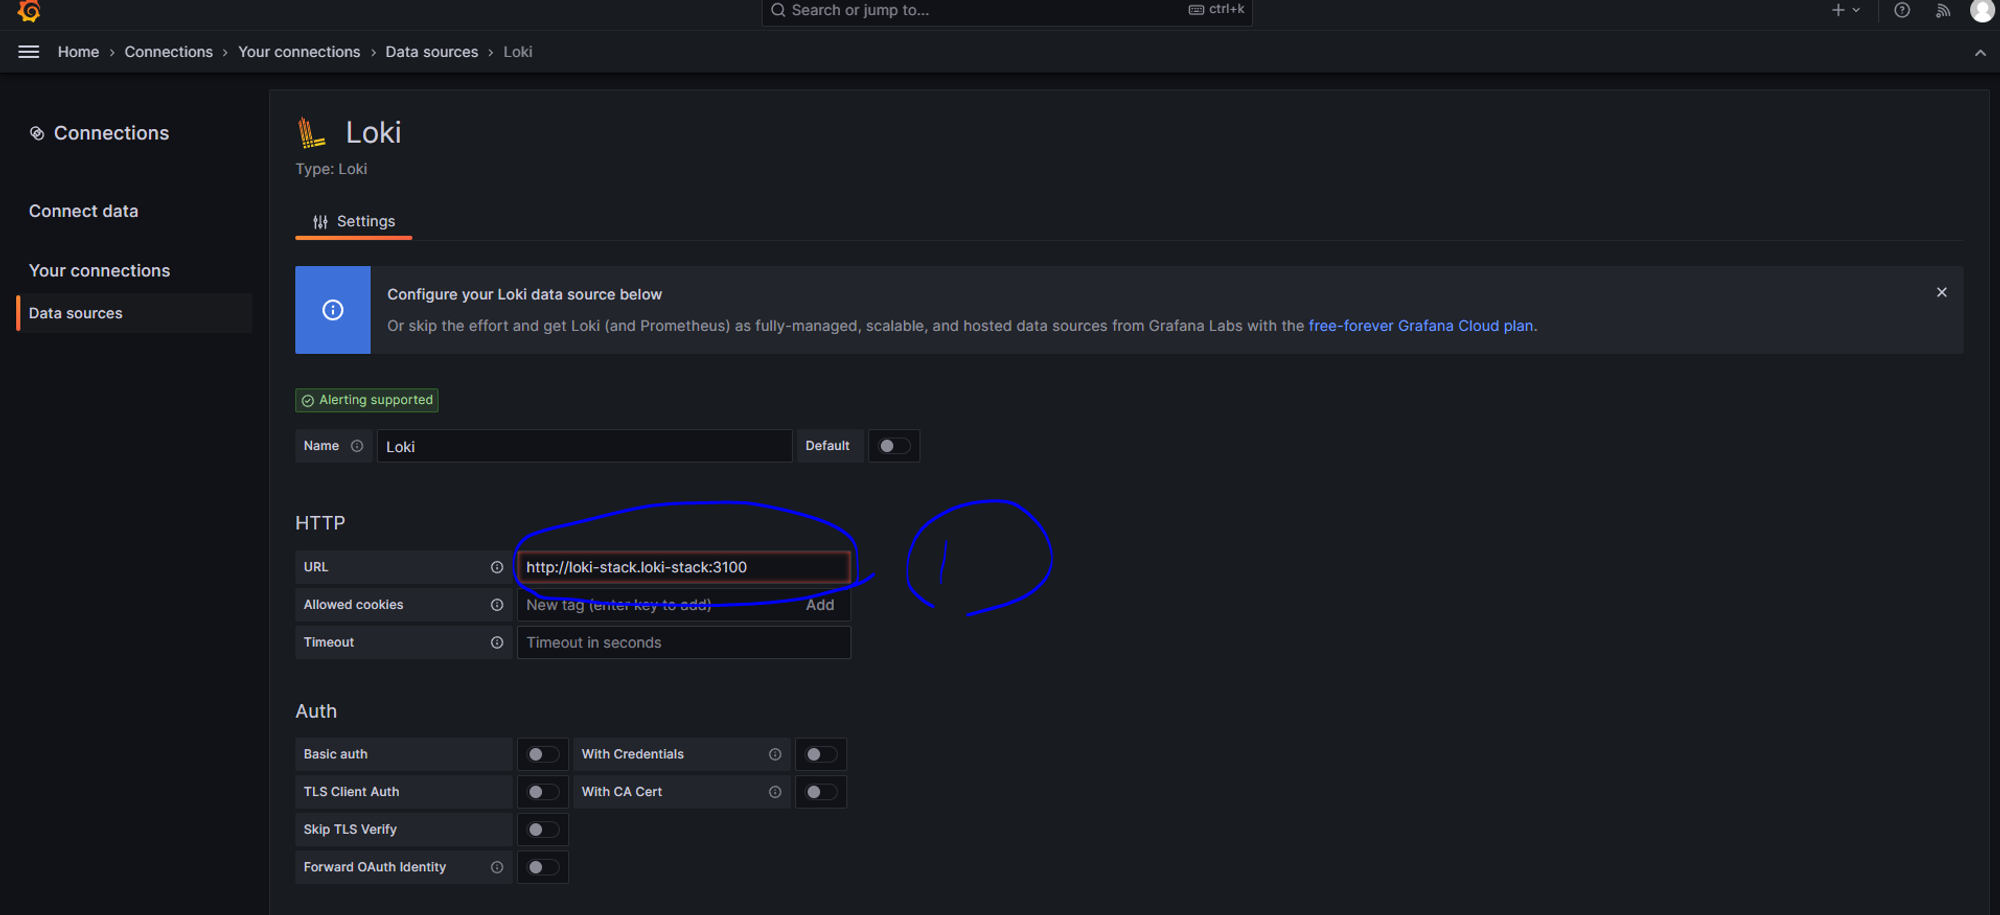
왼쪽위 화살표늘 누른뒤 Data sources를 누른뒤 파란색 add버튼 누른다.

로키눌러서 접속 후 URL에 http://loki-stack.loki-stack:3100 입력 후 하단에 save & test 클릭
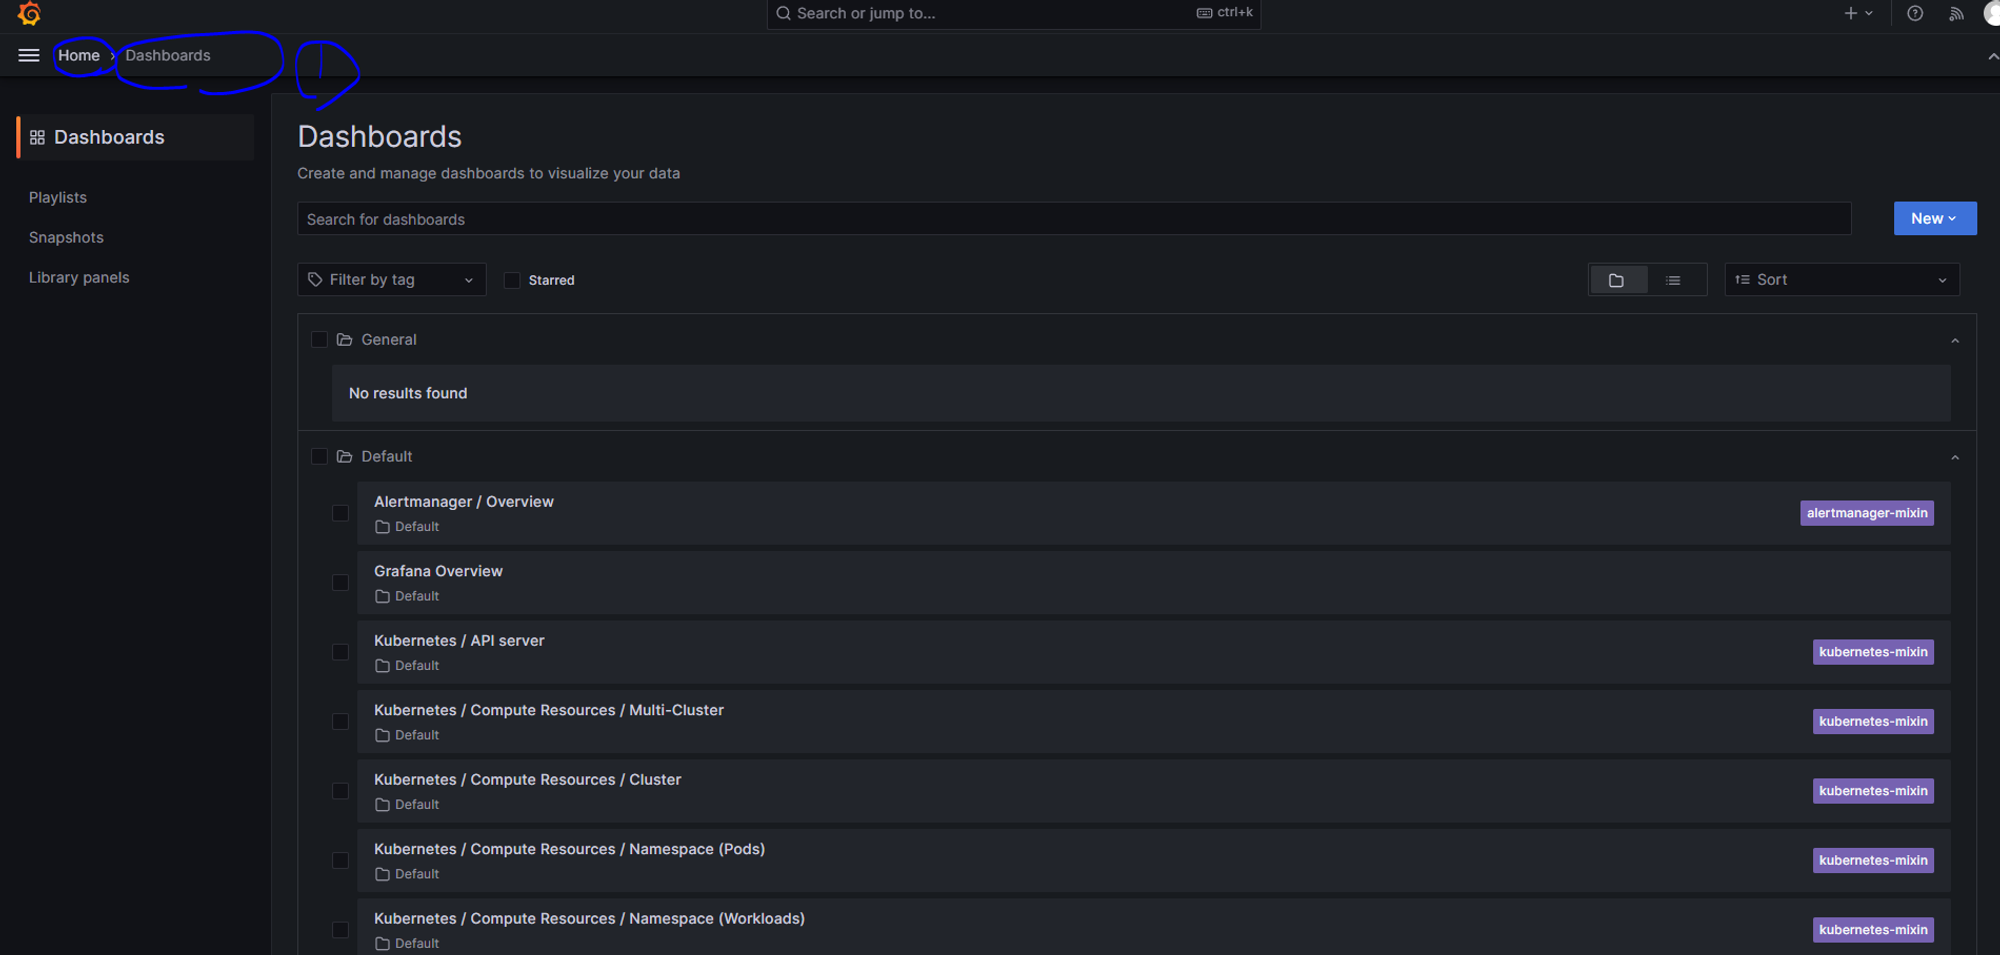
초기화면으로 돌아간 후 대시보드로 들어가면 모니터링 화면들이 생성 된다.
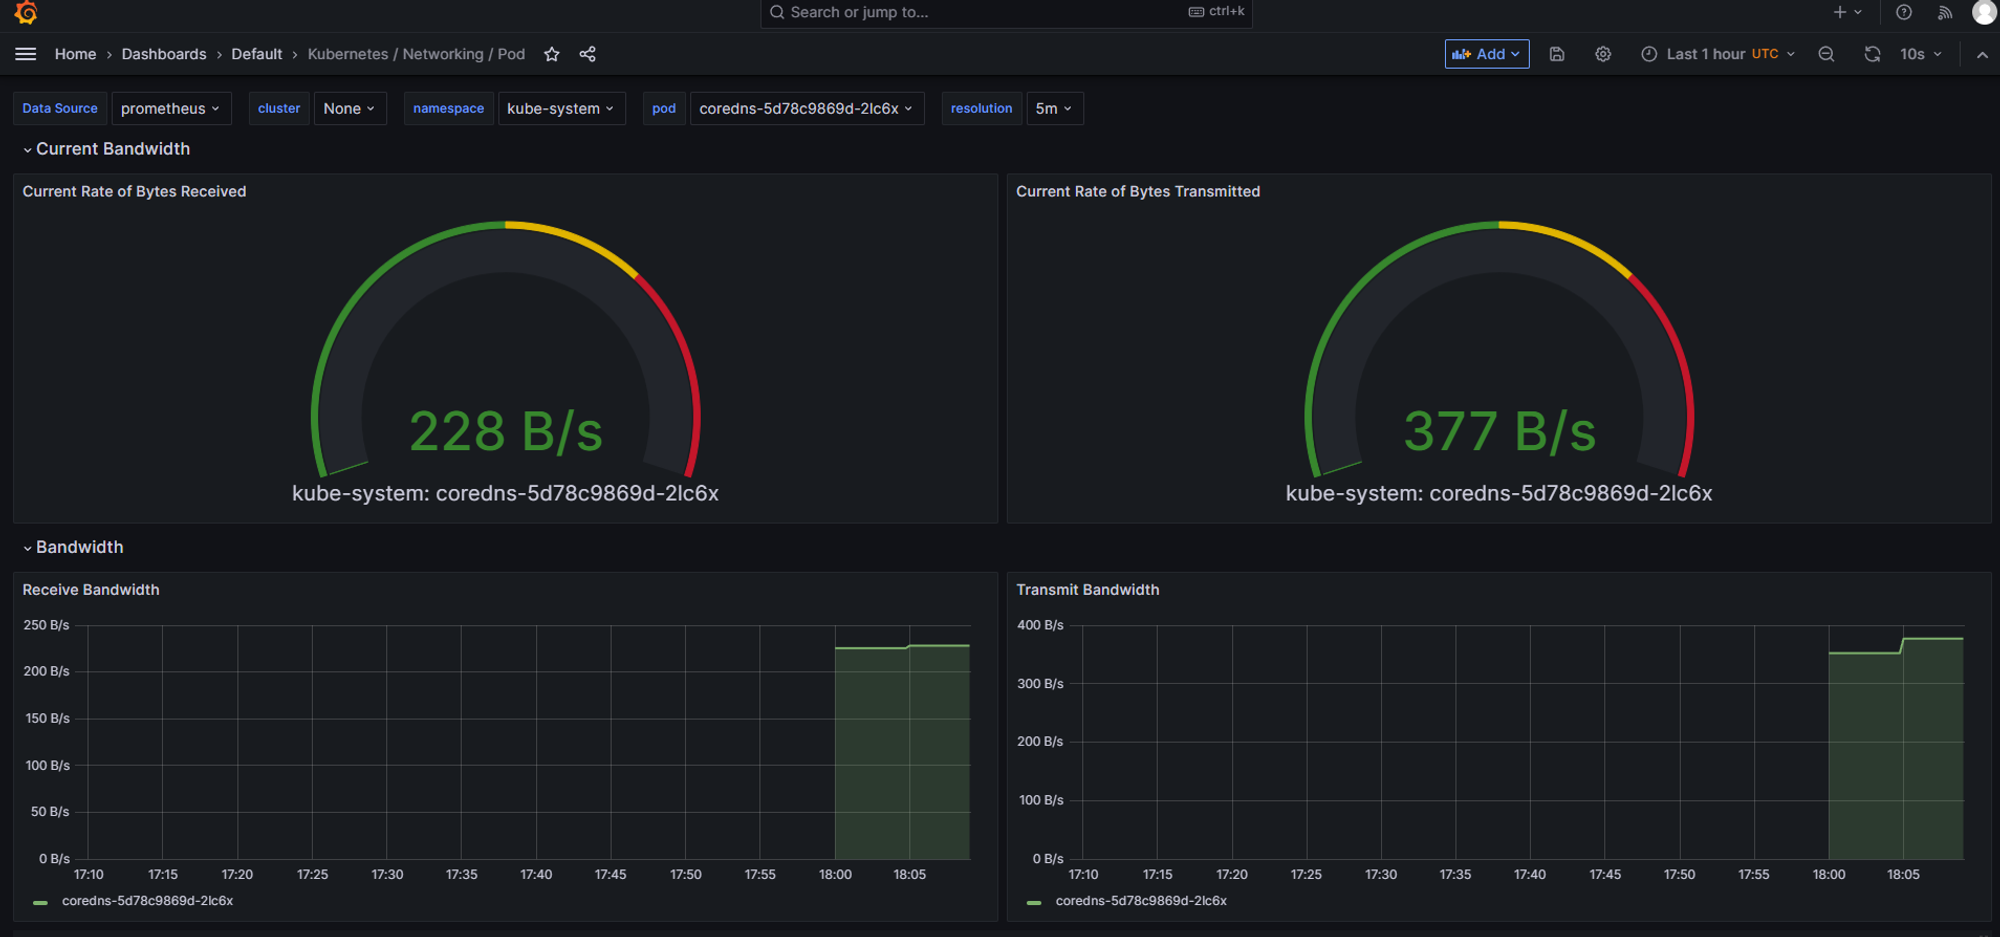
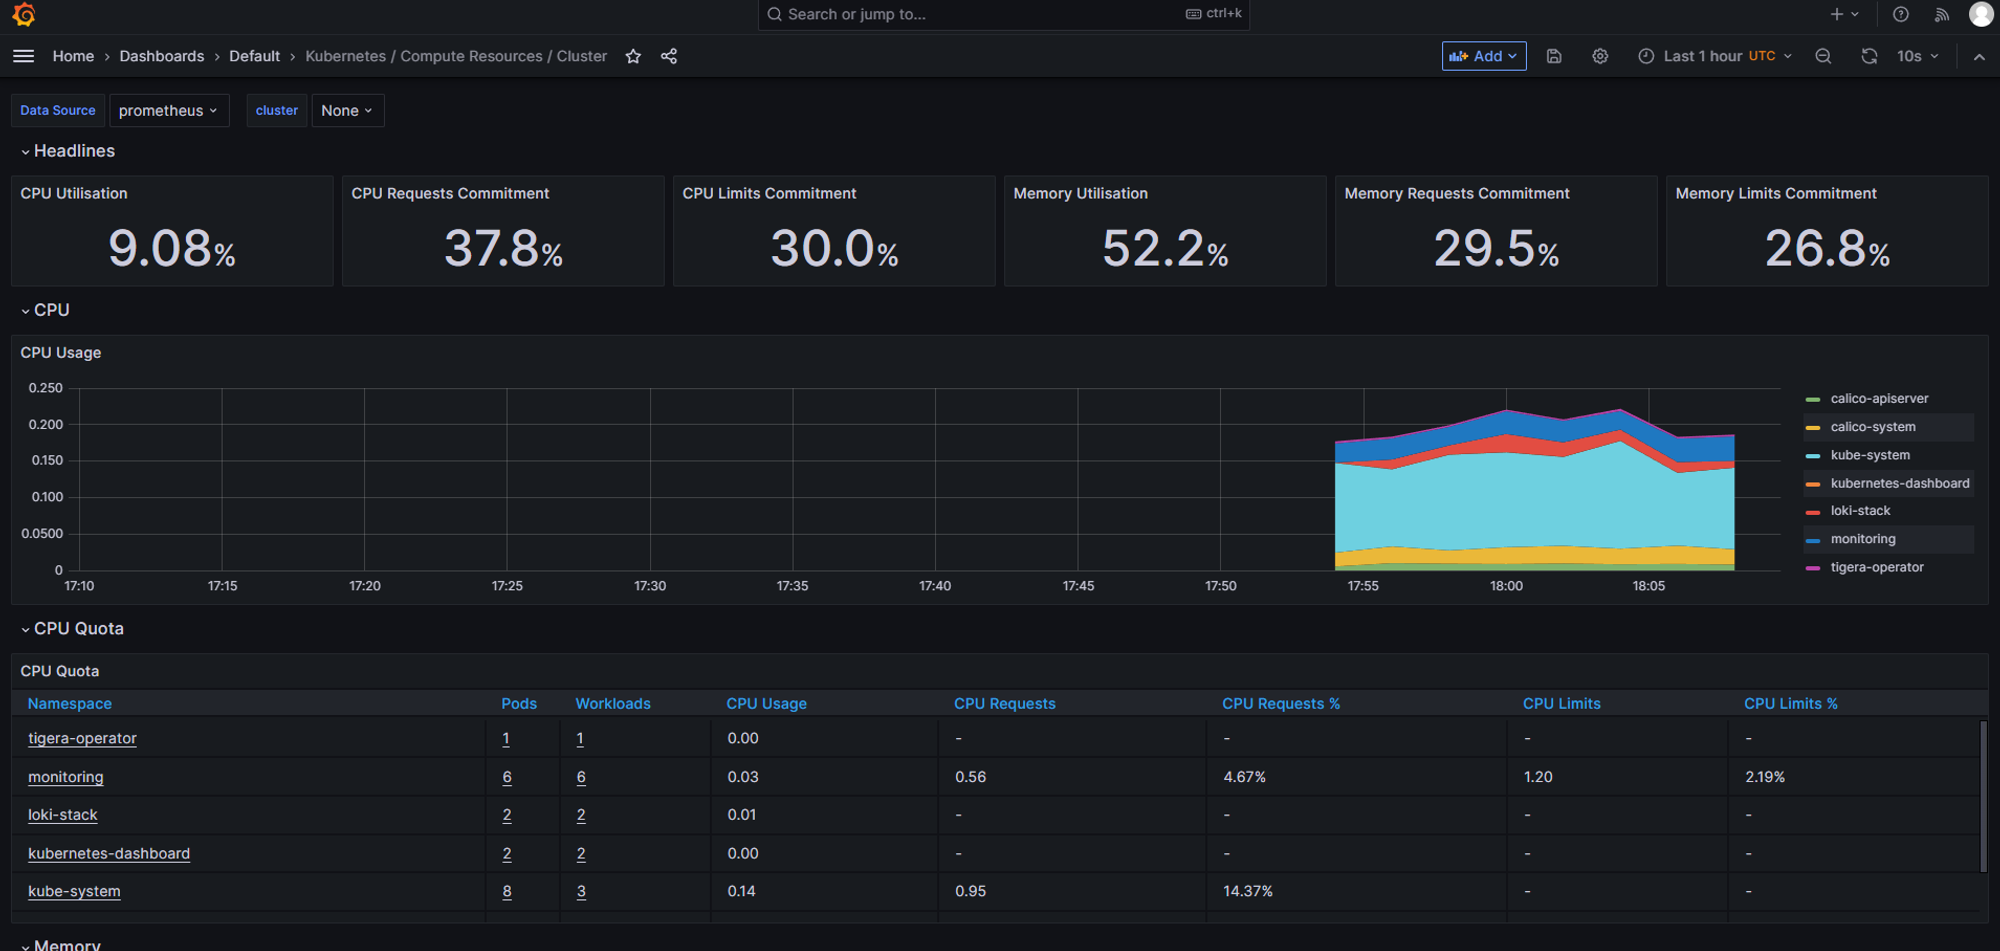
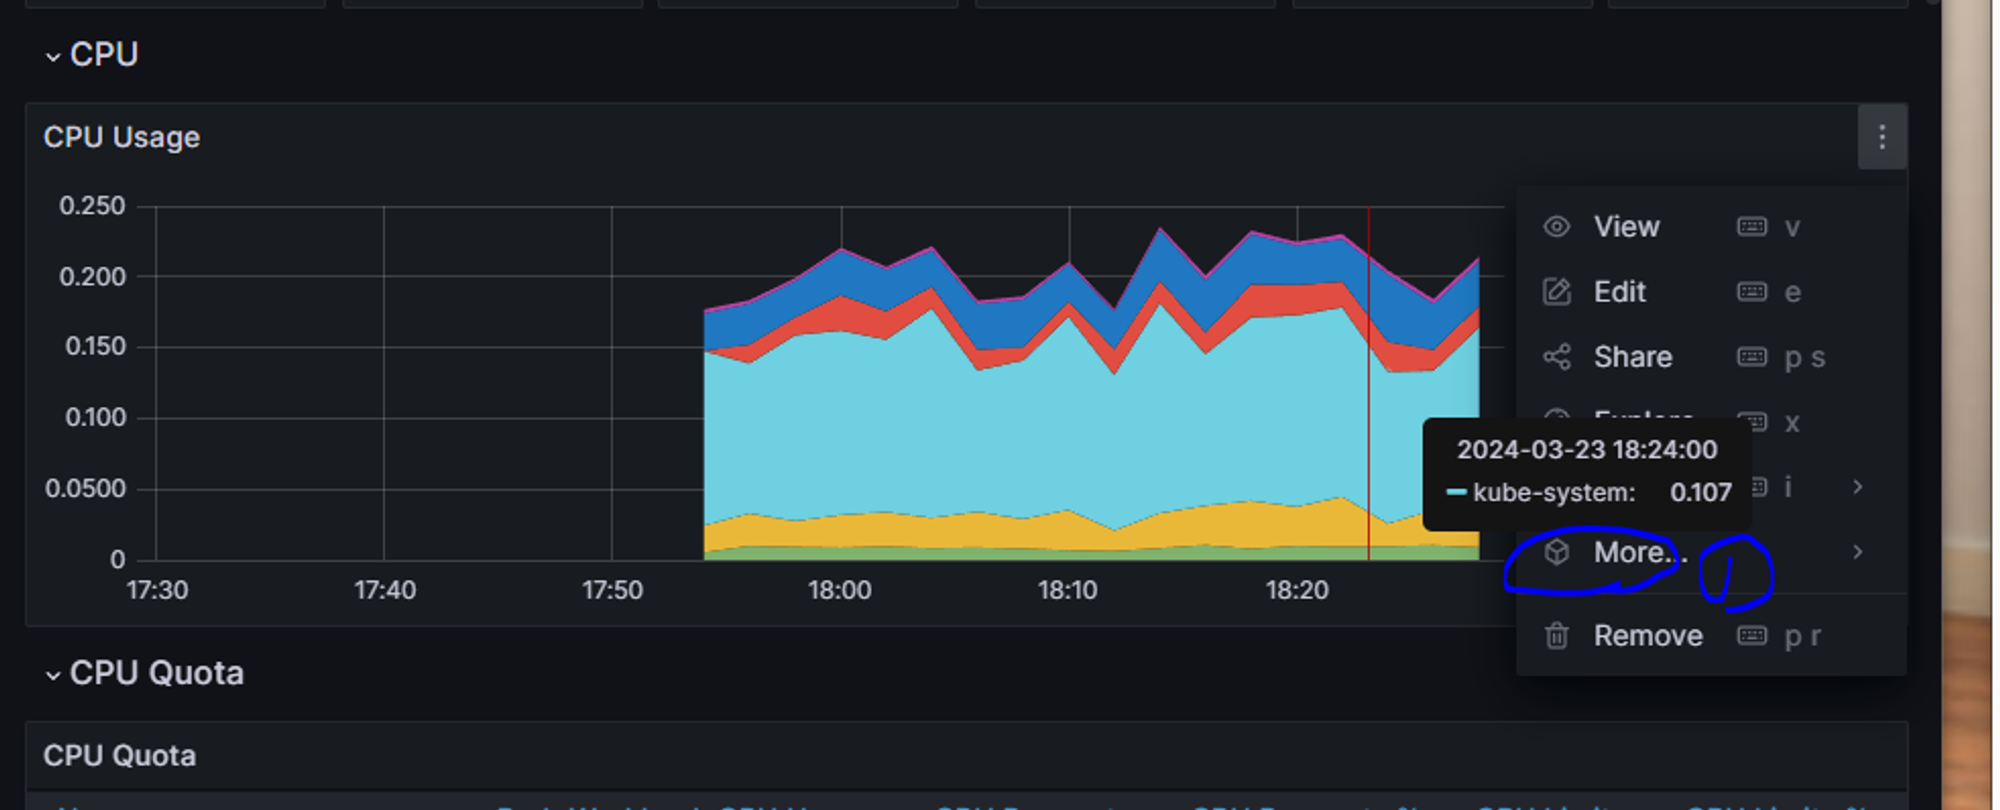
지표중에 copy를 눌러서 원하는 지표만 따로 대시보드로 만들 수 있다.
프로메테우스 & 로키스택 삭제
- 삭제를 안해도 되지만 문제가 생겼을 때 다시 설치를 위해 사용
cd monitoring ( 설치 디렉토리로 이동)
- 프로메테우스 삭제
kubectl delete --ignore-not-found=true -f ground/k8s-1.27/prometheus-2.44.0/manifests -f ground/k8s-1.27/prometheus-2.44.0/manifests/setup
- 로키스택 삭제
kubectl delete -f ground/k8s-1.27/loki-stack-2.6.1