-
클러스터 ID 생성 (1회)
KAFKA_CLUSTER_ID="$(bin/kafka-storage.sh random-uuid)" -
각 노드(컨트롤러/브로커)마다 log dir 포맷 (각각 1회)
bin/kafka-storage.sh format -t $KAFKA_CLUSTER_ID -c <properties> ... -
컨트롤러 먼저 시작
bin/kafka-server-start.sh config/my-controller.properties -
브로커 0/1/2를 각각 다른 터미널에서 시작
bin/kafka-server-start.sh config/broker0.properties등 -
bin/kafka-topics.sh --bootstrap-server localhost:9092 --create --replication-factor 3 --partitions 100 --topic reviews
Testing producer performance
-
bin/kafka-console-consumer.sh --bootstrap-server localhost:9092 --topic reviews -
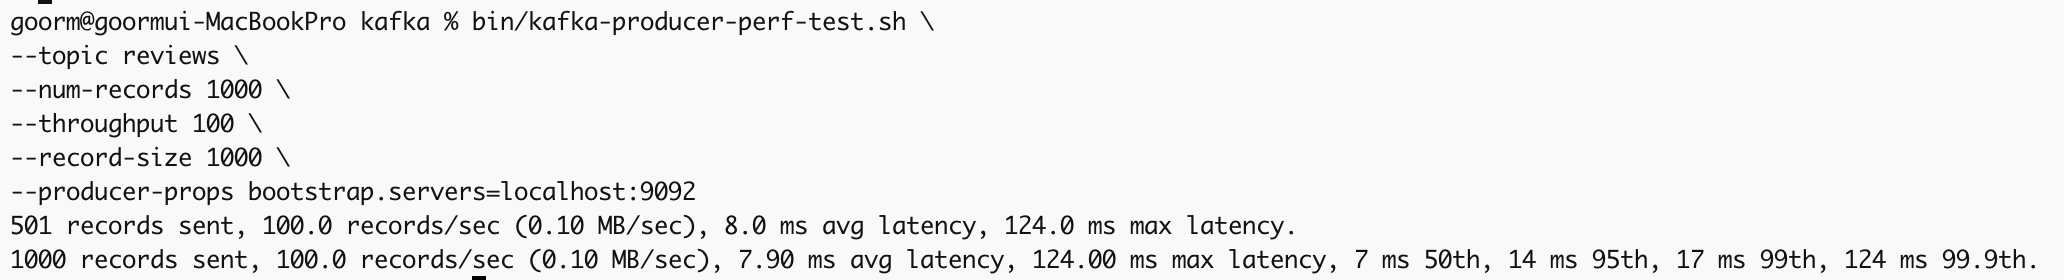
bin/kafka-producer-perf-test.sh \
--topic reviews \
--num-records 1000 \
--throughput 100 \
--record-size 1000 \
--producer-props bootstrap.servers=localhost:9092
--num-records 1000: 생산할 총 메시지 개수--throughput 10: 1초에 생산할 메시지 개수--record-size 1000: 한 메시지의 byte 용량
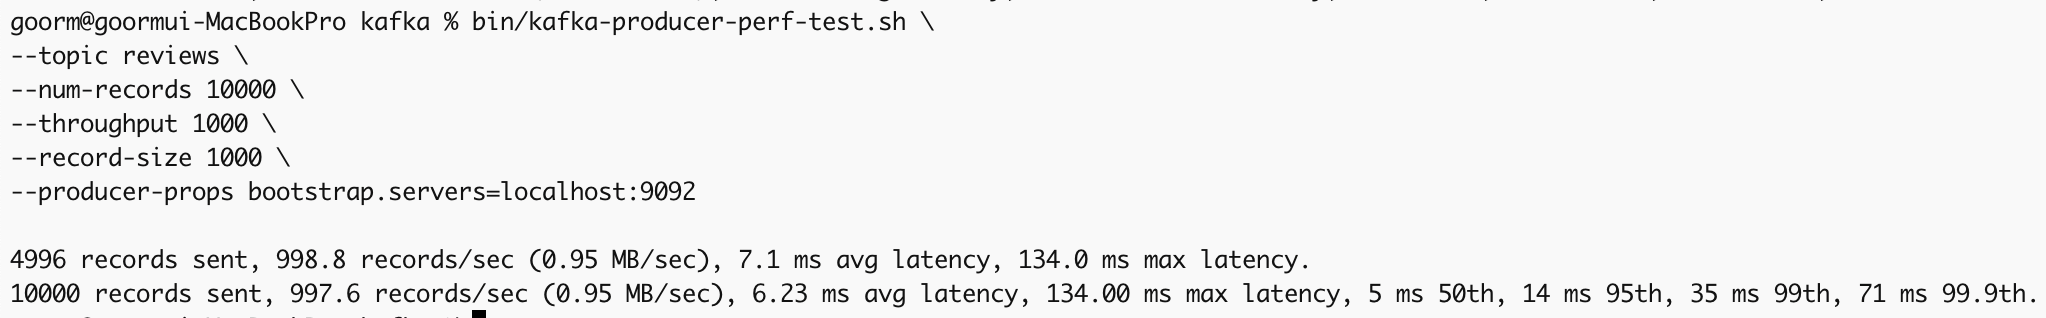
bin/kafka-producer-perf-test.sh \
--topic reviews \
--num-records 10000 \
--throughput 1000 \
--record-size 1000 \
--producer-props bootstrap.servers=localhost:9092
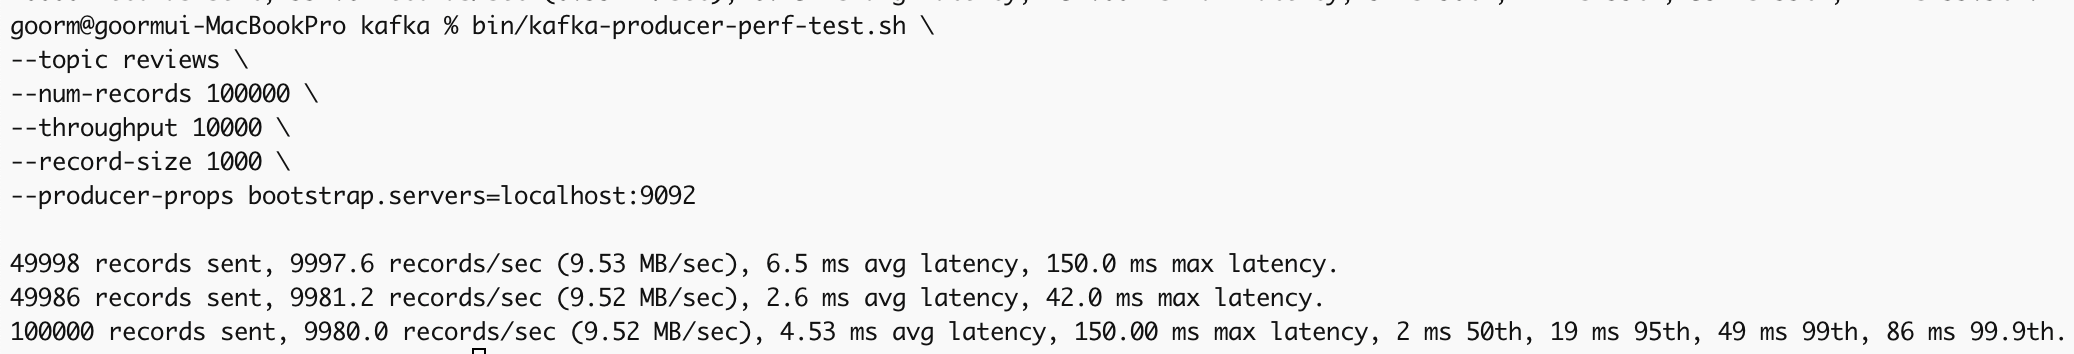
bin/kafka-producer-perf-test.sh \
--topic reviews \
--num-records 100000 \
--throughput 10000 \
--record-size 1000 \
--producer-props bootstrap.servers=localhost:9092
bin/kafka-producer-perf-test.sh \
--topic reviews \
--num-records 1000000 \
--throughput 100000 \
--record-size 1000 \
--producer-props bootstrap.servers=localhost:9092
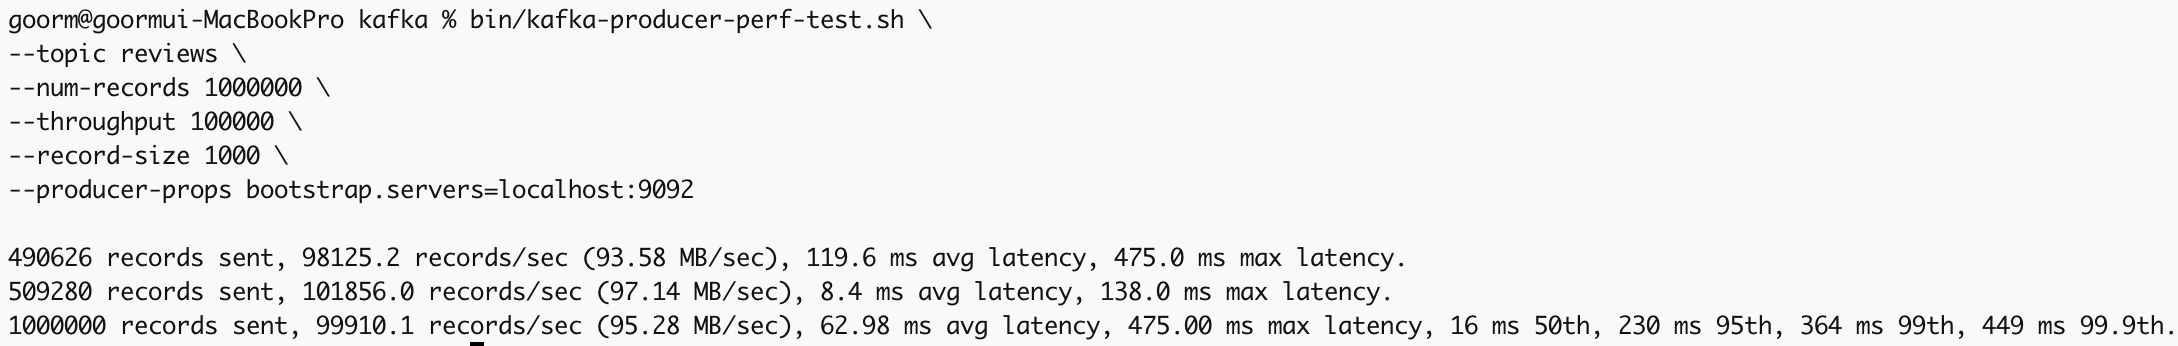
이번 테스트에서 latency가 확 늘어났다. 내 컴퓨터의 한계가 여기까지인가보다.
Testing consumer performance
bin/kafka-consumer-perf-test.sh \
--bootstrap-server localhost:9092 \
--topic perf \
--messages 10000
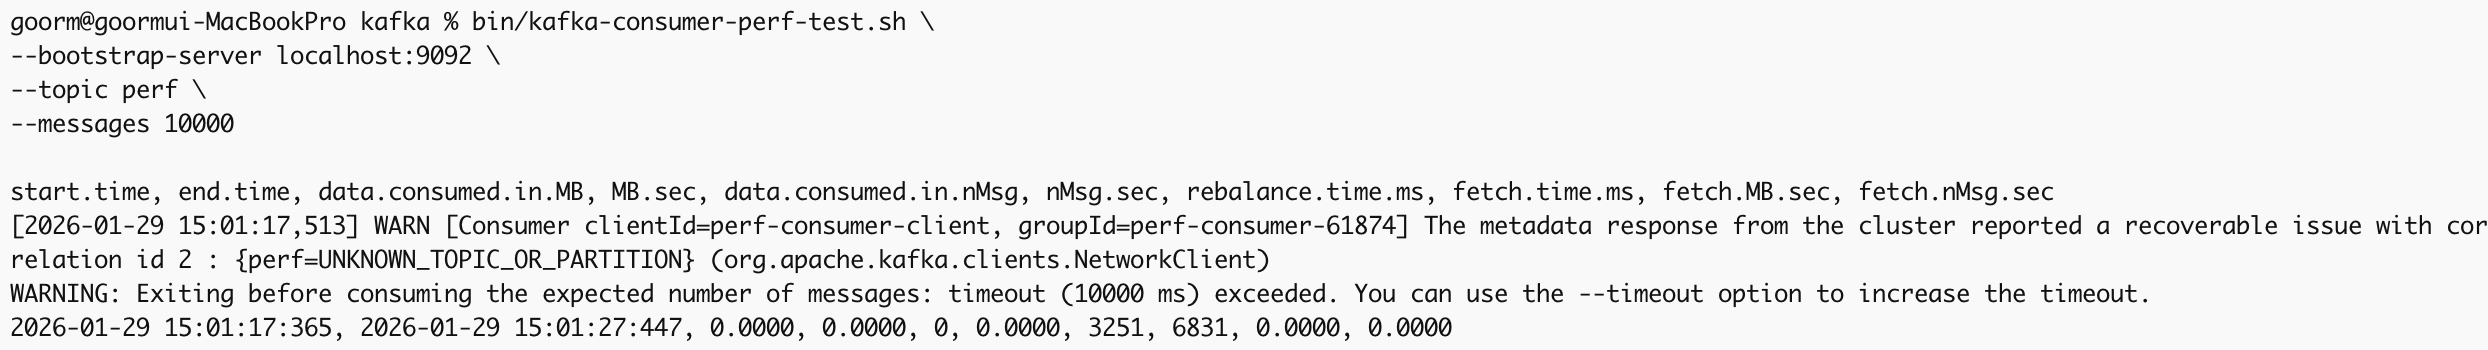
타임이웃이 떴다. 허용 시간을 늘려서 다시 테스트해보자.
bin/kafka-consumer-perf-test.sh \
--bootstrap-server localhost:9092 \
--topic perf \
--messages 10000 \
--timeout 100000
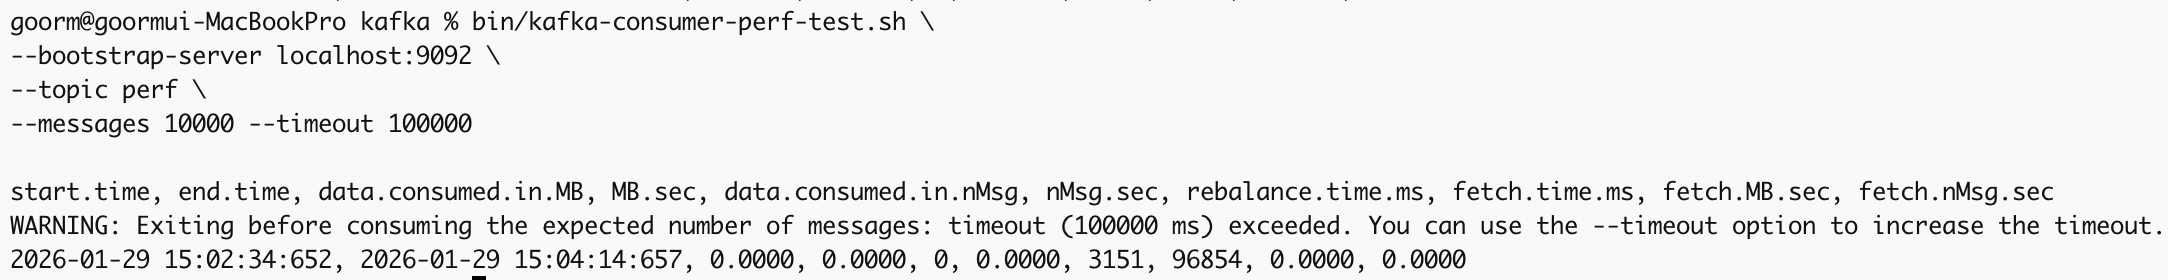
또 다시 타임아웃이 떴다. 시간을 10배 늘려줬는데도 말이다.
consumer가 하나여서 그런가?
consumer 3개로 한 결과임. 또 다시 타임아웃. 서버가 한 개여서 그런가???
GPT한테 물어봤다.
스샷을 보면 이전 것들과는 다르게 data.consumed.in.nMsg 지표 값이 1000으로 찍혀있다. 이 말은 즉 1,000개의 메시지를 읽었다는 소리다. 그런데 내 명령어를 보면 10,000개를 읽으라고 하고 있다. 이때문에 1001번째 메시지를 하염없이 기다리다가 timeout이라는 결과가 나온 것이라고 한다.
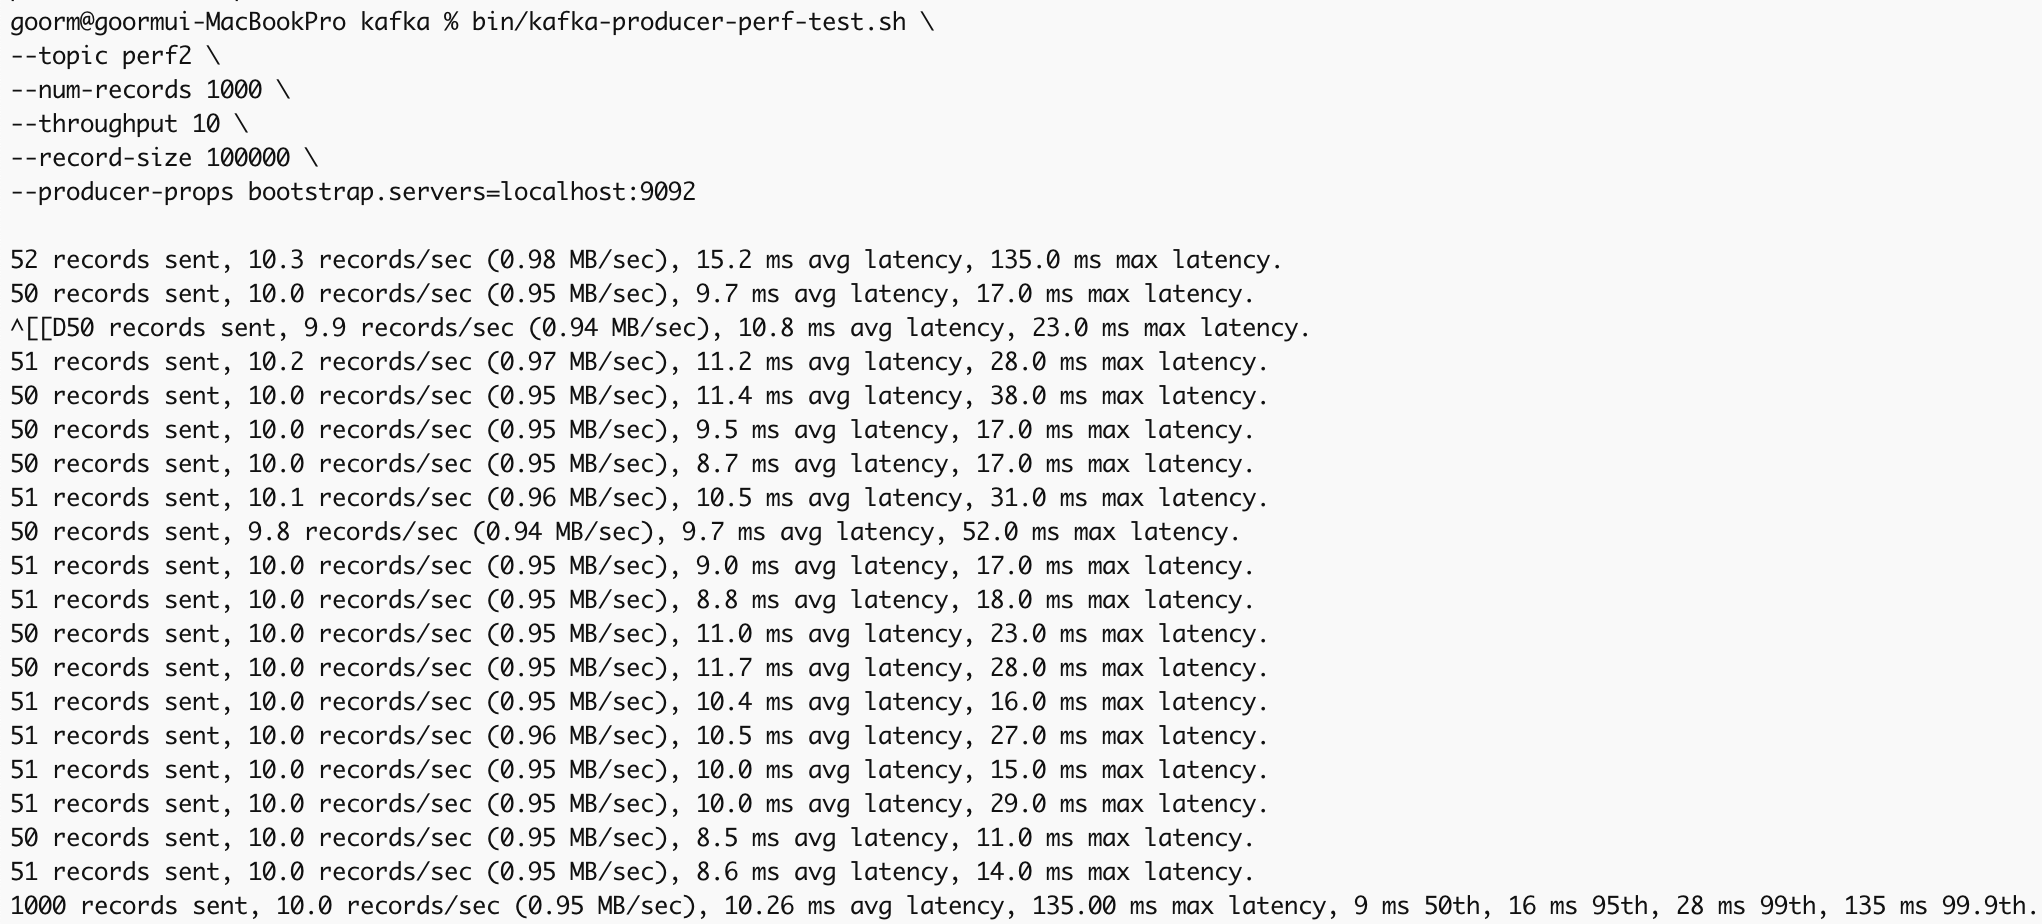
메시지가 1000개만 있는 이유는 kafka 초기화 후 다음 사진처럼 producer 테스트 때 --num-records 1000로 설정해주었기 때문이다.
테스트라고 해서 뭔가 가짜 데이터를 상정하고 성능 테스트가 진행될 거라 막연히 생각했는데, 실제 MQ에 메시지가 있어야만 consumer에 대한 정상적인 테스트가 가능한 것이었나보다.
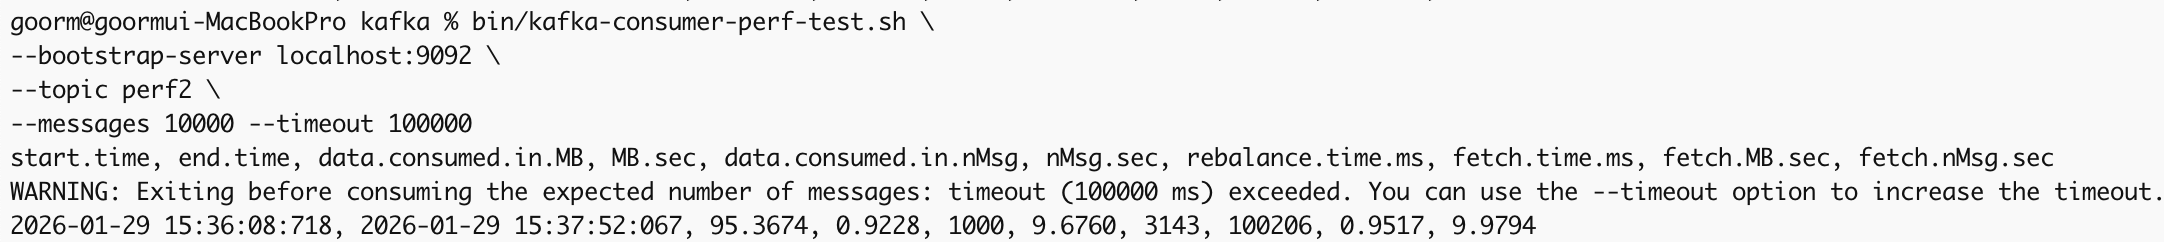
bin/kafka-consumer-perf-test.sh \
--bootstrap-server localhost:9092 \
--topic perf2 \
--messages 1000
메시지 1000개에 대한 consumer 성능 테스트를 해본 결과이다:
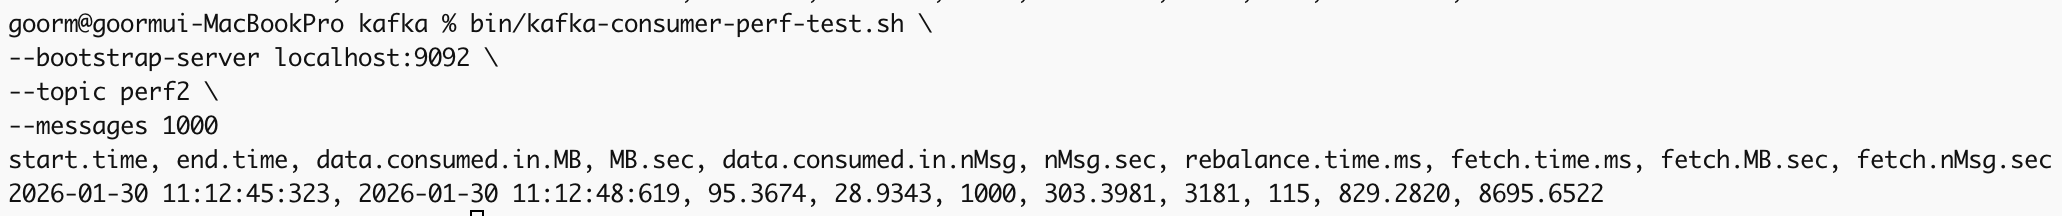
정상정으로 테스트가 완수되었다.
Getting non-zero LAG values for consumers
-
새로운 토픽을 생성해주자.
bin/kafka-topics.sh \
--bootstrap-server localhost:9092 \
--create \
--replication-factor 3 \
--partitions 3 \
--topic perf2 -
bin/kafka-console-consumer.sh \
--bootstrap-server localhost:9092 \
--topic perf2 \
--group perf \
--from-beginning
2번 실행하여 consumer를 2개 만들어주었다.
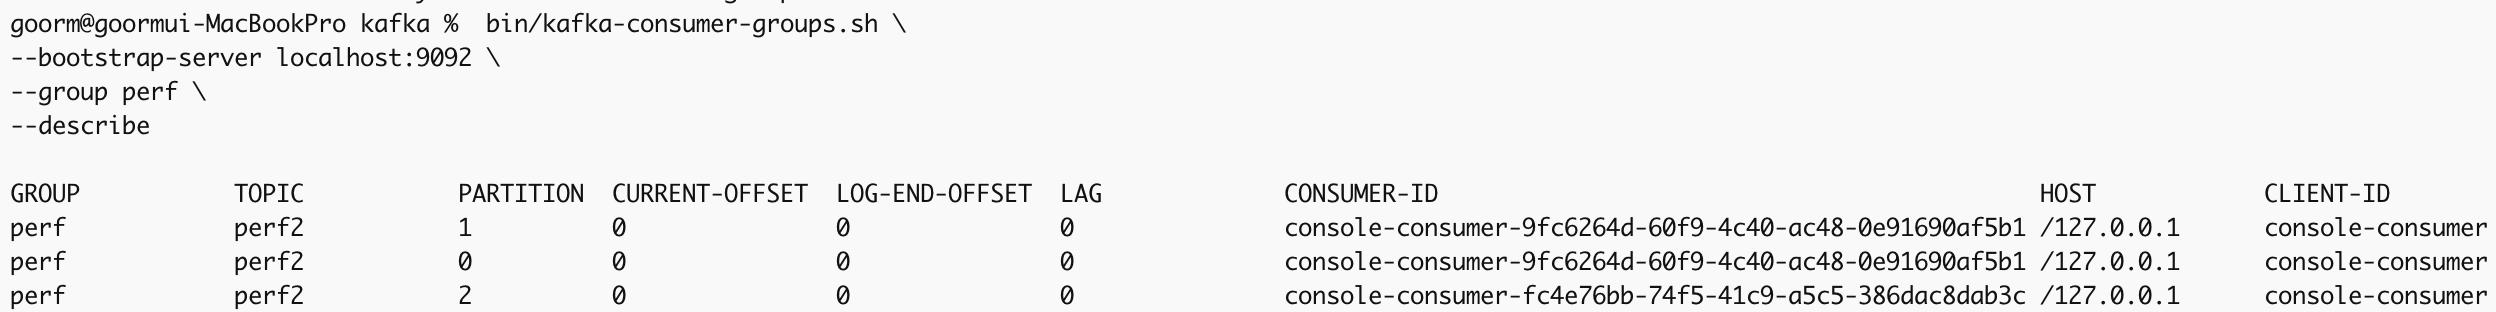
consumer groups를 확인해보자.
bin/kafka-consumer-groups.sh \
--bootstrap-server localhost:9092 \
--group perf \
--describe
-
bin/kafka-producer-perf-test.sh \
--topic perf2 \
--num-records 1000 \
--throughput 10 \
--record-size 100000 \
--producer-props bootstrap.servers=localhost:9092 -
bin/kafka-consumer-groups.sh \
--bootstrap-server localhost:9092 \
--group perf \
--describe
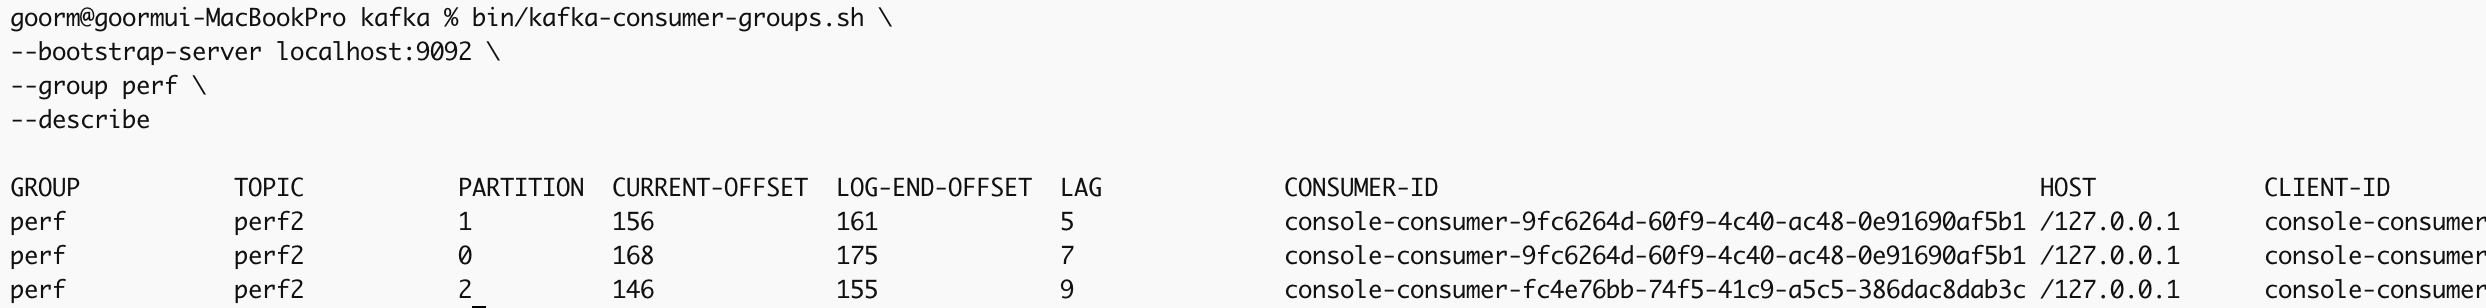
다시 consumer groups의 상태를 확인해봤더니 위와 같이 LAG값이 0이 아닌 값으로 바뀌었다.
CURRENT-OFFSET값과 LOG-END-OFFSET값의 차이를 보면 LAG값과 같다는 것을 알 수 있다. 즉 LAG값의 의미는 아직 consume되지 않는 메시지의 양이라는 것을 알 수 있다.

Perfomance test가 끝난 후 출력해보니 다시 LAG값이 0이 되었다.