미션 목록
- Plotly 그래프 생성
- update_xaxes, update_yaxes
- update_traces
- 기술 블로그 작성
import plotly.express as px

# 데이터 불러오기
df = px.data.iris()
# print(df.head())

# express를 활용한 scatter plot 생성
fig = px.scatter(df, x="sepal_width", y="sepal_length", color="species",
                 title="Sepal information of 3 Species of Iris")

fig.update_xaxes(title_text='Sepal Width')
fig.update_yaxes(title_text='Sepal Length')

# fig.update_traces({'species': 'setosa'}, dict(color="Gold"))
fig.update_traces(selector = dict(name='setosa'), marker_color='orange')

fig.show()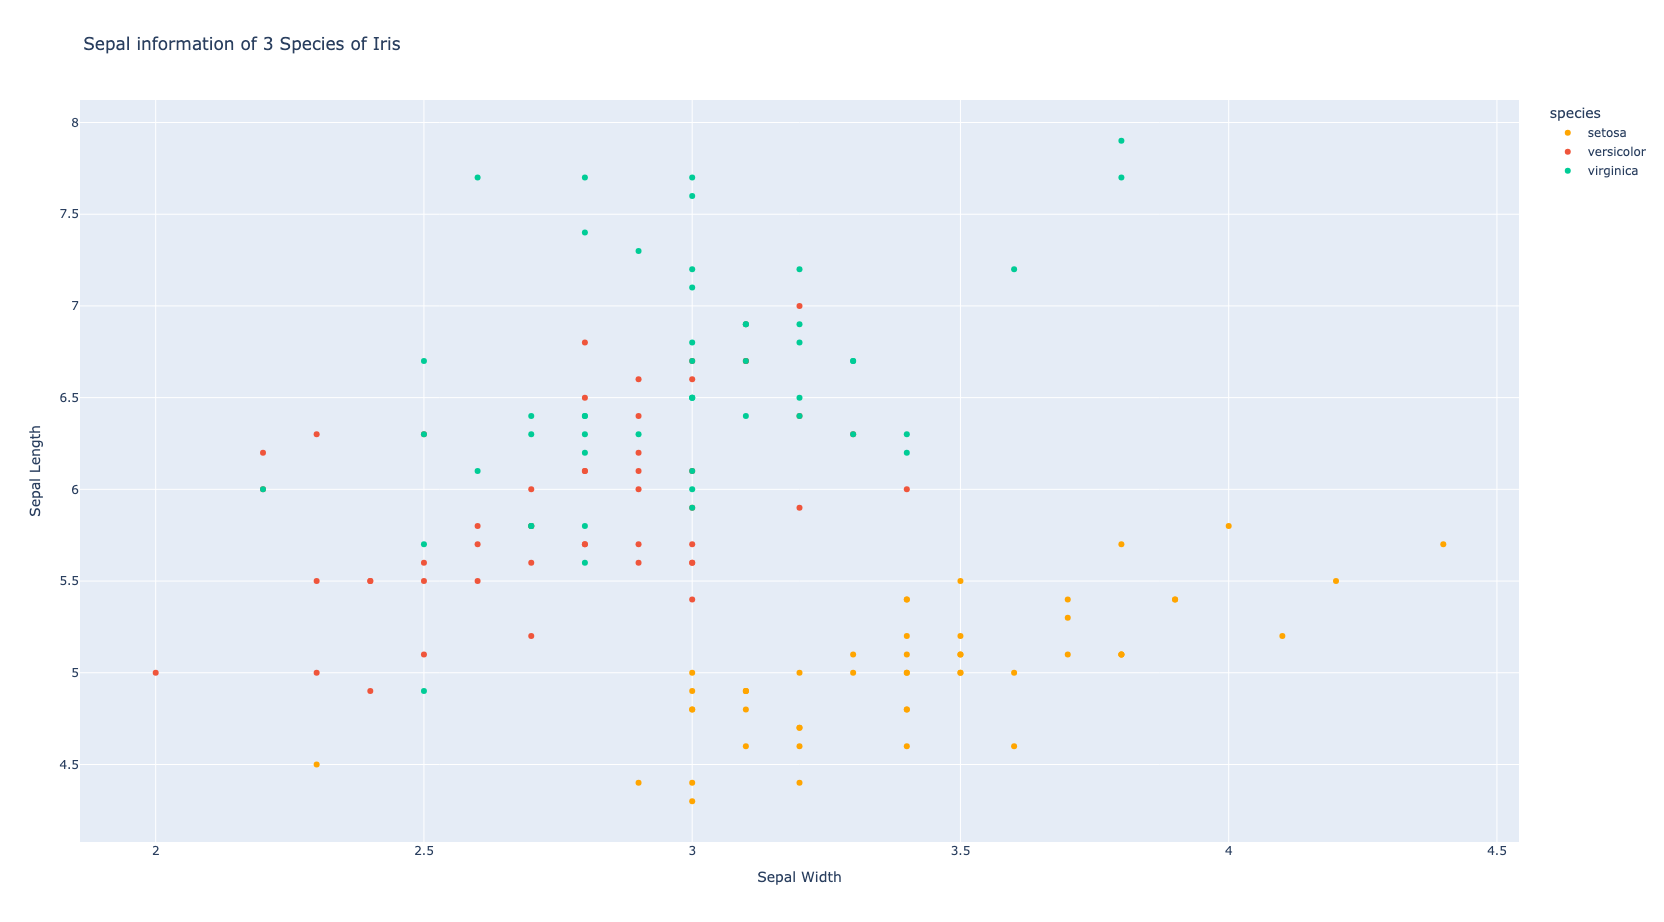
참고 사이트

개발자