
함수
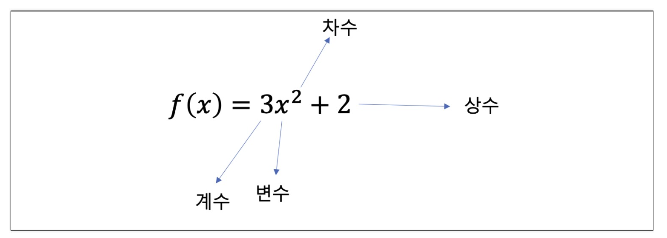
다항함수
import numpy as np
import matplotlib.pyplot as plt

x = np.linspace(-3, 2, 100)
y = 3 * x**2 + 2

plt.figure(figsize=(12,8))
plt.plot(x, y)
plt.grid()
plt.xlabel('$x$')
plt.ylabel('$y$')
plt.show()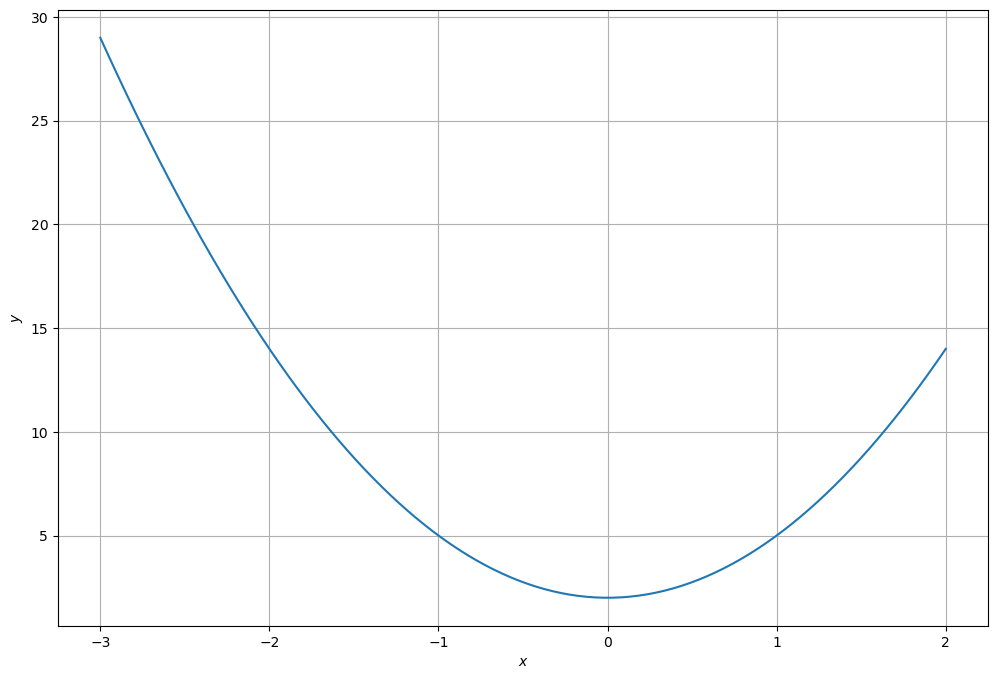
다항함수의 x축 방향 이동
x = np.linspace(-3, 2, 100)
y1 = 3 * x**2 + 2
y2 = 3 * (x+1)**2 + 2

plt.figure(figsize=(12,8))
plt.plot(x, y1, lw=2, ls='dashed', label='$y=3x^2 +2$')
plt.plot(x, y2, label='$y=3(x+1)^2 +2$')
plt.legend(fontsize=15)
plt.xlabel('$x$')
plt.ylabel('$y$')
plt.show()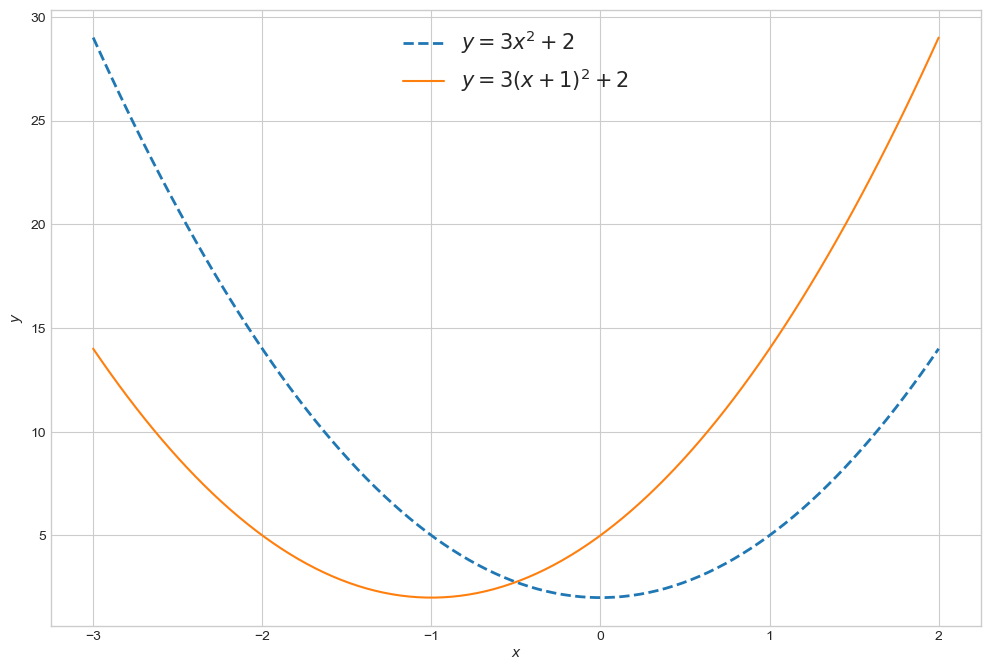
지수함수
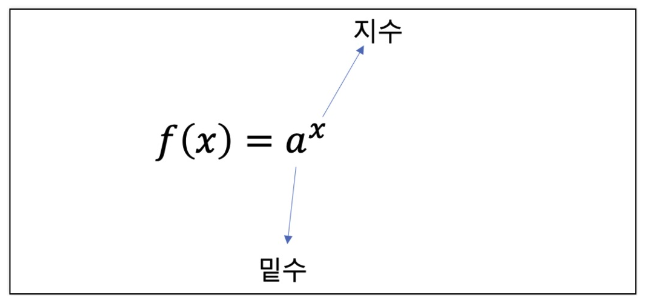
지수함수를 파악
x = np.linspace(-2, 2, 100)

a11, a12, a13 = 2, 3, 4
y11, y12, y13 = a11**x, a12**x, a13**x

a21, a22, a23 = 1/2, 1/3, 1/4
y21, y22, y23 = a21**x, a22**x, a23**x

fig, ax = plt.subplots(1, 2, figsize =(12,6))

ax[0].plot(x, y11, color = "k", label = "$2^x$")
ax[0].plot(x, y12, '--' , color = "k", label = "$3^x$")
ax[0].plot(x, y13, ':', color = "k", label = "$4^x$")
ax[0].legend(fontsize =20)

ax[1].plot(x, y21, color = "k", label = "$(1/2)^x$")
ax[1].plot(x, y22, '--' , color = "k", label = "$(1/3)^x$")
ax[1].plot(x, y23, ':', color = "k", label = "$(1/4)^x$")
ax[1].legend(fontsize =20)

plt.show()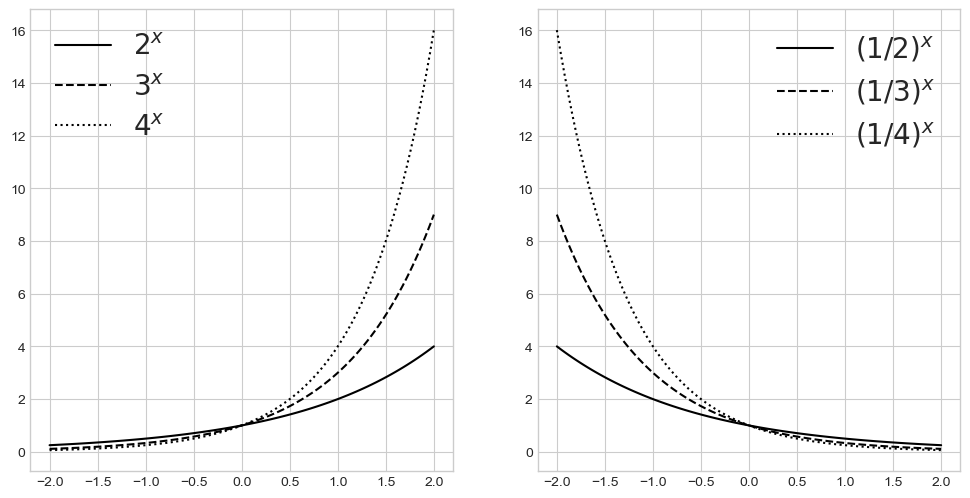
지수 증가
x = np.linspace(0,10)

plt.figure(figsize=(6,6))
plt.plot(x, x**2, '--',color='k', label='$x^2$')
plt.plot(x, 2**x, color='k', label='$2^x$')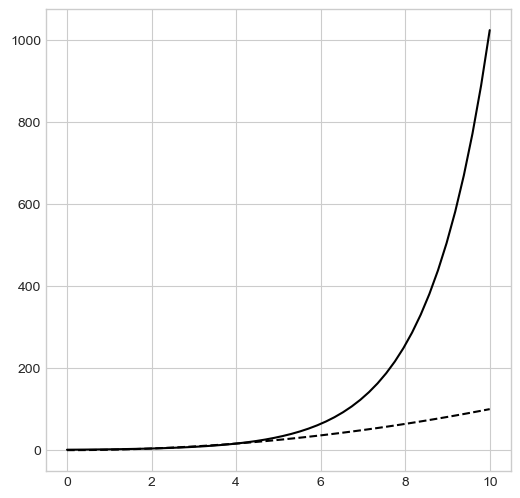
특이한 지수식
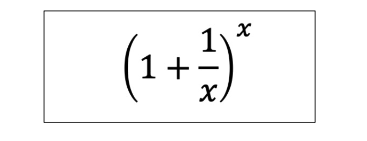
x = np.array([10, 100, 1000, 10000, 100000, 1000000])

(1+1/x)**x
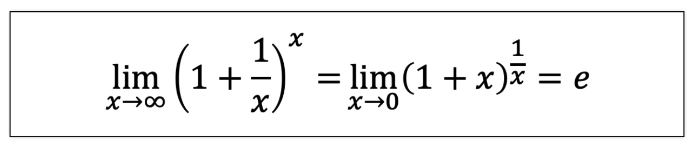
- 어떤 큰 값을 넣어도 2.718281828459045에 수렴하는
- 베르누이 발견, 오일러 e로 표기
자연 상수 e의 탄생
로그함수
def log(x, base):
    return np.log(x) / np.log(base)

x1 = np.linspace(0.0001, 5, 1000)
x2 = np.linspace(0.01, 5, 100)

y11, y12 = log(x1, 10), log(x2, np.e)
y21, y22 = log(x1, 1/10), log(x2, 1/np.e)

fig, ax = plt.subplots(1, 2, figsize =(12,6))

ax[0].plot(x1, y11, label = "$\log_{10} x$", color = 'k')
ax[0].plot(x2, y12, '--', label = "$\log_{e} x$", color = 'k')

ax[0].set_xlabel('$x$', fontsize =25)
ax[0].set_ylabel('$y$', fontsize =25)
ax[0].legend(fontsize =20, loc = 'lower right')

ax[1].plot(x1, y21, label = "$\log_{1/10} x$", color = 'k')
ax[1].plot(x2, y22, '--', label = "$\log_{1/e} x$", color = 'k')

ax[1].set_xlabel('$x$', fontsize =25)
ax[1].set_ylabel('$y$', fontsize =25)
ax[1].legend(fontsize =20, loc = 'upper right')

plt.show()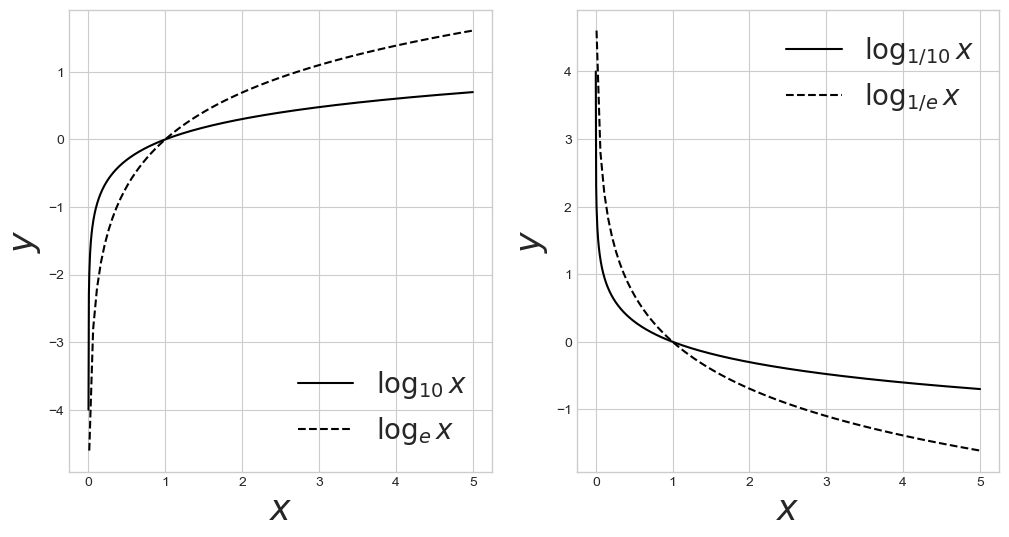
시그모이드 (sigmoid)
z = np.linspace(-10, 10, 100)
sigma = 1/(1+np.exp(-z))

plt.figure(figsize=(12,8))
plt.plot(z, sigma)
plt.xlabel('$z$', fontsize=25)
plt.ylabel('$\sigma$', fontsize=25)
plt.show()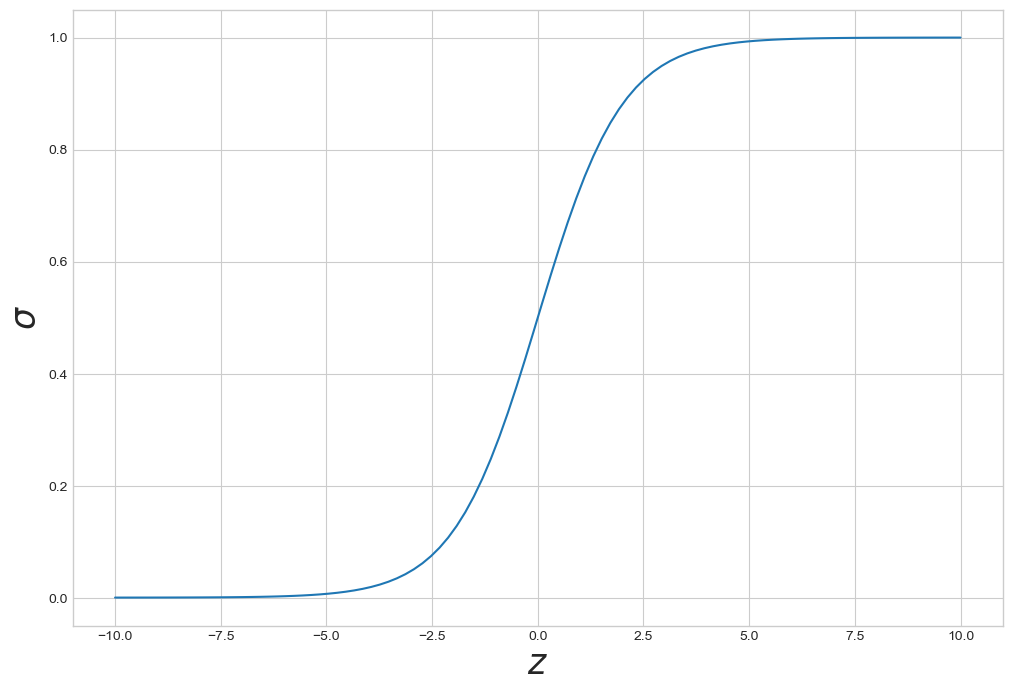
함수의 표현
백터의 표현
단일 변수 스칼라 함수

다중 변수 스칼라 함수

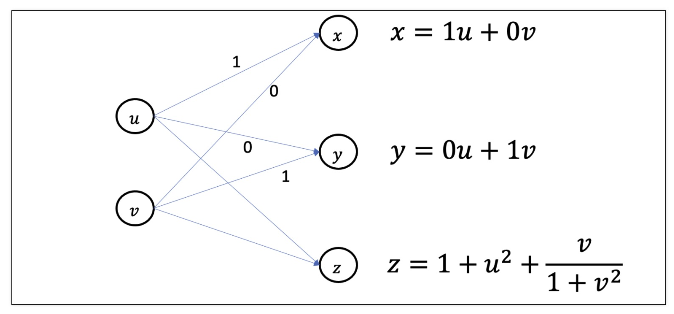
다변수 백터함수
다변수 벡터함수의 예제
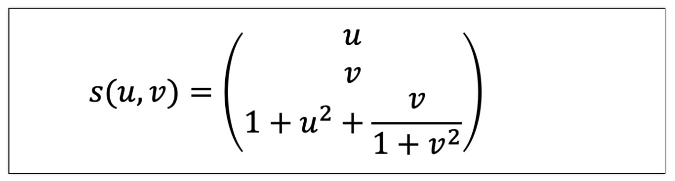
u = np.linspace(0, 1, 30)
v = np.linspace(0, 1, 30)

U, V = np.meshgrid(u, v)

z = (1 + U**2) + V / (1 + V**2)

fig = plt.figure(figsize=(7, 7))

ax= plt.axes(projection='3d')

ax.xaxis.set_tick_params(labelsize =15)
ax.yaxis.set_tick_params(labelsize =15)
ax.zaxis.set_tick_params(labelsize =15)

ax.set_xlabel('$x$', fontsize =20)
ax.set_ylabel('$y$', fontsize =20)
ax.set_zlabel('$z$', fontsize =20)

ax.scatter3D(U, V, z, marker='.', color='gray')
plt.show()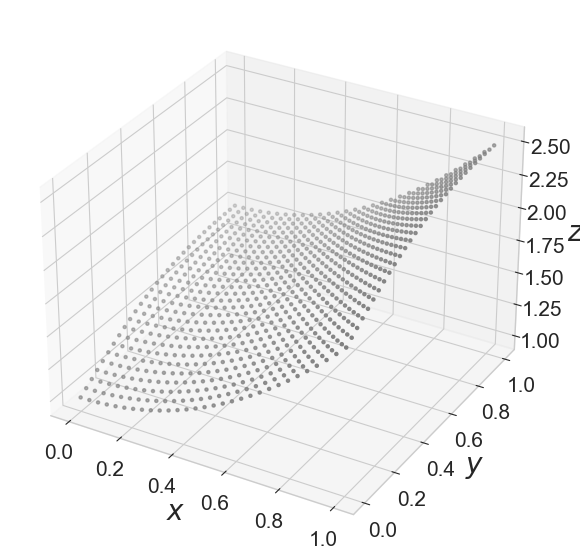
함수의 그래프 방식 표현
- 동그라미는 node, 화살표선은 edge
함수의 합성
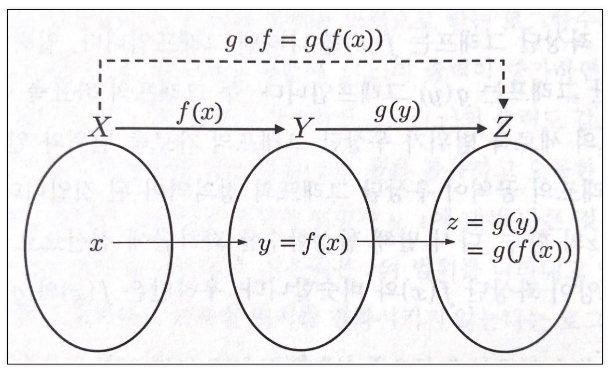
함수의 합성 예제
x = np.linspace(-4, 4, 100)
y = x**3 - 15*x + 30       #f(x)
z = np.log(y)              #g(y)

fig, ax = plt.subplots(1, 2, figsize =(12,6))

ax[0].plot(x, y, label = '$x^3 -15x +30$', color ='k')
ax[0].legend(fontsize =18)

ax[1].plot(y, z, label = '$\log(y)$', color ='k')
ax[1].legend(fontsize =18)

plt.show()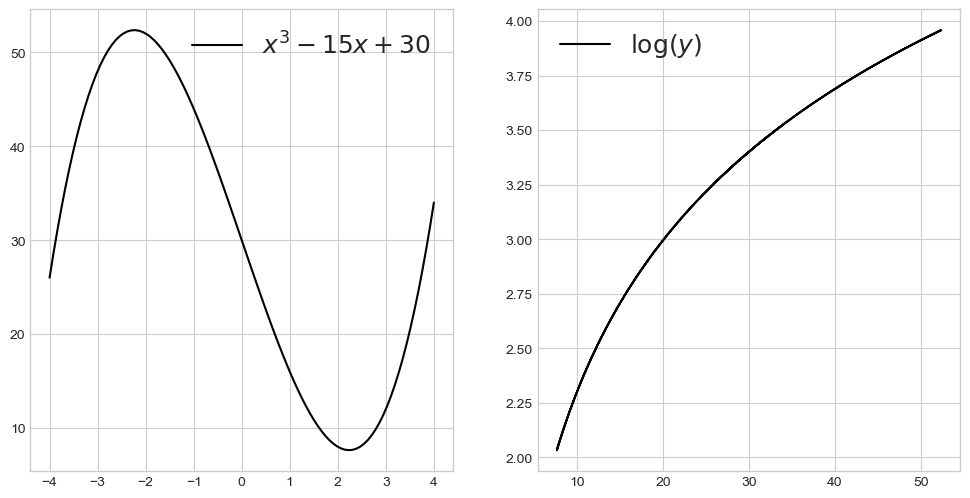
fig, ax = plt.subplots(1, 2, figsize =(12,6))

ax[0].plot(x, z, '--', label = '$\log(f(x))$', color ='k')
ax[0].legend(fontsize =18)

ax[1].plot(x, y, label = '$x^3 -15x +30$$', color ='k')
ax[1].legend(fontsize =18)

ax_tmp = ax[1].twinx()
ax_tmp.plot(x, z, '--', label = '$\log(f(x))$', color ='k')

plt.show()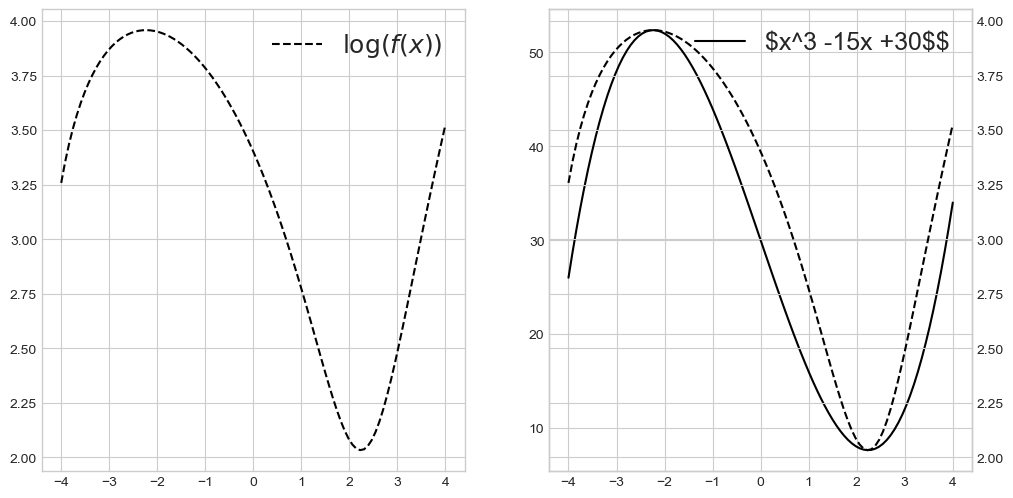

10√2 Data