
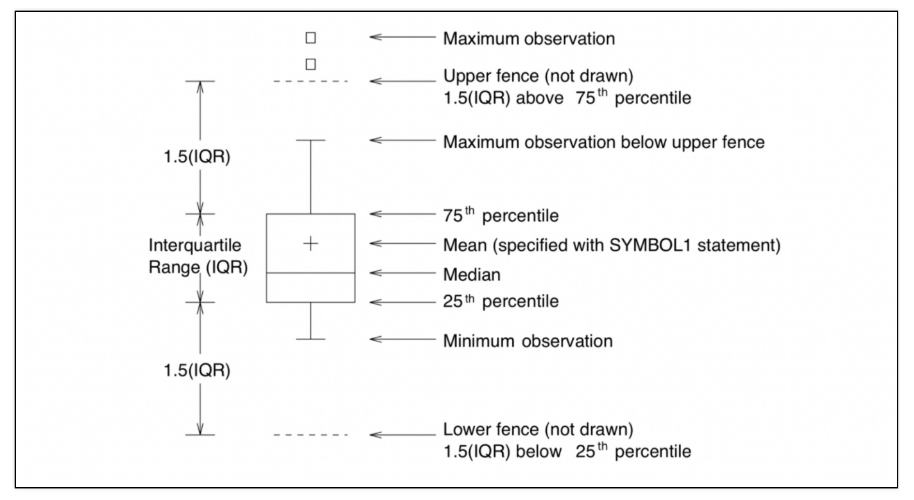
boxplot
데이터
import numpy as np

samples = [1, 7, 9, 16, 36, 39, 45, 45, 46, 48, 51, 100, 101]

tmp_y = [1]*len(samples)
plot
import matplotlib.pyplot as plt

plt.figure(figsize=(12, 4))
plt.scatter(samples, tmp_y)
plt.grid
plt.show()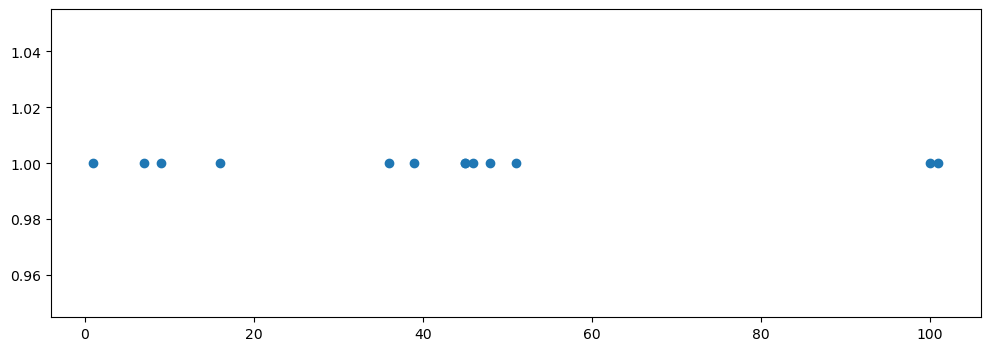
np.median(samples)
np.percentile(samples, 75)
그리기
plt.figure(figsize=(12,4))
plt.scatter(samples, tmp_y)
plt.axvline(x=q1, color='black')
plt.axvline(x=q2, color='red')
plt.axvline(x=q3, color='black')
plt.axvline(x=upper_fence, color='black', linestyle='dashed')
plt.axvline(x=lower_fence, color='black', linestyle='dashed')
plt.show()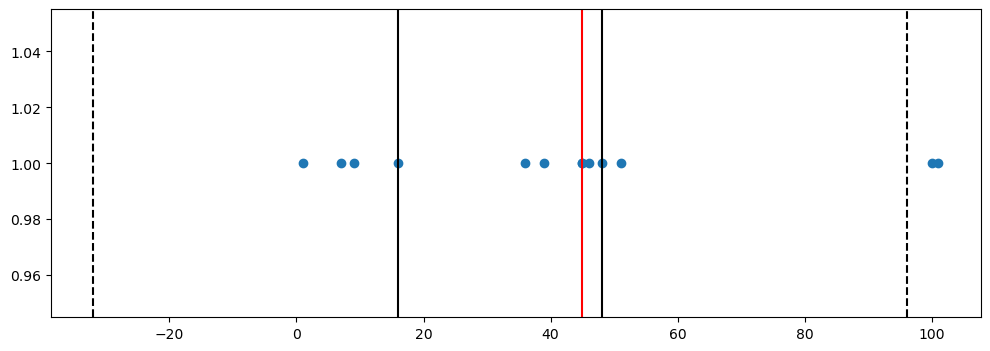
import seaborn as sns

plt.figure(figsize=(12,8))
sns.boxplot(samples)
plt.grid()
plt.show()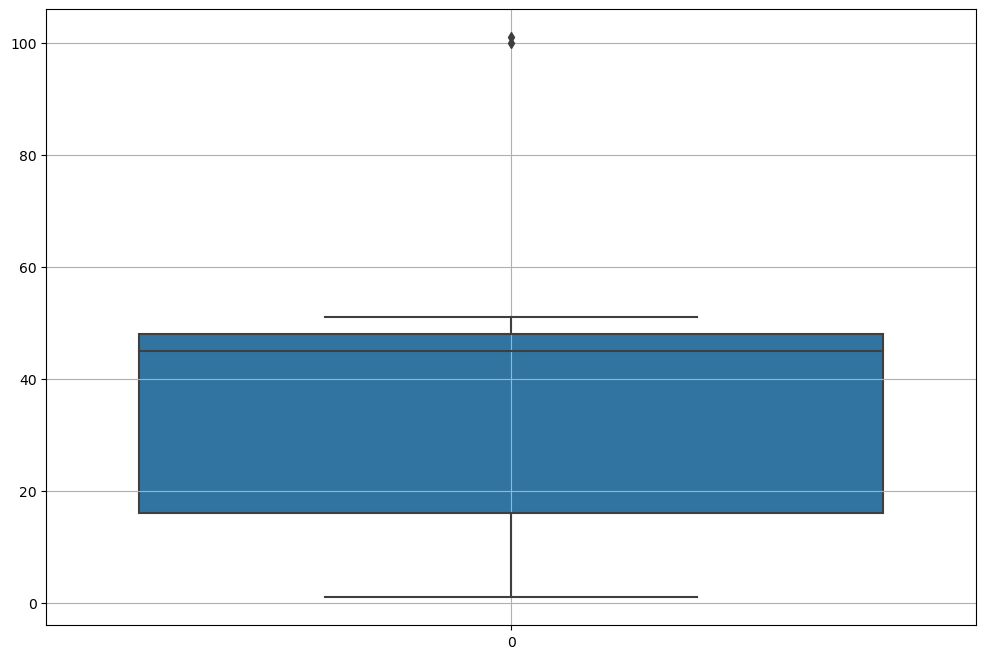

10√2 Data
코드와 그래프를 통해 내용을 잘 이해할 수 있었습니다. Boxplot에 대해 좀 더 깊게 알 수 있게 되어 감사합니다. 계속해서 좋은 글 부탁드려요!