학습내용
무작위 샘플링
train = df.sample(frac = 0.75, random_state=1)
test = df.drop(train.index)
target, feature / train, test 데이터셋 생성
feature = []
target = []

X_train = train[feature]
X_test = test[feature]
y_train = train[target]
y_test = test[target]
from sklearn.model_selection import train_test_split
rng = np.random.RandomState(1)
data = np.dot(rng.rand(2, 2), rng.randn(2, 30)).T
X = pd.DataFrame([i[0] for i in data])
y = pd.DataFrame([i[1] for i in data])
X_train, X_test, y_train, y_test = train_test_split(X,y, random_state = 1)
학습 및 검정
from sklearn.metrics import mean_absolute_error
model = LinearRegression
model.fit(X_train, y_train)
y_pred_test = model.predict(X_test)
y_pred_tarin = model.predict(X_train)
mean_absolute_error(y_test, y_pred_test)
mean_absolute_error(y_train, y_pred_train)
model.score(X_train, y_train)
r2_score(y_test, y_pred)
다항회귀모델의 차수 조정
from sklearn.preprocessing import PolynomialFeatures
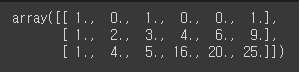
X1 = np.arange(6).reshape(3,2)
poly = PolynomialFeatures(2)
X_poly = poly.fit_transform(X1)
X_poly
PolynomialRegression
from sklearn.linear_model import LinearRegression
from sklearn.metrics import r2_score
from sklearn.pipeline import make_pipeline
from sklearn.preprocessing import PolynomialFeatures
import matplotlib.pyplot as plt
from sklearn.pipeline import make_pipeline
from sklearn.preprocessing import PolynomialFeatures
def PolynomialRegression(dgree = 2):
return make_pipeline(PolynomialFeatures(degree), LinearRegression())
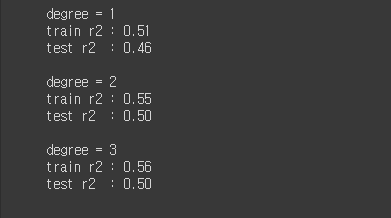
degrees = [1,2,3]
for degree in degrees:
model2 = PolynomialRegression(degree)
print('degree = {}'.format(degree))
model2.fit(X_train,y_train)
train_r2 = model2.score(X_train, y_train)
test_r2 = model2.score(X_test, y_test)
print('train r2 : {:.2f}'.format(train_r2))
print('test r2 : {:.2f}'.format(test_r2))
print()
그래프
import matplotlib.pyplot as plt
import seaborn as sns
import plotly.express as px
import plotly.graph_objs as go
px.scatter_3d(
data,
x = ,
y = ,
z = ,
title = ''
추가내용
def print_kwargs(**kwargs):
print(kwargs)