학습내용
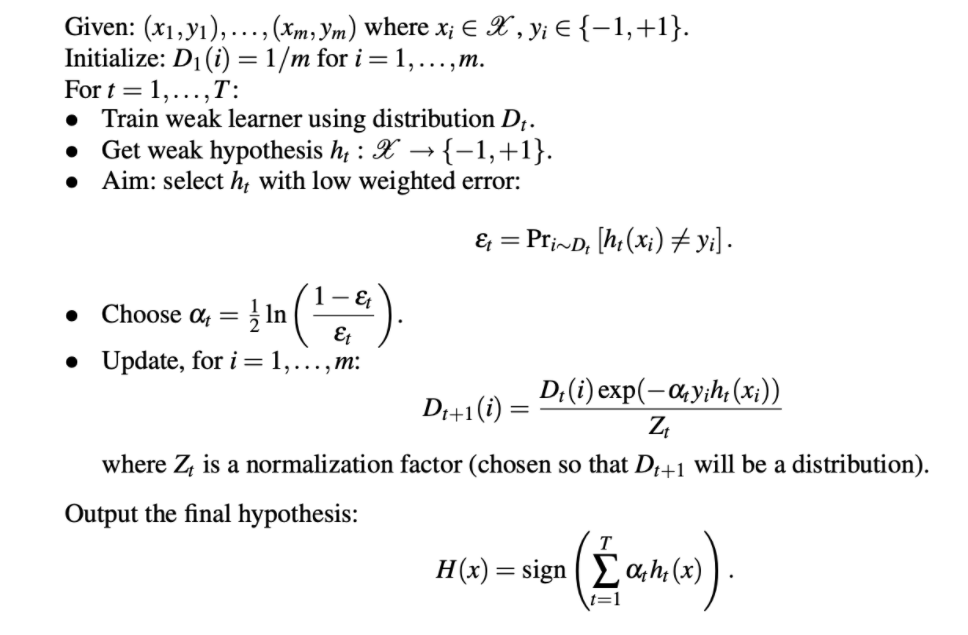
Adaboost tree
여러 stump를 이용하여 모델을 학습시켜나가는 방법.
stump는 순차적으로 구성되어야 하며 앞의 stump에서의 예측결과를 통해 다음 stump에서의 학습이 이루어짐.
- 일반 Decision tree와의 차이
- 모든 tree가 stump 형태임
- 이전 트리에 영향을 받음
- 트리의 순서가 중요함3. 트리의 순서가 중요함
- 알고리즘
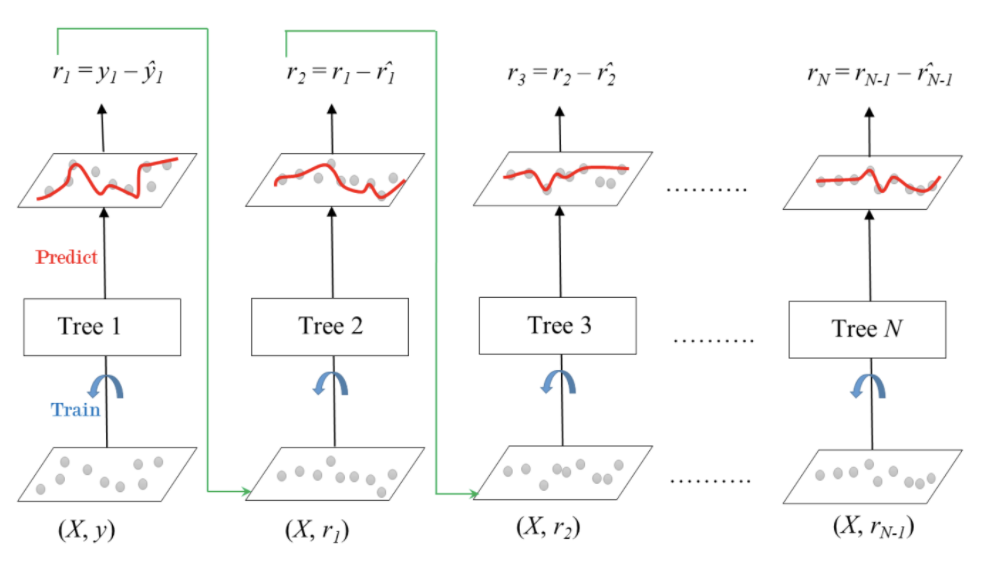
Gradient boosting
여러개의 tree 모델을 이용해 잔차를 학습하고 error를 줄여나가는 방식.
회귀과 분류모델에 둘 다 사용가능.
-
알고리즘
-
Adaboost와의 차이
- 잔차를 학습하는 형태
- stump가 아닌 더 깊은 tree 모델도 사용가능.
XGboost
GBM에서 파생되어 병렬 학습이 가능하여 학습 시간이 적게 걸린다.
결측값을 수용하며, monotonic constraints를 강제할 수 있음.
from xgboost import XGBClassifier
from sklearn.metrics import f1_score

xgb = XGBClassifier(
    n_estimators = 200,
    random_state = 2,
    n_jobs = -1,
    max_depth = 7,
    learning_rate = 0.2
)

eval_set = [(X_train, y_train),
            (X_test, y_test)]

xgb.fit(X_train, y_train,
        eval_set = eval_set,
        eval_metric = 'error',
        early_stopping_rounds = 50)

y_pred = xgb.predict(X_test)
print('XGBoost f1 score : ', f1_score(y_test, y_pred))
# training, test error 시각화
import matplotlib.pyplot as plt
results = xgb.evals_result()
train_error = results['validation_0']['error']
test_error = results['validation_1']['error']
epoch = range(1, len(train_error)+1)
plt.plot(epoch, train_error, label = 'Train')
plt.plot(epoch, test_error, label = 'Test')
plt.ylabel('Classification Error')
plt.xlabel('Model Complexity (n_estimators)')
plt.legend();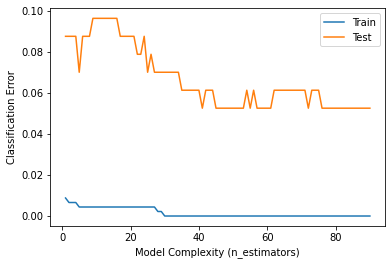
LightGBM
XGBoost의 단점을 보완한 알고리즘으로 학습 시간이 XGBoost에 비해 훨씬 적게걸린다.
결측값을 수용하며, monotonic constraints를 강제할 수 있음.
from lightgbm import LGBMClassifier, plot_importance

lgb = LGBMClassifier(
    n_estimators = 200,
    random_state = 2,
    n_jobs = -1,
    max_depth = 7,
    learning_rate = 0.2
)

eval_set = [(X_train, y_train),
            (X_test, y_test)]

lgb.fit(X_train, y_train,
        eval_set = eval_set,
        eval_metric = 'error',
        early_stopping_rounds = 50)

y_pred = lgb.predict(X_test)
print('LGBM f1 score : ', f1_score(y_test, y_pred))
# training, test error 시각화
result2 = lgb.evals_result_
train_error = result2['training']['binary_error']
# 이 부분이 xgboost랑 다르다. lgb는 logloss값도 같이 출력해줌.
test_error = result2['valid_1']['binary_error']
epoch = range(1, len(train_error)+1)
plt.plot(epoch, train_error)
plt.plot(epoch, test_error)
plt.ylabel('Classification Error')
plt.xlabel('Model Complexity (n_estimators)')
plt.legend();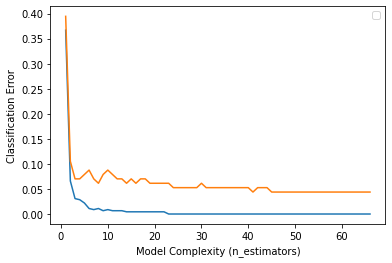
Feature importance
1. Mean decrease impurity
특성을 모든 트리에 대해 평균불순도감소(mean decrease impurity)를 계산한 값
importances = pd.Series(xgb.feature_importances_, cancer_dataset['feature_names']).sort_values()

plt.figure(figsize = (8,6))
plt.title('MDI')
importances.plot.barh();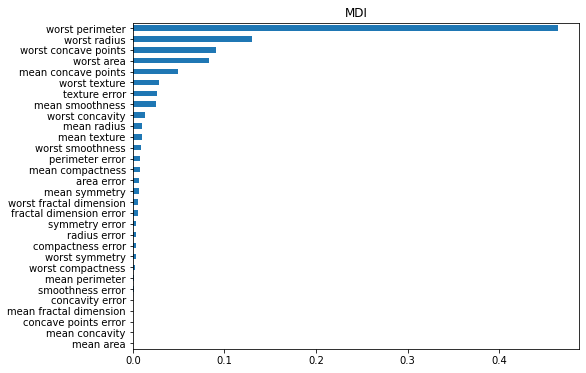
2. permutation importance
특정 특성의 위치를 랜덤으로 섞어버림.
섞인 특성은 특성의 의미가 사라져버리고 이를 학습시켜 특성을 섞기 전과 후를 비교하여 feature importance를 계산하는 방식.
drop columns importance와 MDI 중간정도의 느낌으로 생각하면된다.
import eli5
from eli5.sklearn import PermutationImportance

permuter = PermutationImportance(
    xgb,
    scoring = 'accuracy',
    n_iter = 5,
    random_state = 2
)

permuter.fit(X_train, y_train)

importances_permuter = pd.Series(permuter.feature_importances_, cancer_dataset["feature_names"]).sort_values()

plt.figure(figsize = (8,6))
plt.title('permutation')
importances_permuter.plot.barh();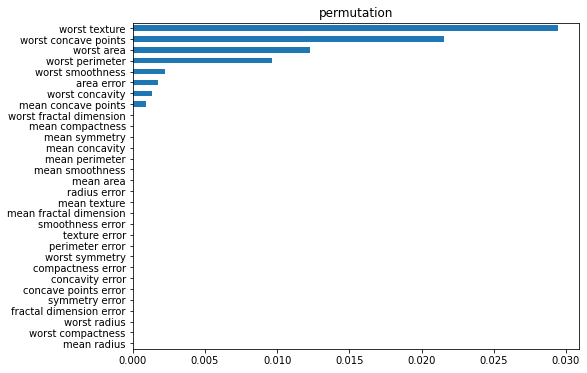
3. Drop columns importance
특정 feature를 완전히 드랍하여 예측한 결과와 원래의 data set으로 예측한 결과를 비교하여 feature importance를 결정하는 방식.
학습시간이 오래걸린다는 단점이있다.
#drop columns importance 구하기

all_cols = cancer_dataset['feature_names']

xgb_in = XGBClassifier( #전체 column 이용하여 학습
    n_estimators = 200,
    random_state = 2,
    n_jobs = -1,
    max_depth = 7,
    learning_rate = 0.2
)

xgb_in.fit(X_train, y_train)
score_in = xgb_in.score(X_test, y_test)

score_ex = []

for col in all_cols:

    xgb_ex = XGBClassifier( # 칼럼을 하나씩 제외
        n_estimators = 200,
        random_state = 2,
        n_jobs = -1,
        max_depth = 7,
        learning_rate = 0.2
        # scale_pos_weight=ratio(target weight 설정)
    )

    X_train_temp = X_train.drop(col, axis = 1)
    X_test_temp = X_test.drop(col, axis = 1)

    xgb_ex.fit(X_train_temp, y_train)
    score_ex.append(xgb_ex.score(X_test_temp, y_test))

importances_drop = pd.Series(score_in - score_ex, cancer_dataset['feature_names']).sort_values()

plt.figure(figsize = (8,6))
plt.title('Drop-Columns importance')
importances_drop.plot.barh();