3.1 Debugging in the browser - link
developer tool > Sources Tab
- The Sources panel has 3 parts
- The File Navigator pane list HTML, Javascript, CSS amd other files, including images that are attached to the page. Chrome extensions may appear here too.
- The Code Editor pane shows the source code.
- The Javascript Debugging pane is for debugging, we’ll explore it soon
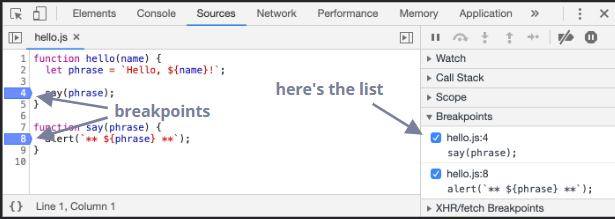
Breakpoints
- Can check code number in Source tab code
we can bebug it in right panel
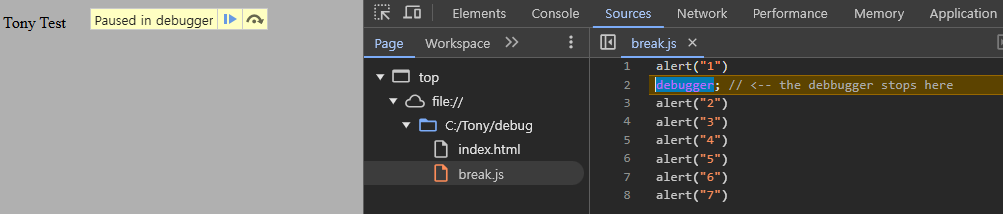
The command “debugger”
- We can also pause the code by using the
debuggercommand in it, like this:
function hello(name) {
	let phrase = `Hello, ${name}!`;

	debugger; // the debugger stops here

	say(phrase);
}

// such command works only when the development tools are open, otherwise the browser ignores it.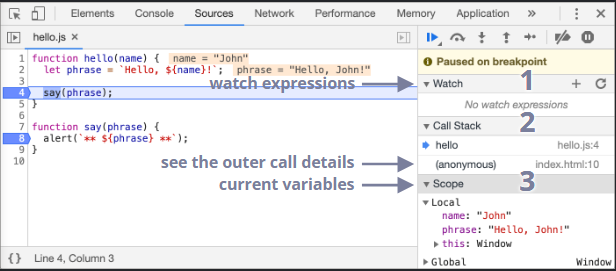
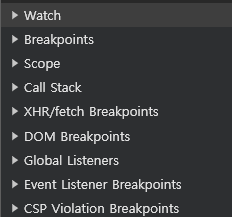
Pause and look around
-
Watch- shows current values for any expressions
- You can click the plus
+and input an expression.
The debugger will show its value,
automatically recalculating it in the process of execution
-
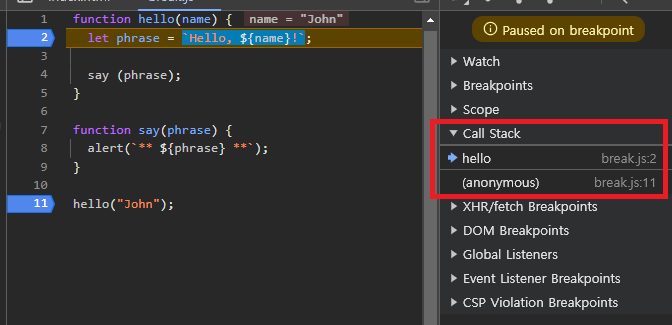
Call Stack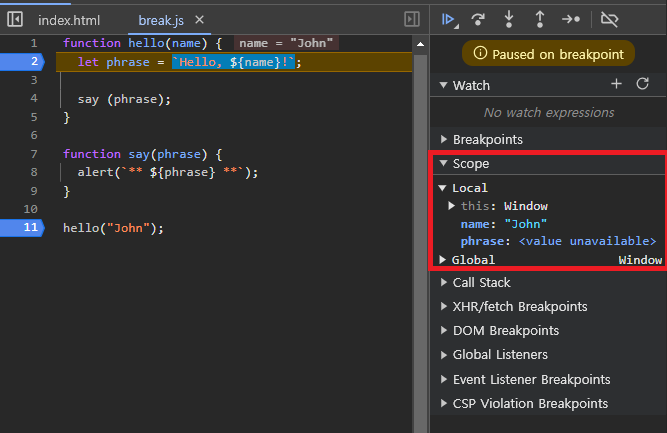
- shows the nested calls chain
- At the current moment the debugger is inside hello() call, called by a script in index.html (no function there, so it’s called “anonymous”).
- If you click on a stack item (e,g, “anonymous”), the debugger jumps to the corresponding code, and all its variables can be examined as well.
-
Scope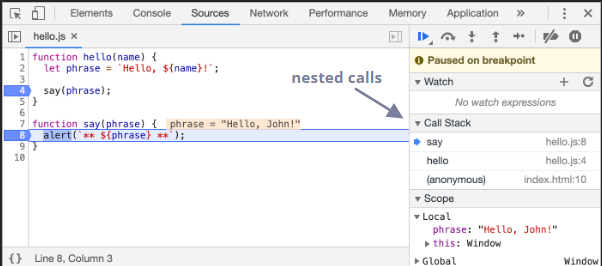
- current variables
- Local shows local function variables. You can also see their values highlihted right over the source.
- Global has global variables (out of any functions).
There’s alsothiskeyword there that we didn’t study yet, but we’ll do that soon.
Tracing the execution
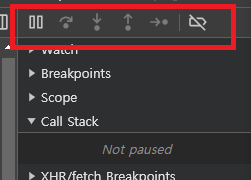
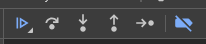
-
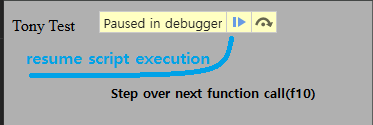
F8- Resume
- Run the next statement. If we click it now, alert will be shown.
- Clicking this again and again will step through all script statements one by one. |
-
F9- Step
- Run the next command
- Run the next statement. If we click it now, alert will be shown.
- Clicking this again and again will step through all script statements one by one.
-
F10- Step over
- Run the next command, but don’t go into a function, hotkey F10
- Similar to the previous “Step” command, but behaves differently if the next statement is a function call (not a built-in, like
alert, but a function of our own).
-
F11- Step into
- If we compare them, the “Step” command goes into a nested function call and pauses the execution at its first line, while “step over” executes the nested function call invisibly to us, skipping the function internals.
- The execution is then paused immediately after that function call.
- That’s good if we’re not interested to see what happens inside the function call. |
-
Shift + F11- Step out of current function
- Continue the execution till the end of the current function.
- That’s handy when we accidentally entered a nested call using [step], but it does not interest us, and we want to continue to its end as soon as possible.
-
Ctrl + F8- Deactivate/Activate breakpoints
- That button does not move the execution. Just a mass on/off for breakpoints.
-
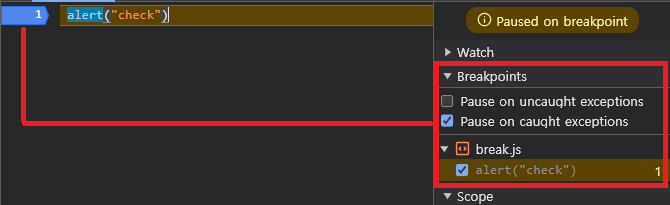
F8 + ctrl + \- Pause/resume script execution
- enable/disable automatic pause in case of an error.
- When enabled, if the developer tools is open, an error during the script execution automatically pause it.
- Then we can analyze variables in the debugger to see what went wrong.
- So if our script dies with an error, we can open debugger, enable this option and reload the page to see where it dies and what’s the context at that moment.
console
- ESC key is opne/close console
- Enter key execute type commends
Logging
- close/open console drawer
ESC
// open console to see
for (let i = 0; i < 5; i++) {
	console.log("value", i);
}
프라다 신은 빈지노와 쿠페를 타는 꿈을 꿨다.