환경 설정
- Jupyter Notebook, Python 3.x
- OpenCV 라이브러리 설치:
- 컴퓨터 비전 분야는 사람이 시각 정보를 입력값으로 하여 행동하기 이전에 생각하고 판단하는 부분을 컴퓨터가 대신하도록 하는 학문, 시각적인 입력 데이터, 즉 영상을 주로 다룸
- OpenCV는 Computer Vision 관련 프로그래밍을 쉽게 할 수 있도록 도와주는 Open Library
- OpenCV는 영상처리, 3D 구성, 추적, 기계학습, 인식 그리고 딥러닝까지 유용한 기능 많음, 상업적인 사용까지 무료
- Anaconda Prompt 에서 다음 명령 수행
pip install opencv-python
import cv2
# cv - 객체 탐지하기 위한 별도의 라이브러리, cv2 - OpenCV
cv2.__version__

#'4.10.0'
이미지 출력
# cv2 자체가 가지고 있는 이미지 출력 기능
import cv2

# imread(경로)
img = cv2.imread('./data/pets.jpg')
# opencv 이미지 출력
cv2.imshow('img',img)
cv2.waitKey(0) # 0: 무한대기 // 지정된 시간동안 사용자 키 입력 대기
cv2.destroyAllWindows() # 모든 창 닫기- 읽기 옵션
- cv2.IMREAD_COLOR: 컬러 이미지, 투명 영역은 무시(기본값)
- cv2.IMREAD_GRAYSCALE: 흑백 이미지
- cv2.IMREAD_UNCHANGED: 투명 영역까지 포함
# cv2 자체가 가지고 있는 이미지 출력 기능
import cv2

# imread(경로)
img_color = cv2.imread('./data/pets.jpg', cv2.IMREAD_COLOR)
img_gray = cv2.imread('./data/pets.jpg', cv2.IMREAD_GRAYSCALE)
img_unchaged = cv2.imread('./data/pets.jpg', cv2.IMREAD_UNCHANGED)

# opencv 이미지 출력
cv2.imshow('img_color',img_color)
cv2.imshow('img_gray',img_gray)
cv2.imshow('img_unchaged',img_unchaged)

cv2.waitKey(0) # 0: 무한대기 // 지정된 시간동안 사용자 키 입력 대기
cv2.destroyAllWindows() # 모든 창 닫기- 이미지 크기 확인
# 이미지 크기 확인
print('color:', img_color.shape)
print('gray:', img_gray.shape) # 2차원 (행, 열)
print('unch:', img_unchaged.shape)

# 행(세로, y), 열(가로, x), 채널
#
color: (427, 640, 3)
gray: (427, 640)
unch: (427, 640, 3)- Matplotlib (그래프 시각화 라이브러리)으로 이미지 출력하기
import cv2
import matplotlib.pyplot as plt
img = cv2.imread('./data/pets.jpg', cv2.IMREAD_COLOR)
img = cv2.cvtColor(img, cv2.COLOR_BGR2RGB) # 색상공간 변형
plt.imshow(img) # cmap='Color' (기본값)
plt.show()
<색상공간 변환>
- 시각은 색상정보에 대해 잘못된 정보를 보내주는 경우가 많음
- 밤에 색상을 볼때 정확한 색상을 보여주지 못함 - 명도 (검정색이 섞이는 것)
- 색상에 빛을 강하게 비추는 경우 정확한 색상을 보여주지 못함 - 채도 (흰색이 섞이는 것)
- 칼라는 너무 많은 정보를 가지고 있기때문에 연산량이 많음 - 실시간 처리가 어려움
- 따라서 gray 이미지나 binary 이미지로 변환해서 처리
- gray 이미지 : 0-255로 된 픽섹로만 구성된 흑백이미지
- 이진 이미지 : 검정색(0)과 흰색(255)으로만 구성된 이미지, 0과 1로 이루어진 이미지
- 특정 패턴이나 물체의 윤곽을 감지
- 배경/물체 구별
- 텍스트 필터링
- 뼈의 윤곽/mri스캔 종양 식별
- 자율주행시 장애물/차선 등 감지
- 제품 결함 및 불량품 식별 등 사용가능
import cv2
import matplotlib.pyplot as plt
img = cv2.imread('./data/pets.jpg', cv2.IMREAD_COLOR)
img = cv2.cvtColor(img, cv2.COLOR_BGR2GRAY) # 색상공간 변형
plt.imshow(img, cmap='gray') # cmap='Color' (기본값)
plt.show()
이진(Binary) 이미지 구성(이미지 이진화)
- 0,1(255) 데이터 구성하기
- cv2.threshold(img, threshold_value, value, flag)
- img : Grayscale 이미지
- threshold_value : 픽셀 임계값 (0과 1로 나누기 위한 기준값)
- value : 임계값보다 클 때 적용되는 값
- flag : 임계값 적용 방법
- cv2.THRESH_BINARY : 임계값보다 픽셀값이 크면 value, 아니면 0을 할당
- cv2.THRESH_BINARY_INV : 임계값보다 픽셀값이 크면 0, 아니면 value를 할당 (cv2.THRESH_BINARY 반대)
- cv2.THRESH_TRUNC : 임계값보다 큰 픽셀 값은 모두 임계값, 아니면 픽셀값은 변경되지 않음 (이미지 밝기 조절에 사용, 밝은 영역을 어둡게 만들어 세부 정보 잘 드러나게)
# 흑백 이미지로 읽어보기
# img 변수에 담고 plt 출력해보기
img = cv2.imread('./data/mokoko.jpg', cv2.IMREAD_GRAYSCALE)

# 이미지 이진화
# _, 변형이미지 = cv2.threshold(대상, 임계값(기준값), 값, 이진화종류값)

_, thr_img = cv2.threshold(img, 70, 255, cv2.THRESH_BINARY)

# plt.subplot(행,열,순서)
plt.subplot(1,2,1)
plt.axis('off')
plt.imshow(img, cmap='gray')

plt.subplot(1,2,2)
plt.axis('off')
plt.imshow(thr_img, cmap='gray')
plt.show()
- 자동으로 입계값을 찾아주는 기능 적용하기: Otsu(오츠)의 이진화
img.shape
# 198*255
img.shape[0]*img.shape[1]

#50490
# 히스토그램
# plt.hist(이미지 1차원)
# -1 가지고 있는 데이터 개수 만큼 알아서 표현
img.reshape(-1).shape
plt.hist(img.reshape(-1))
plt.show()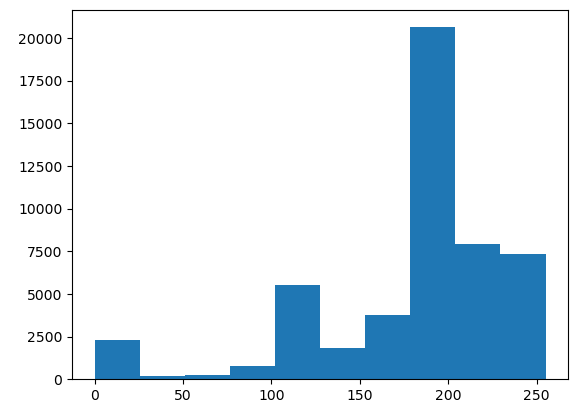
# 흑백 이미지로 읽어보기
# img 변수에 담고 plt 출력해보기
img = cv2.imread('./data/mokoko.jpg', cv2.IMREAD_GRAYSCALE)

# 이미지 이진화
# _, 변형이미지 = cv2.threshold(대상, 임계값(기준값), 값, 이진화종류값)

_, thr_img = cv2.threshold(img, 70, 255, cv2.THRESH_BINARY)
th_val, thr_img2 = cv2.threshold(img, 0, 255, cv2.THRESH_BINARY | cv2.THRESH_OTSU)


# plt.subplot(행,열,순서)
plt.subplot(1,3,1)
plt.title(f"original")
plt.axis('off')
plt.imshow(img, cmap='gray')

plt.subplot(1,3,2)
plt.title(f"binary:{_}")
plt.axis('off')
plt.imshow(thr_img, cmap='gray')

plt.subplot(1,3,3)
plt.title(f"otsu binary:{th_val}")
plt.axis('off')
plt.imshow(thr_img2, cmap='gray')
plt.show()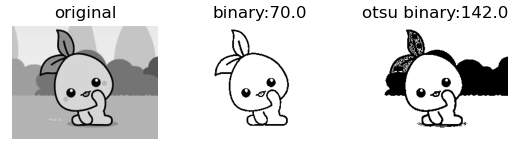
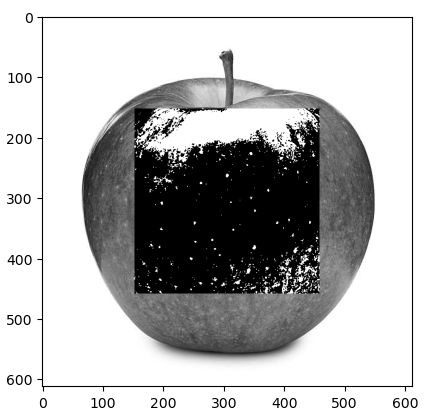
- 이진화로 특정 영역을 표현해보기
- 이미지 중심에 있는 정해진 크기의 사각형 영역을 이진화로 표현해보기
# apple 변수에 흑백사진 읽기
# 흑백 이미지로 출력해보기  - plt
# apple = cv2.imread('./data/apple.jpg', cv2.IMREAD_GRAYSCALE)
# plt.imshow(apple, cmap='gray')

apple = cv2.imread('./data/apple.jpg', cv2.IMREAD_COLOR)
apple_gray = cv2.cvtColor(apple, cv2.COLOR_BGR2GRAY)
height, width  = apple_gray.shape
center_x, center_y = width//2, height//2
# print(height, width)
# print(center_x, center_y)

rect_width, rect_height = center_x//2, center_y//2
# print(rect_width, rect_height)

# 정사각형 영역 접근하기
# 좌상단 좌표, 우하단 좌표 계산하기
top_left_x = center_x - rect_width
top_left_y = center_y - rect_height
bottom_right_x = center_x + rect_width
bottom_right_y = center_y + rect_height

# 사각형 영역 추출하기  - 배열 슬라이싱(접근)
# 배열[행:행,열:열]
rect_region = apple_gray[top_left_y:bottom_right_y, top_left_x:bottom_right_x]
print(rect_region.shape)

# rect_region 이진화 변형해보기 - otsu
val, apple_bin = cv2.threshold(rect_region, 0, 255, cv2.THRESH_BINARY | cv2.THRESH_OTSU)

# 원본 이미지에 이진화 변형 이미지 대입하기
# 복사 먼저 진행
# apple2 = apple_gray # 얕은복사(주소 복사): 원본이 변형되면 복사본도 변형
apple2 = apple_gray.copy() # 깊은복사(원본 형태 복사): 원본 변형되더라도 복사본 그대로 유지됨
apple2[top_left_y:bottom_right_y, top_left_x:bottom_right_x] = apple_bin

plt.imshow(apple2, cmap='gray' )
plt.show()

# (306, 306)
apple_binapple2[top_left_y:bottom_right_y, top_left_x:bottom_right_x]
개발자