Portfolio Optimization with LSTM
Portfolio Optimization-Based Stock Prediction Using Long-Short Term Memory Network in Quantitative Trading
Portfolio Construction은 두가지 작업: asset allocation and security selection
Asset allocation 이란 자산의 비율을 결정하는 것이며 (주식 30%, 현금 70%), security selection 은 자산 내에서 어떤 종목을 고를 것인지 결정하는 것이다. 이 중 security selection 이 prediction에 더 의존적이며, 따라서 LSTM의 직접적인 적용 대상이 된다.
저자들은 포트폴리오 구축의 세가지 요인을 분석한다: expected return, volatility, and correlation of asset returns.
-
Expected return
이 포트폴리오의 기대 수익은 어느 정도인가? -
Volatility (Variance of asset returns)
이 포트폴리오의 위험성은 어느정도인가? 기복이 큰 자산일 수록 위험도가 높음. -
Correlation
주식간의 공분산이 크다면 굳이 다 살 필요가 없음. 서로 상관관계가 없는 종목에 투자해 안정적으로 포트폴리오를 운용.
Previous approaches
Black Litterman Model
https://hwangheek.github.io/2021/black-litterman/ 에서 좋은 분석을 해줌
Optimization Process
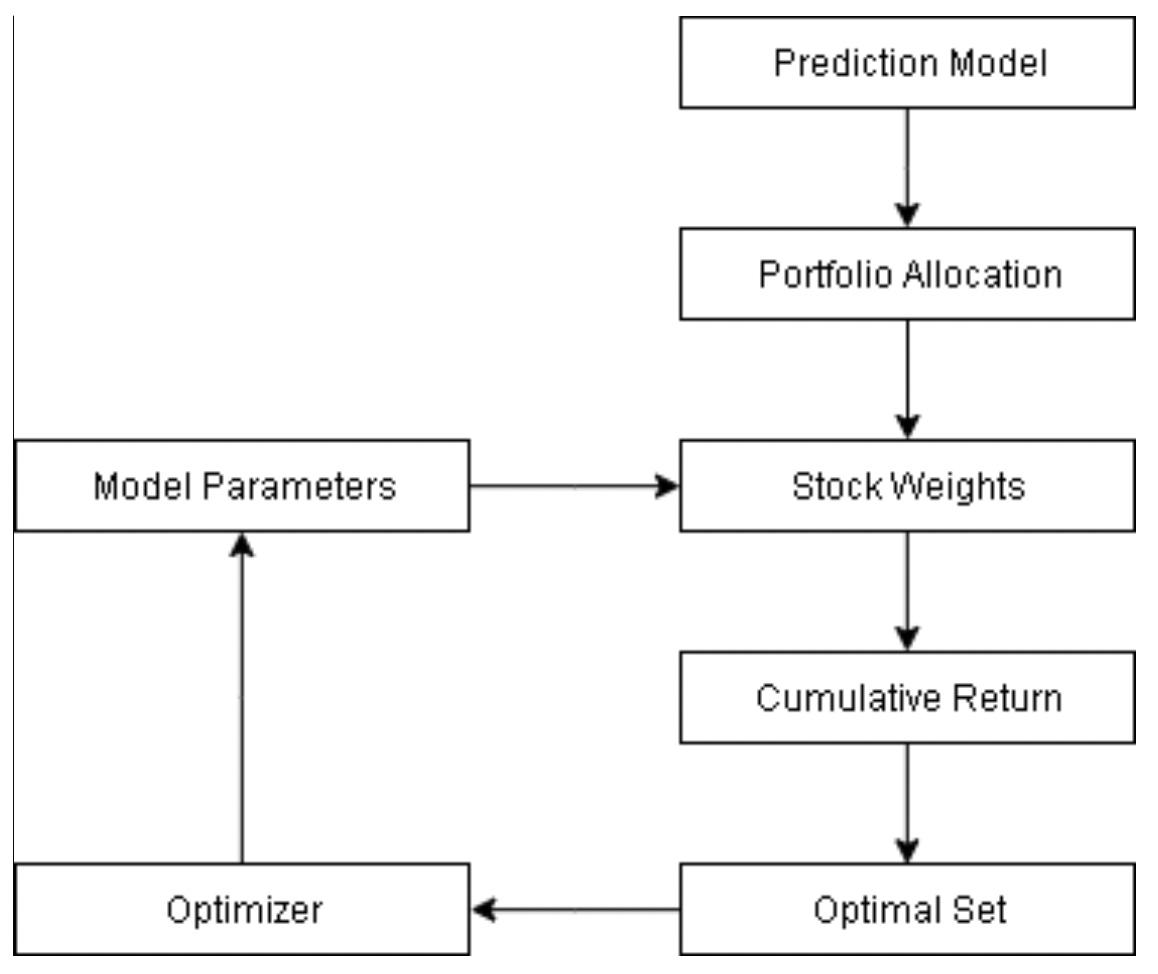
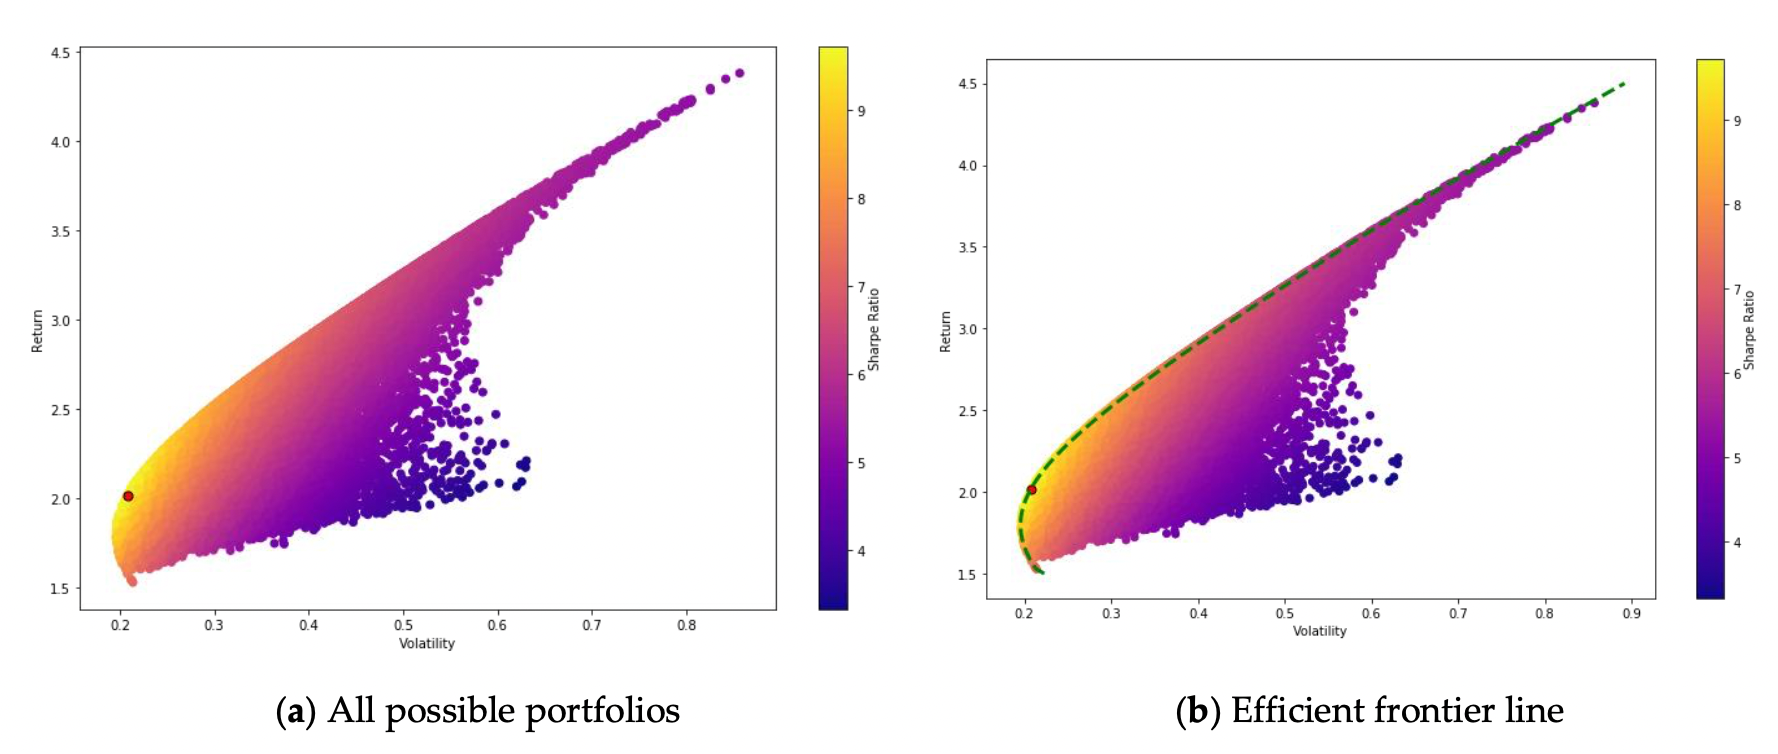
- Monte Carlo Simulation
포트폴리오 비중을 무작위로 생성한 뒤 기대 수익, 변동성, Sharpe Ratio 계산. Sharpe Ratio 를 극대화하는 비중이 나올 때까지 조정, 다음과 같은 결과가 나옴.
- Mean-variance optimization
Experiment and Results
-
Dataset
2008-01 부터 2018-01 까지의 S&P 500의 모든 종목의 Open, High, Low, Close, Volume 활용 -
Hyperparameters
종목 한개를 골라서 실험. 은닉층 수 (2), 뉴런 수 (256, 512) 결정 -
모델
Stacked LSTM (2), Adam Optimizer 활용 -
Metrics
MAE, MSE 사용
LSTM을 사용해 예상 수익이 가장 좋은 4개의 종목을 선정 후 세가지 방식의 포트폴리오 최적화 수행
- Equal Weighted Portfolio
각각의 비중을 0.25로 설정
- Monte Carlo Simulation
위의 방식대로 50000번 반복.
- Mean Variance Optimization
아래의 Proportion 으로 나눠서 backtesting 진행.
Stock Portfolio Optimization Using a Deep Learning LSTM Model
Nine portfolios based on historical prices of 2016-2020
- pharmaceuticals
- infrastructure
- realty
- media
- public sector banks
- private sector banks
- large-cap
- mid-cap
- small-cap.
Data Processing
Gathered with yfinance
- Return: daily and log-scaled
- Volatility: daily and yearly (daily * 250)
- Covariance and Correlation
Portfolio optimization
Minimum risk = minimum variance, where variance within a portfolio consists of 5 terms for weighted sum of std and 10 terms for covariances