Analyzing Historical Stock/Revenue Data and Building a Dashboard
Python Project for Data Science

Table of Contents
- Define a Function that Makes a Graph
- Question 1: Use yfinance to Extract Stock Data
- Question 2: Use Webscraping to Extract Tesla Revenue Data
- Question 3: Use yfinance to Extract Stock Data
- Question 4: Use Webscraping to Extract GME Revenue Data
- Question 5: Plot Tesla Stock Graph
- Question 6: Plot GameStop Stock Graph
!pip install yfinance==0.1.67
#!pip install pandas==1.3.3
#!pip install requests==2.26.0
!mamba install bs4==4.10.0 -y
#!pip install plotly==5.3.1
import yfinance as yf
import pandas as pd
import requests
from bs4 import BeautifulSoup
import plotly.graph_objects as go
from plotly.subplots import make_subplotsDefine Graphing Function
def make_graph(stock_data, revenue_data, stock):
fig = make_subplots(rows=2, cols=1, shared_xaxes=True, subplot_titles=("Historical Share Price", "Historical Revenue"), vertical_spacing = .3)
stock_data_specific = stock_data[stock_data.Date <= '2021--06-14']
revenue_data_specific = revenue_data[revenue_data.Date <= '2021-04-30']
fig.add_trace(go.Scatter(x=pd.to_datetime(stock_data_specific.Date, infer_datetime_format=True), y=stock_data_specific.Close.astype("float"), name="Share Price"), row=1, col=1)
fig.add_trace(go.Scatter(x=pd.to_datetime(revenue_data_specific.Date, infer_datetime_format=True), y=revenue_data_specific.Revenue.astype("float"), name="Revenue"), row=2, col=1)
fig.update_xaxes(title_text="Date", row=1, col=1)
fig.update_xaxes(title_text="Date", row=2, col=1)
fig.update_yaxes(title_text="Price ($US)", row=1, col=1)
fig.update_yaxes(title_text="Revenue ($US Millions)", row=2, col=1)
fig.update_layout(showlegend=False,
height=900,
title=stock,
xaxis_rangeslider_visible=True)
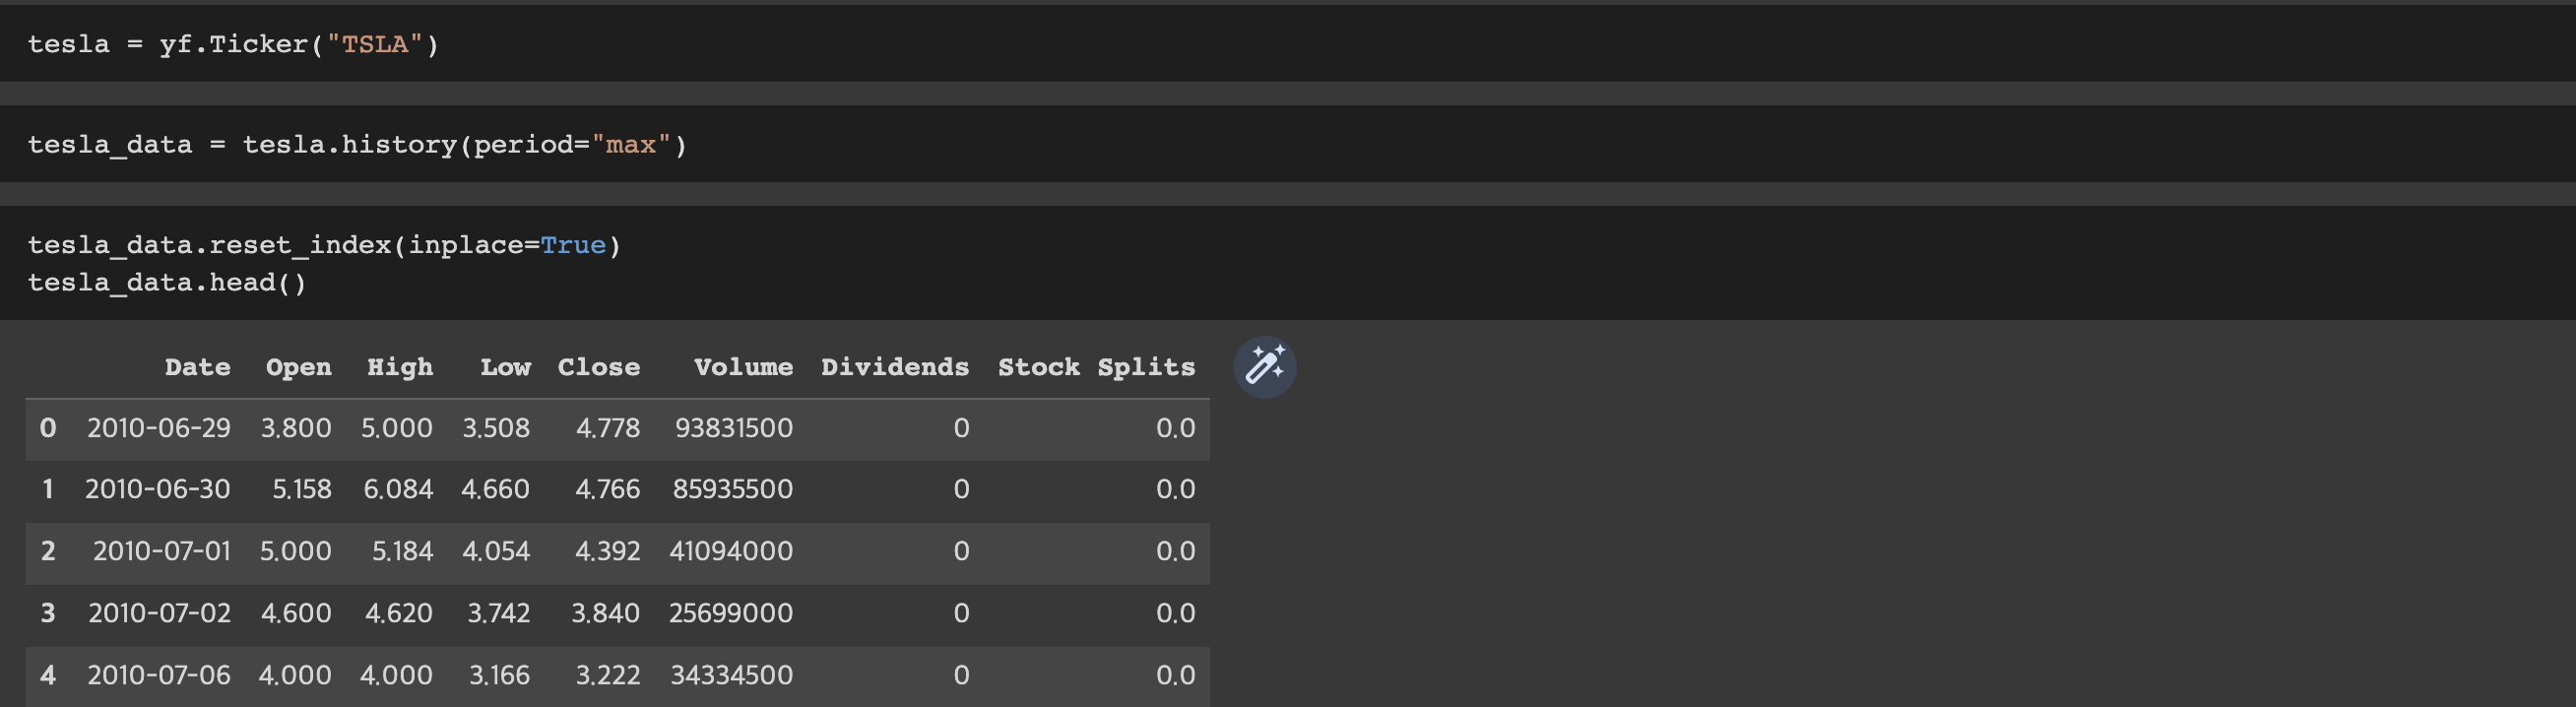
fig.show()Question 1: Use yfinance to Extract Stock Data
Using the Ticker function enter the ticker symbol of the stock we want to extract data on to create a ticker object. The stock is Tesla and its ticker symbol is TSLA.
tesla = yf.Ticker("TSLA")Using the ticker object and the function history extract stock information and save it in a dataframe named tesla_data. Set the period parameter to max so we get information for the maximum amount of time.
tesla_data = tesla.history(period="max")Reset the index using the reset_index(inplace=True) function on the tesla_data DataFrame and display the first five rows of the tesla_data dataframe using the head function. Take a screenshot of the results and code from the beginning of Question 1 to the results below.
Question 2: Use Webscraping to Extract Tesla Revenue Data
Use the requests library to download the webpage https://www.macrotrends.net/stocks/charts/TSLA/tesla/revenue. Save the text of the response as a variable named html_data.
url = "https://www.macrotrends.net/stocks/charts/TSLA/tesla/revenue"
html_data = requests.get(url).text
Parse the html data using beautiful_soup.
soup = BeautifulSoup(html_data,'html5lib')Using BeautifulSoup or the read_html function extract the table with Tesla Quarterly Revenue and store it into a dataframe named tesla_revenue. The dataframe should have columns Date and Revenue.
tesla_revenue=pd.read_html(url, match="Tesla Quarterly Revenue", flavor='bs4')[0]
tesla_revenue.head()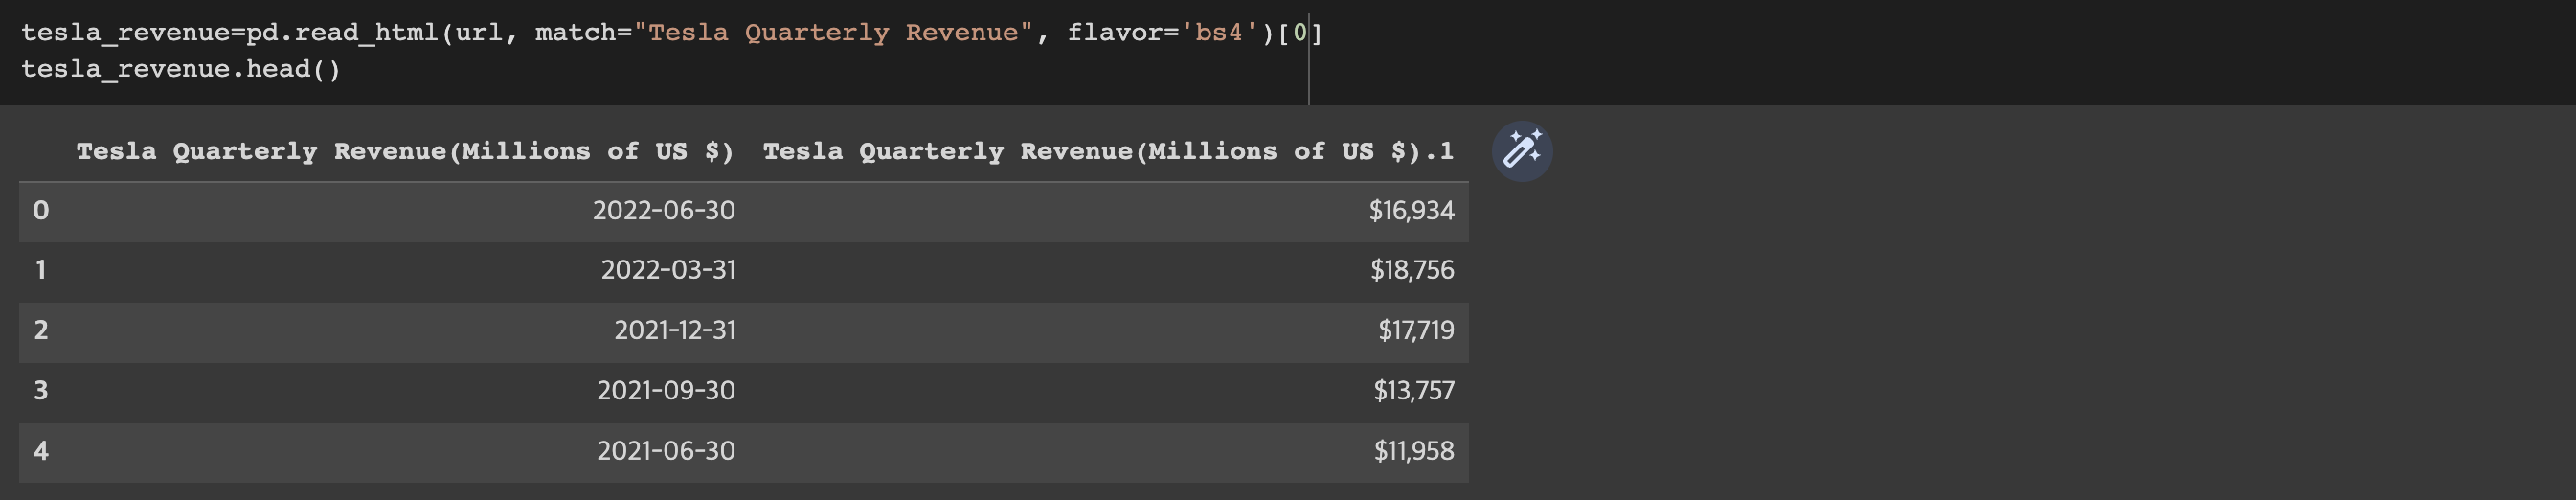
Execute the following line to remove the comma and dollar sign from the Revenue column.
tesla_revenue = tesla_revenue.rename(columns={"Tesla Quarterly Revenue(Millions of US $)":"Date","Tesla Quarterly Revenue(Millions of US $).1":"Revenue"}) #Rename df columns to 'Date' and 'Revenue'
tesla_revenue["Revenue"] = tesla_revenue['Revenue'].str.replace(',|\$',"")
tesla_revenue.head() 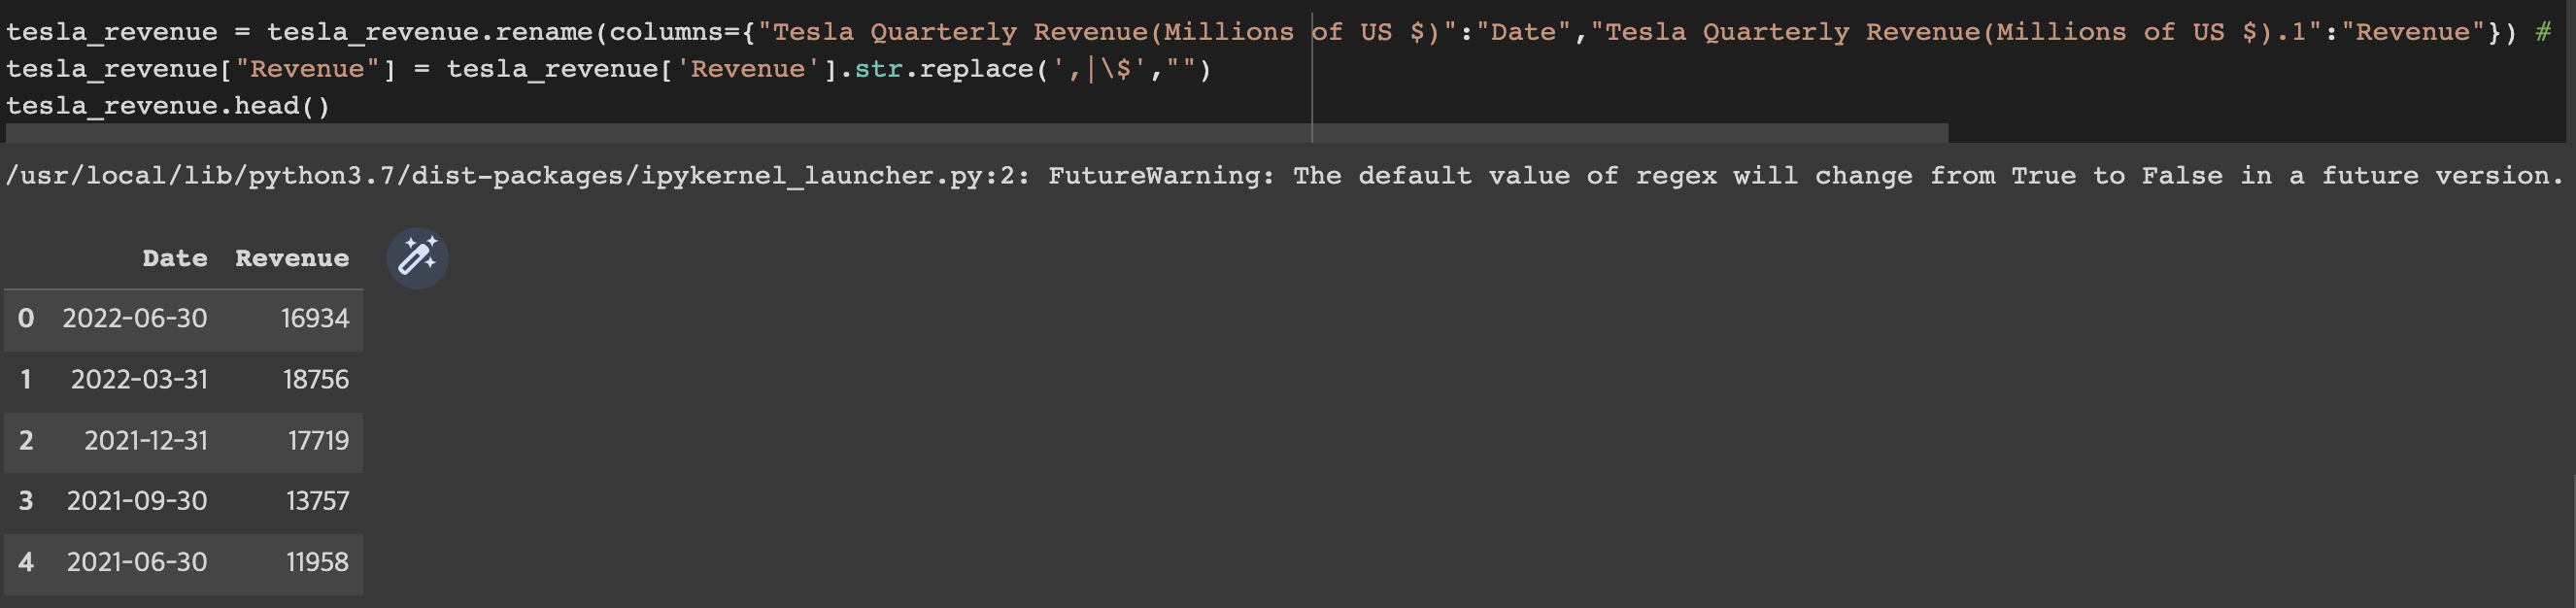
Execute the following lines to remove an null or empty strings in the Revenue column.
tesla_revenue.dropna(inplace=True)

tesla_revenue = tesla_revenue[tesla_revenue['Revenue'] != ""]
Display the last 5 row of the tesla_revenue dataframe using the tail function. Take a screenshot of the results.
tesla_revenue.tail()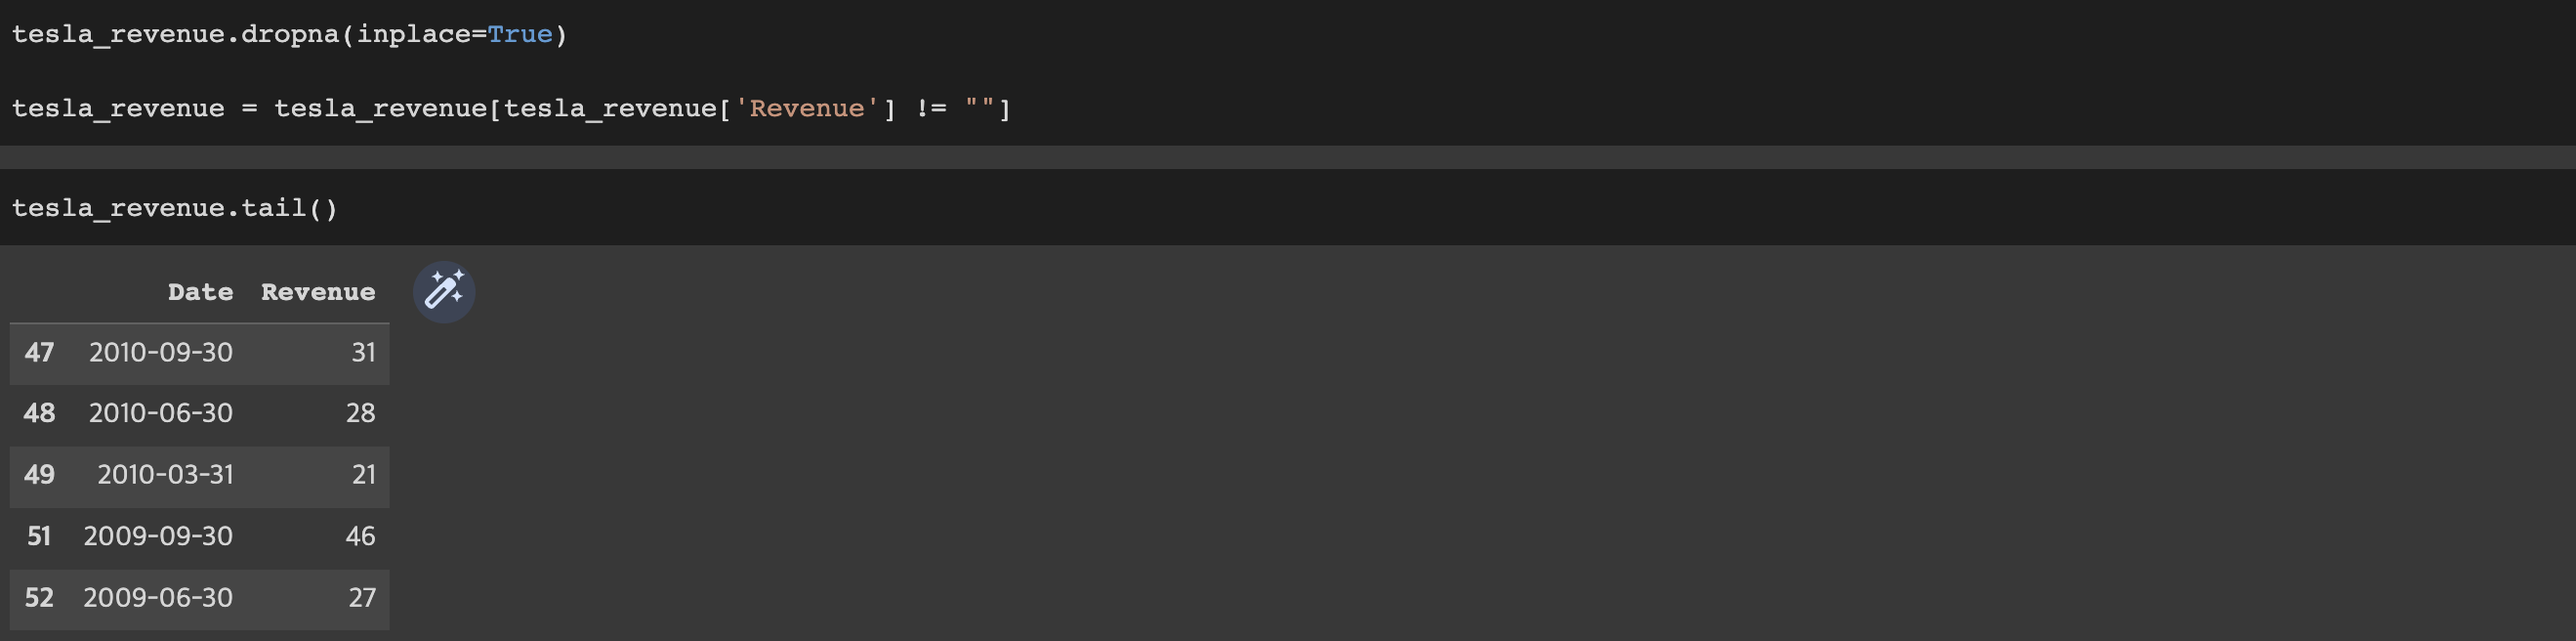
Question 3: Use yfinance to Extract Stock Data
Using the Ticker function enter the ticker symbol of the stock we want to extract data on to create a ticker object. The stock is GameStop and its ticker symbol is GME.
game_stop = yf.Ticker("GME")Using the ticker object and the function history extract stock information and save it in a dataframe named gme_data. Set the period parameter to max so we get information for the maximum amount of time.
gme_data = game_stop.history(period="max")Reset the index using the reset_index(inplace=True) function on the gme_data DataFrame and display the first five rows of the gme_data dataframe using the head function. Take a screenshot of the results and code from the beginning of Question 3 to the results below.
gme_data.reset_index(inplace=True)
gme_data.head()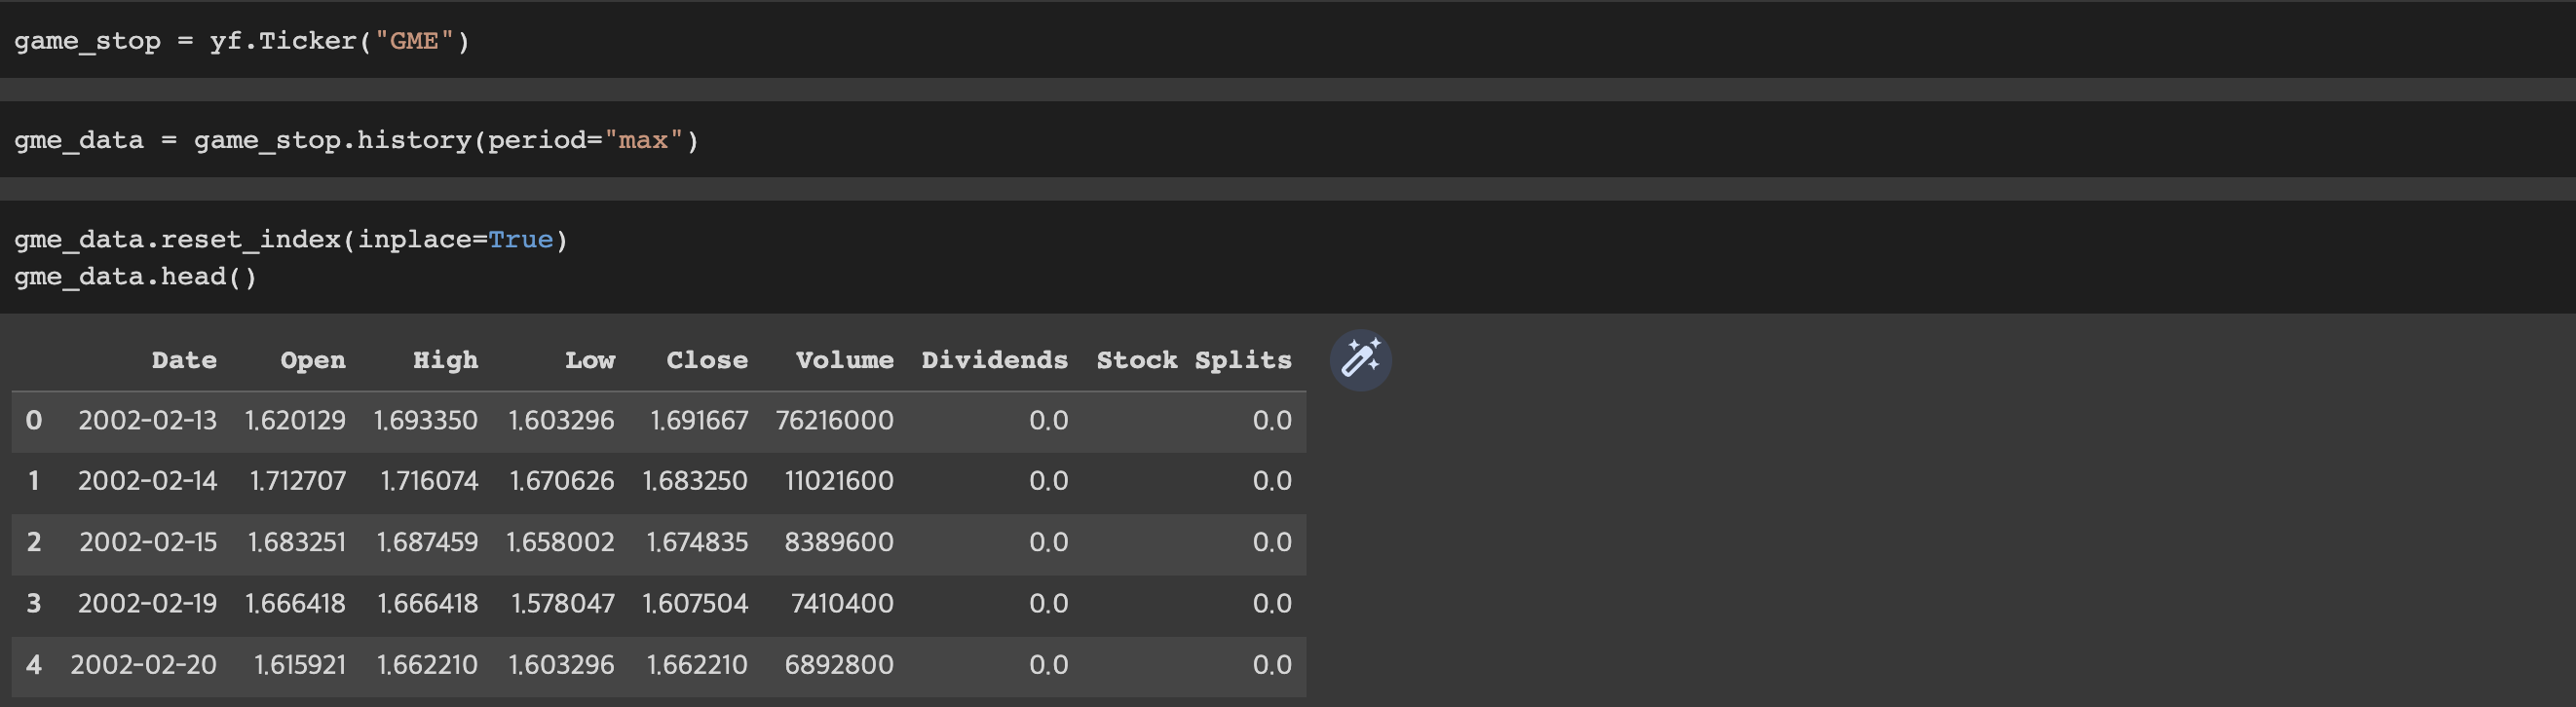
Question 4: Use Webscraping to Extract GME Revenue Data
Use the requests library to download the webpage https://www.macrotrends.net/stocks/charts/GME/gamestop/revenue. Save the text of the response as a variable named html_data.
url = "https://www.macrotrends.net/stocks/charts/GME/gamestop/revenue"
html_data = requests.get(url).text
Parse the html data using beautiful_soup.
soup = BeautifulSoup(html_data,'html5lib')Using BeautifulSoup or the read_html function extract the table with GameStop Quarterly Revenue and store it into a dataframe named gme_revenue. The dataframe should have columns Date and Revenue. Make sure the comma and dollar sign is removed from the Revenue column using a method similar to what you did in Question 2.
gme_revenue=pd.read_html(url,match="GameStop Quarterly Revenue", flavor='bs4')[0]
#gme_revenue.head()
gme_revenue = gme_revenue.rename(columns={"GameStop Quarterly Revenue(Millions of US $)":"Date","GameStop Quarterly Revenue(Millions of US $).1":"Revenue"})
gme_revenue["Revenue"] = gme_revenue['Revenue'].str.replace(',|\$',"")
gme_revenue.head() 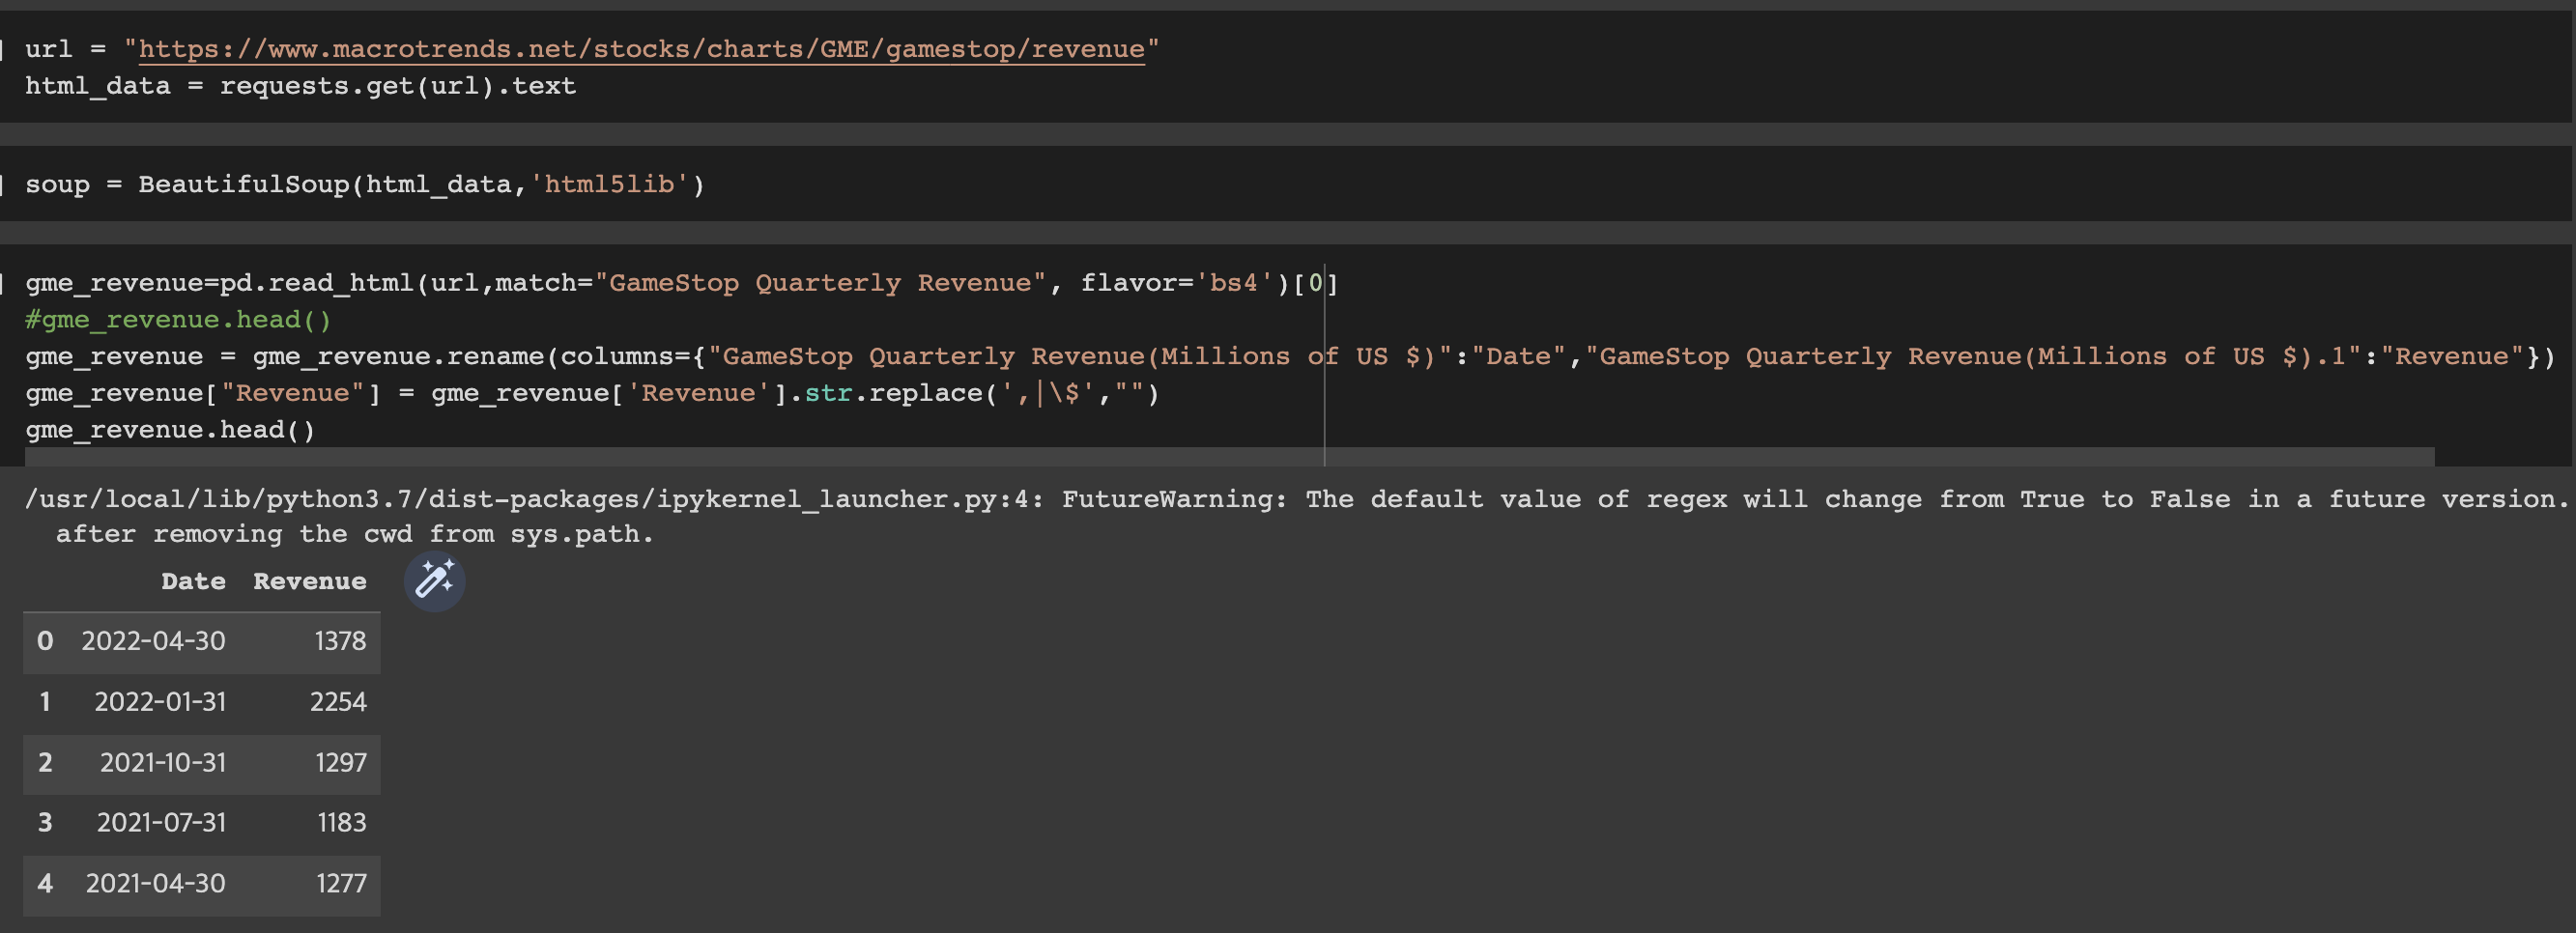
Display the last five rows of the gme_revenue dataframe using the tail function. Take a screenshot of the results.
gme_revenue.dropna(inplace=True)
gme_revenue = gme_revenue[gme_revenue['Revenue'] != ""]

gme_revenue.tail()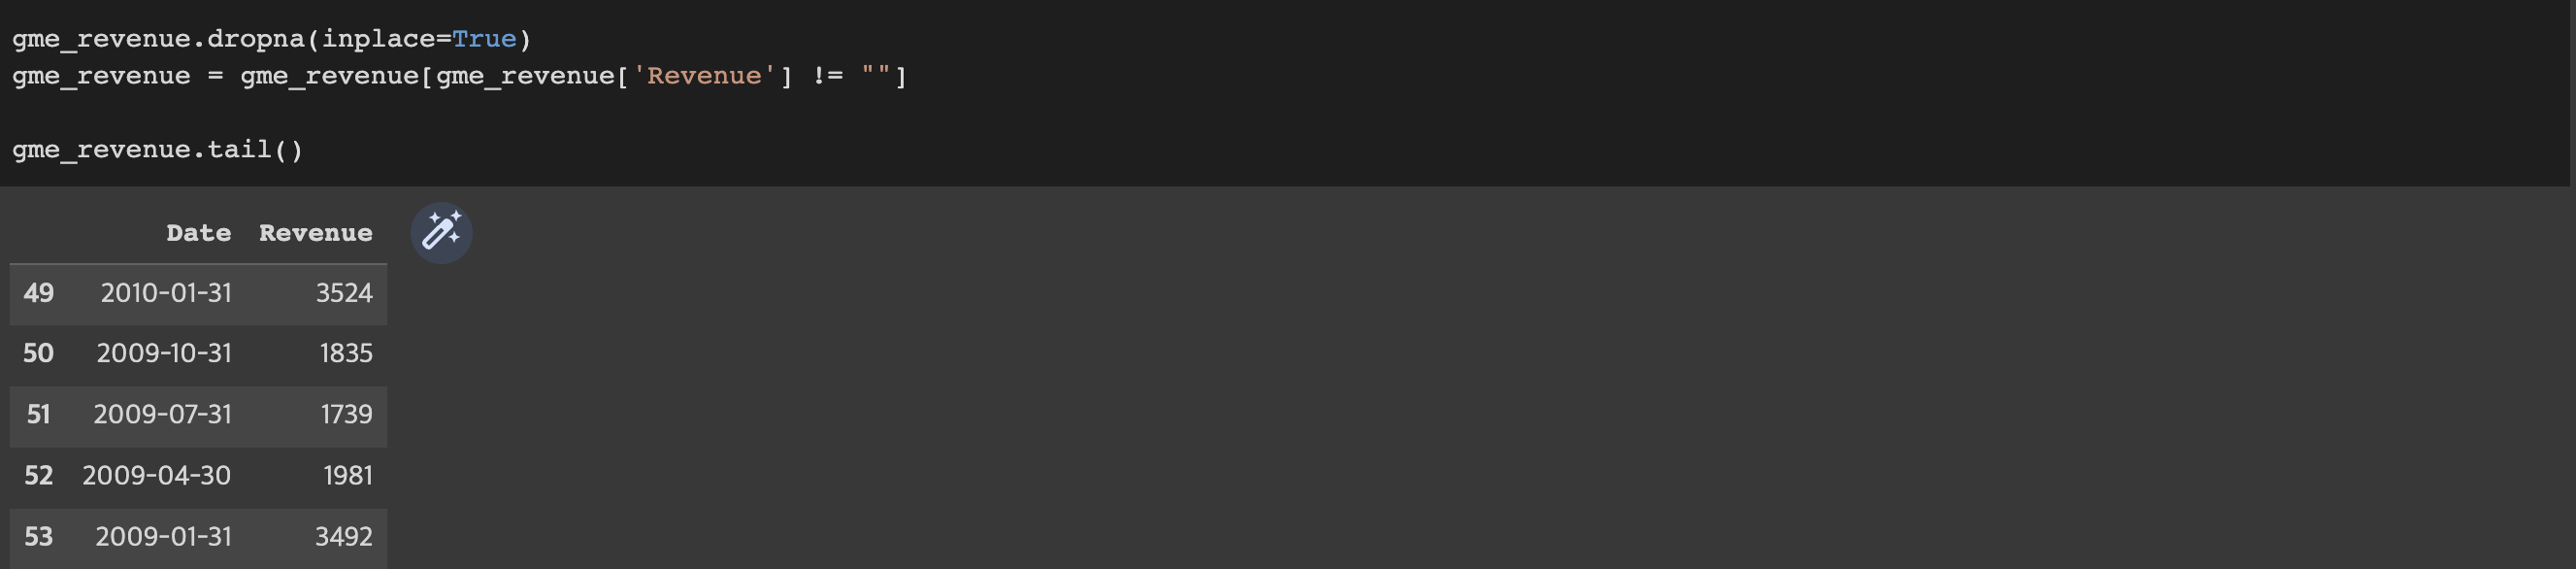
Question 5: Plot Tesla Stock Graph
Use the make_graph function to graph the Tesla Stock Data, also provide a title for the graph. The structure to call the make_graph function is make_graph(tesla_data, tesla_revenue, 'Tesla'). Note the graph will only show data upto June 2021.
make_graph(tesla_data, tesla_revenue, 'Tesla')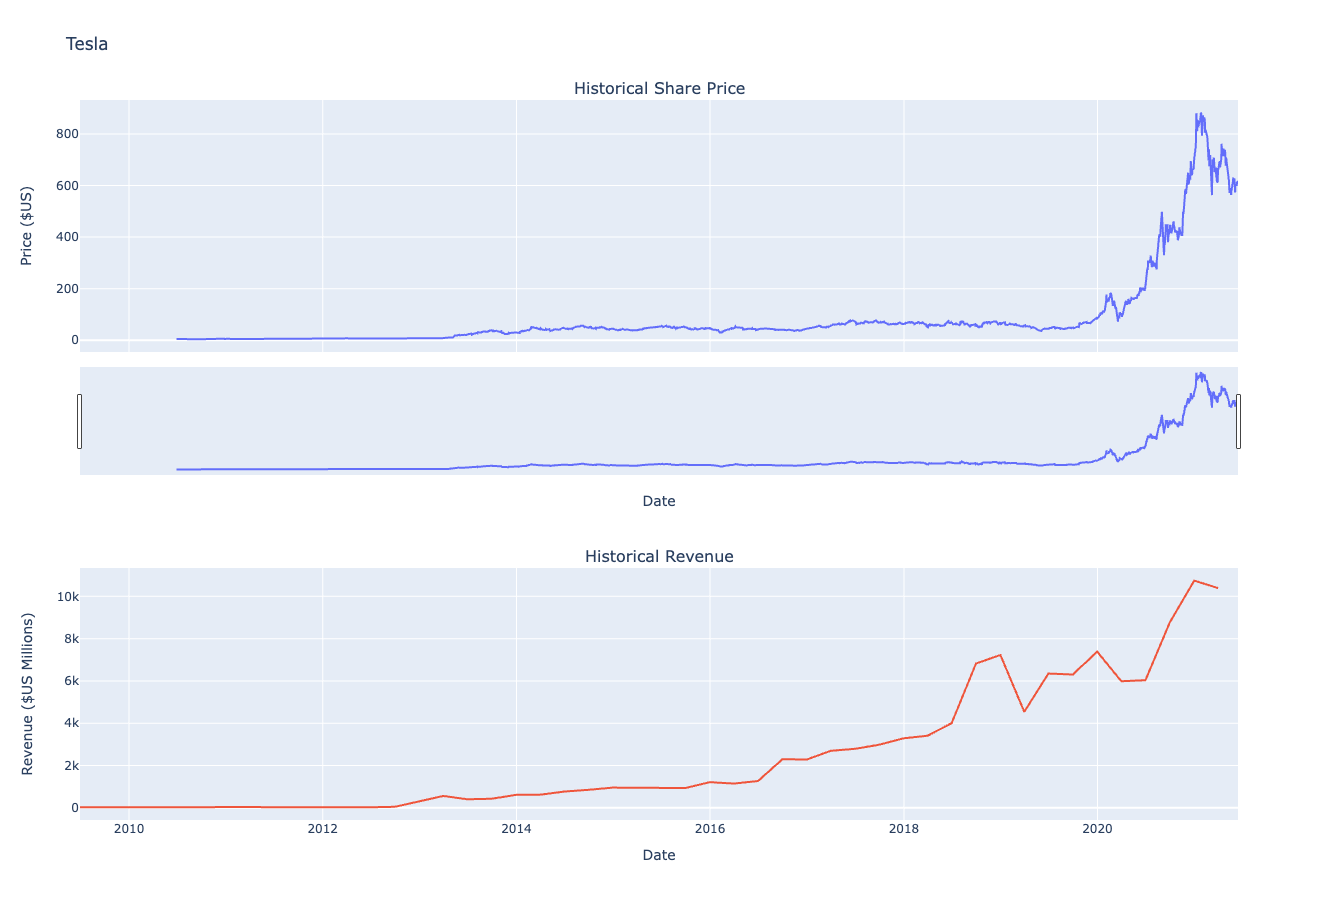
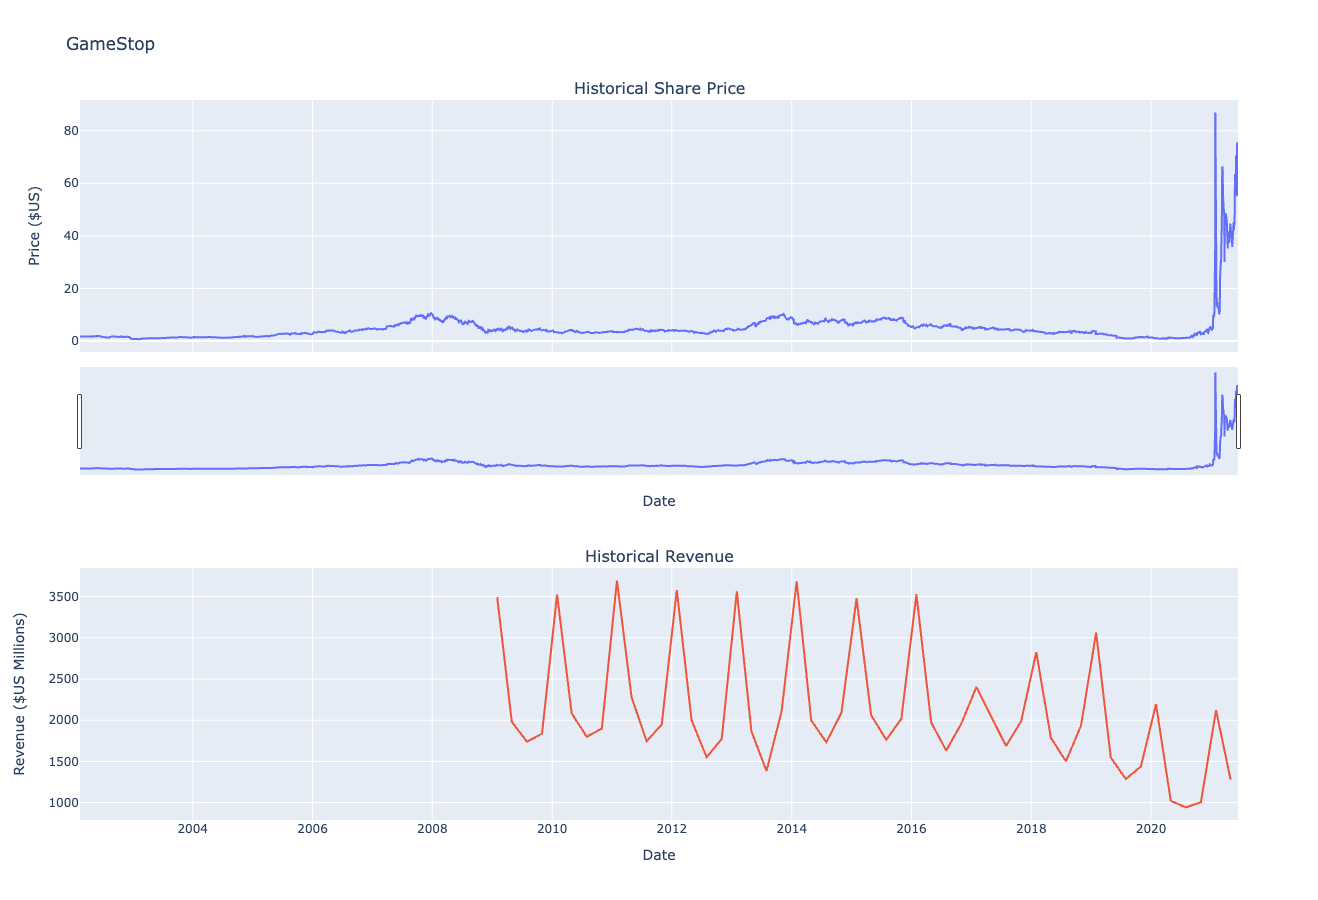
Question 6: Plot GameStop Stock Graph
Use the make_graph function to graph the GameStop Stock Data, also provide a title for the graph. The structure to call the make_graph function is make_graph(gme_data, gme_revenue, 'GameStop'). Note the graph will only show data upto June 2021.
make_graph(gme_data, gme_revenue, 'GameStop')