기존 뷰 분석하기
포켓몬 슬립 수면 리포트에서 수면 타입별 그래프와 사운드 그래프가 있다.
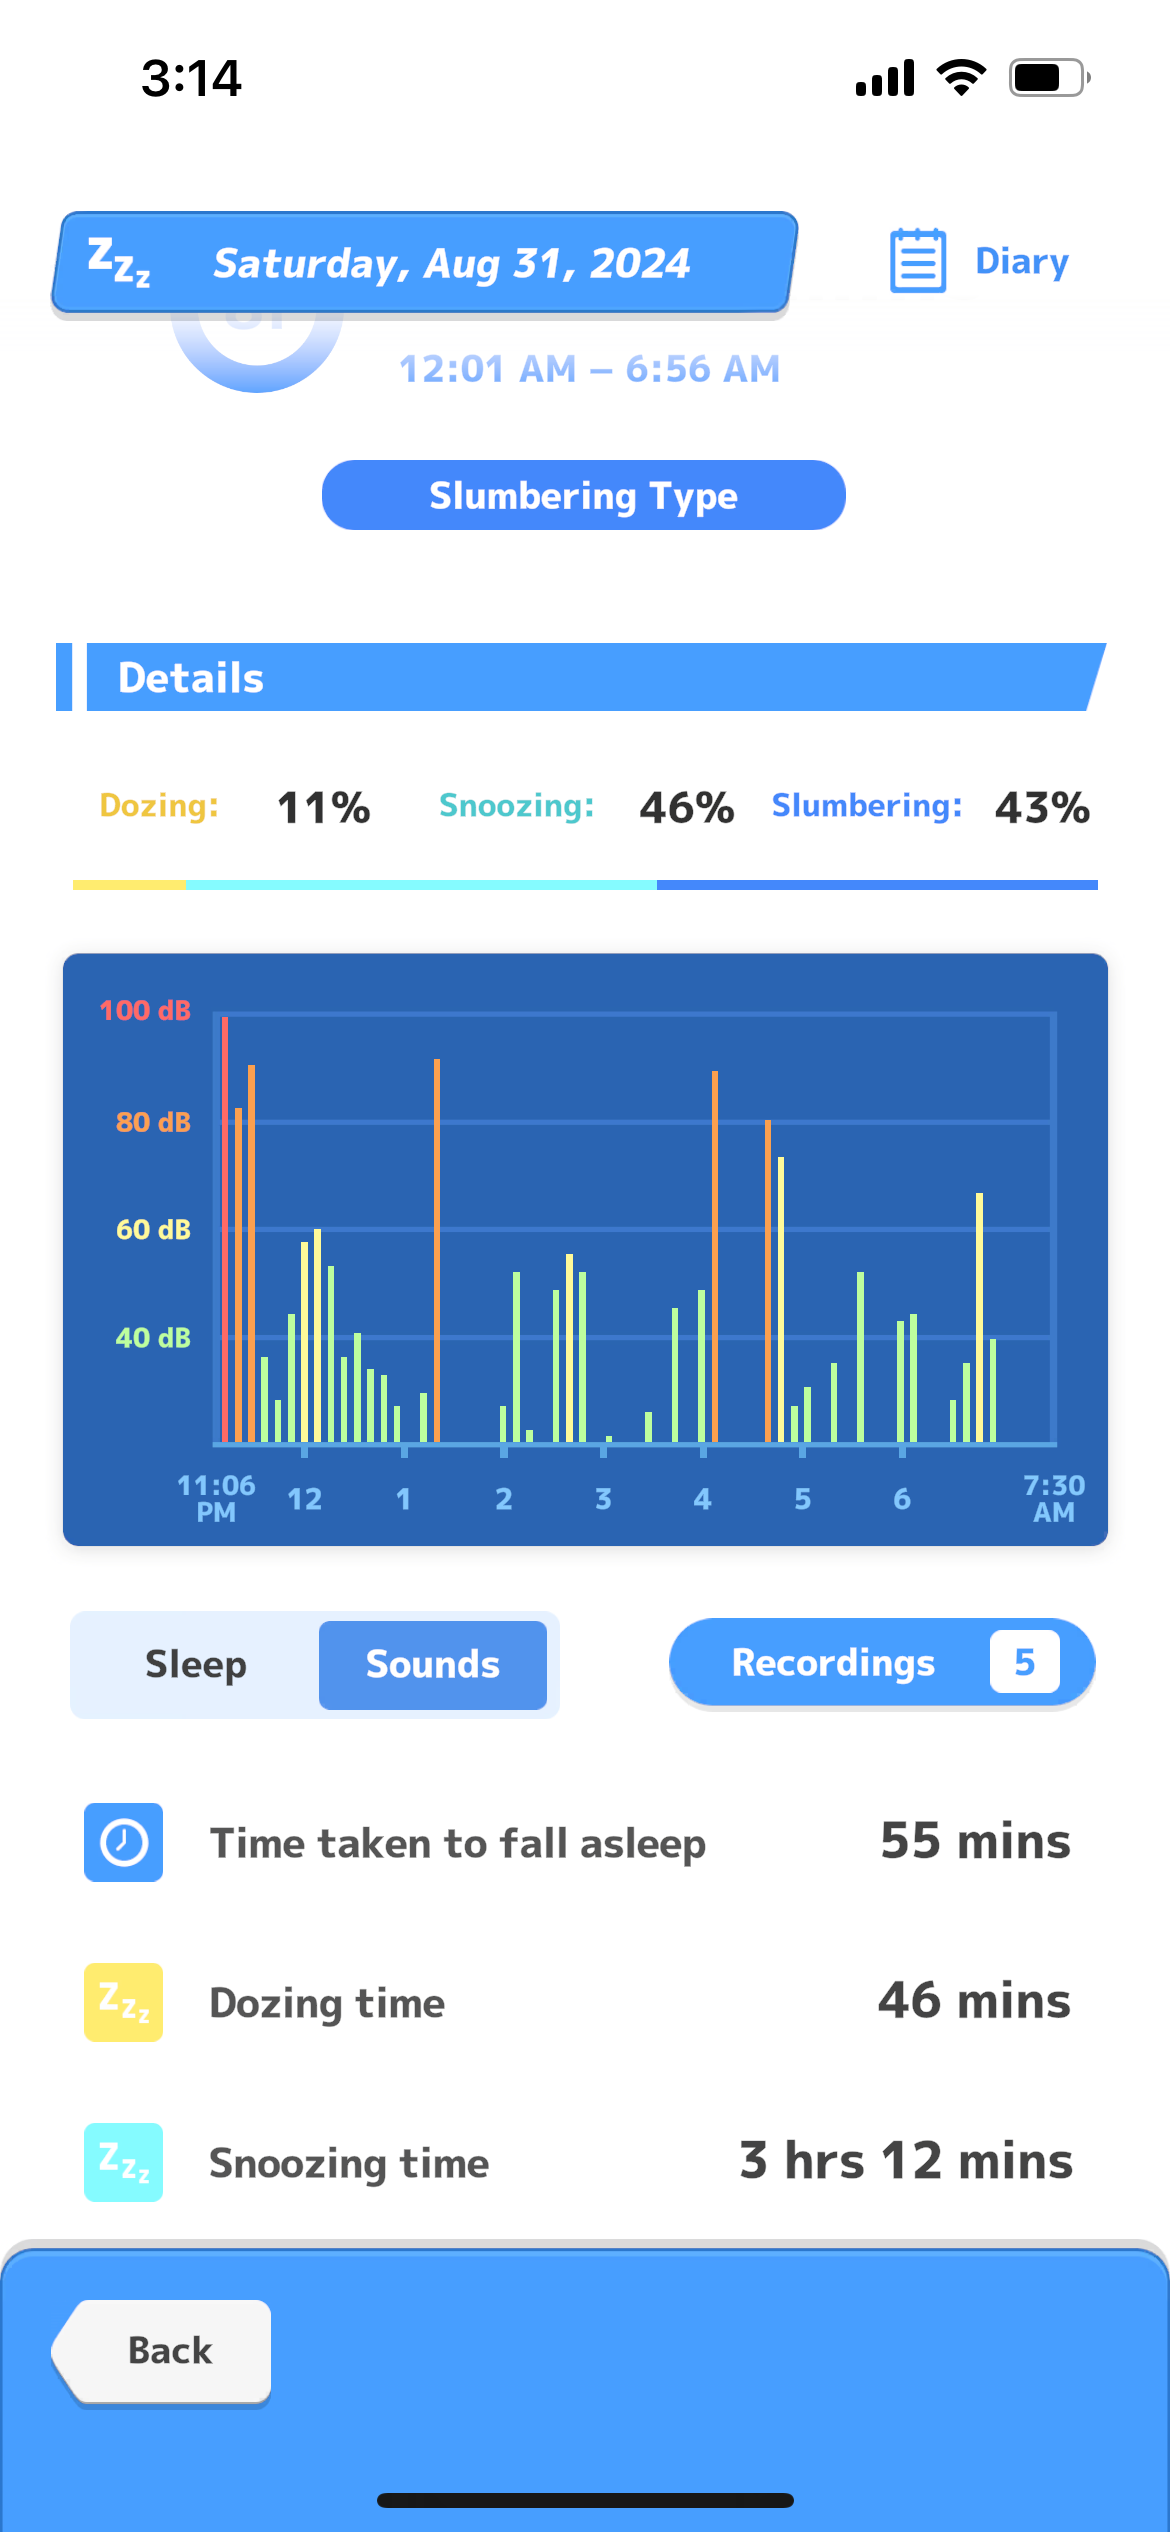
다음과 같이 수면 계측 중에 언제 어느 정도 크기의 소리가 났는지를 기록해서 알려준다 (잠꼬대라던가 코고는 소리같은 걸 알려주는 용도인 듯)
저번 수면타입별 그래프랑 기본 레이아웃 구성은 동일하기에 여기를 참고하고 이 리포트에서는 바로 막대그래프를 그리는 법부터 시작할 것이다.
Y 축 배치하기
저번과는 다르게 이번에는 최소 y축 값이 20이어야 각 레이블이 동일 간격으로 배치가 되다. 또한, 내가 전달한 y축 정보의 최대값과 다르게 더 높은 최대값이 있을 수 있기에 maxYPosition, minYPosition을 추가하였다.
@Composable
fun SoundGraph(
    modifier: Modifier = Modifier,
    soundDataPeriod: SoundDataPeriod,
    yLabelsInfo: List<YLabel>,
    yLabel: @Composable (yLabel: YLabel) -> Unit,
    maxYPosition: Int = 0,
    minYPosition: Int = 0,
    xLabel: @Composable (index: Int) -> Unit,
    hideEdgeXTicker: Boolean = false,
) {
    val graphArea = @Composable {
        GraphArea(
            modifier = Modifier.fillMaxSize(),
            xLabelCount = soundDataPeriod.hourDuration,
            hideEdgeXTicker = hideEdgeXTicker,
            maxYPosition = maxYPosition,
            minYPosition = minYPosition,
            yAxisWidth = yAxisWidth,
            xAxisHeight = xAxisHeight,
            xAxisTickerHeight = xTickerHeight,
            yLabelPositions = yLabelsInfo.map { it.position }
        ) {
            SoundBar(
                soundDataPeriod,
                xAxisHeight = xAxisHeight,
                xAxisTickerHeight = xTickerHeight,
                yAxisWidth = yAxisWidth,
                maxYPosition = maxYPosition,
                minYPosition = minYPosition,
                barWidth = yAxisWidth.toFloat()
            )
        }
    }
}
그리고 GroupArea drawBehind에서
val rowCount = maxYPosition - minYPosition

// Draw Y Axis Guideline
val yLabelHeight = canvasHeight - xAxisTickerHeight - xAxisHeight
val yLabelInterval = yLabelHeight / rowCount

yLabelPositions.forEach { position ->
    val yPos = (rowCount - (position - minYPosition)) * yLabelInterval
    // Align guideline with the label
    drawRect(
        color = yAxisColor,
        topLeft = Offset(yAxisWidth.toFloat(), yPos),
        size = Size(canvasWidth - yAxisWidth * 2, xAxisHeight.toFloat())
    )

    // Draw y-axis tick
    drawRect(
        color = yAxisColor,
        topLeft = Offset(0f, yPos - xAxisHeight / 2),
        size = Size(yAxisTickerWidth.toFloat(), yAxisWidth.toFloat())
    )
}
이렇게 minYPosition을 통해서 전체 높이를 계산하도록 변경하였다.
막대 그래프 그리기
전체 시간축은 분 단위로 간격이 일정하게 나눠져 있다.
따라서, 시작 시간으로부터 minuteDifference만큼 떨어진 위치에 막대기를 그리도록 하였다.
Spacer(
    modifier = Modifier
        .fillMaxSize()
        .drawWithCache {

            val height = size.height - xAxisHeight - xAxisTickerHeight
            val width = size.width - yAxisWidth - yAxisTickerWidth

            val yInterval = height / (maxYPosition - minYPosition)
            val xInterval = width / (soundDataPeriod.minuteDuration)

            onDrawBehind {

                soundDataPeriod.period.forEachIndexed { index, soundData ->
                    drawSoundBar(
                        soundData = soundData,
                        startTime = soundDataPeriod.period.first().time,
                        yInterval = yInterval,
                        xInterval = xInterval,
                        barWidth = barWidth,
                        color = soundData.type.color,
                        minYPosition = minYPosition,
                        size = Size(width, height),
                        animatedProgress = animatedProgress[index]
                    )
                }
            }
        }
)

private fun DrawScope.drawSoundBar(
    soundData: SoundData,
    startTime: LocalTime,
    yInterval: Float,
    xInterval: Float,
    barWidth: Float,
    size: Size,
    minYPosition: Int,
    color: Color,
    animatedProgress: Float,
) {

    val height = (soundData.decibel - minYPosition) * yInterval * animatedProgress
    val xPos = soundData.time.minuteDiff(startTime) * xInterval

    drawRect(
        color = color,
        topLeft = Offset(xPos, size.height - height),
        size = Size(barWidth, height)
    )
}
그러면

이렇게 그려진다!
애니메이션 적용하기
각 막대기마다 애니메이션을 적용해서 아래에서 위로 솟아오르는 애니메이션을 적용할 것이고 왼 -> 오른쪽으로 순차적으로 진행되도록 할 것이다.
@Composable
fun SoundBar(
    soundDataPeriod: SoundDataPeriod,
    xAxisHeight: Int,
    xAxisTickerHeight: Int,
    yAxisWidth: Int,
    yAxisTickerWidth: Int = 0,
    maxYPosition: Int,
    minYPosition: Int,
    barWidth: Float,
) {
    var animationProgress by remember {
        mutableFloatStateOf(0f)
    }

    val animatedProgress = List(soundDataPeriod.period.size) { index ->
        animateFloatAsState(
            targetValue = animationProgress,
            label = "progress_$index",
            animationSpec = tween(
                durationMillis = 2000,
                easing = FastOutSlowInEasing,
                delayMillis = index * 50
            )
        ).value
    }

    LaunchedEffect(Unit) {
        animationProgress = 1f
    }

    Spacer() //drawBehind
}
animateFloatAsState를 통해 구현하였고 delayMillis로 각 막대기 간 시간차를 주었다.
그러면
최종 결과
 다음과 같이 애니메이션이 포함된 막대 그래프가 만들어졌다!
깃헙 링크
Frontend Developer