Why? 왜 배움?
데이터베이스의 상태를 보고 싶을 때는 어떻게 해야 할까?
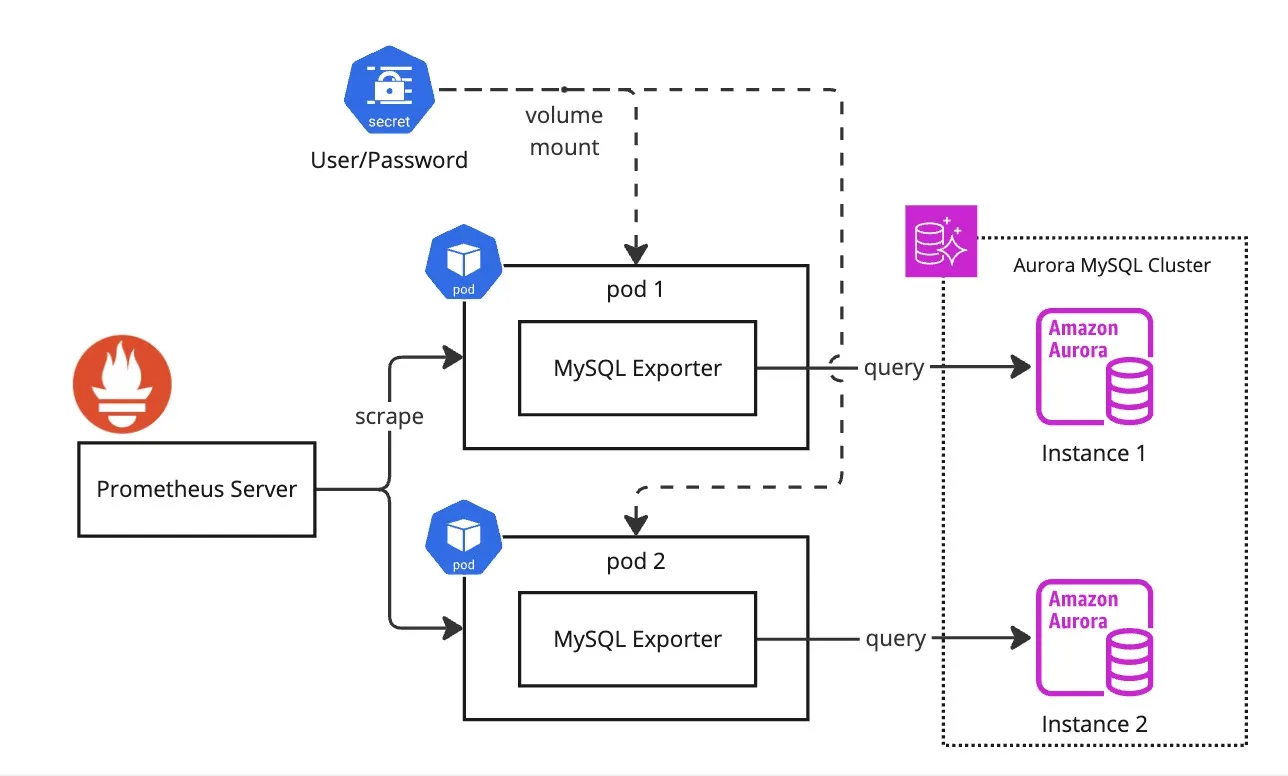
이때 등장하는 것이 바로 MySQL Exporter다.
Node Exporter가 서버의 CPU, 메모리, 디스크를 관찰한다면 MySQL Exporter 는 데이터베이스의 심장박동 — 쿼리 성능, 연결 수, 캐시 상태 등을 실시간으로 관찰하는 도구다.
MySQL Exporter 는 무엇이고 어떻게 동작할까?
What? 뭘 배움?
정의
MySQL Exporter 는 Prometheus에서 제공하는 공식 Exporter 중 하나로, MySQL 서버의 내부 지표를 Prometheus 형식으로 변환해주는 데이터 브릿지 역할을 한다.
쉽게 말해, 데이터베이스의 내부 세계를 Prometheus가 이해할 수 있는 언어로 ‘통역’해주는 역할을 한다고 보면 된다.
예를 들어 다음과 같은 메트릭을 수집할 수 있다.
| 구분 | 주요 메트릭 예시 | 의미 |
|---|---|---|
| 연결(Connection) | mysql_global_status_threads_connected | 현재 연결된 세션 수 |
| 쿼리(Query) | mysql_global_status_queries | 초당 쿼리 실행 횟수 |
| 캐시(Buffer Pool) | mysql_global_status_innodb_buffer_pool_pages_free | InnoDB 버퍼풀의 여유 페이지 |
| 트랜잭션 | mysql_global_status_com_commit, com_rollback | 커밋 및 롤백 빈도 |
| 슬로우 쿼리 | mysql_global_status_slow_queries | 느린 쿼리 누적 횟수 |
이러한 지표는 단순한 수치 그 이상이다. 쿼리 튜닝, 커넥션 풀 관리, 성능 병목 탐지에 직접적인 근거를 제공한다.
기본 동작 원리
MySQL Exporter는 내부적으로 다음 과정을 거친다.
- MySQL 서버에 접속
- Exporter는 설정 파일(
.my.cnf또는 환경변수)을 통해 지정된 계정으로 MySQL에 접근한다. - 주로
PROCESS,REPLICATION,GLOBAL STATUS등의 권한이 필요하다.
- Exporter는 설정 파일(
- 내부 상태 조회
SHOW GLOBAL STATUS,SHOW VARIABLES,SHOW SLAVE STATUS등 명령을 주기적으로 실행한다.- prometheus 에서 설장한 interval 에 따라 호출한다.
prometheus.scrape "mysql" {
  targets = argument.targets.value
  forward_to = argument.forward_to.value
  scrape_interval = "15s"
  scrape_timeout = "10s"

  clustering {
    enabled = false
  }
}
- Prometheus 포맷으로 노출
- 수집된 결과를
/metrics엔드포인트에서 Prometheus가 스크랩할 수 있도록 노출한다.
- 수집된 결과를
필수요건
  prometheus.exporter.mysql "main" {
    // MySQL connection string
    // Format: username:password@(host:port)/database
    data_source_name = "petclinic:petclinic@(mysql:3306)/petclinic"

    // MySQL 메트릭 수집 옵션 (선택사항)
    // collect.info_schema.processlist = true
    // collect.info_schema.innodb_metrics = true
    // collect.info_schema.tables = true
  }
- 호스트에 접근 가능한 계정
How? 어떻게 씀?
1) Container
아래와 같이 docker-compose.yml 선언
services:
  node_exporter:
    image: docker pull prom/mysqld-exporter::latest
    container_name: mysqld_exporter
    restart: unless-stopped
    ports:
      - "9104:9104"
    volumes:
      - '/:/host:ro,rslave'
2) otel-receiver 에서의 prometheus 설
# ====== receivers 선언부 ======
# https://opentelemetry.io/docs/collector/configuration/#receivers
receivers:
  # 웹 서버 컨테이너로부터
  # metric, log, trace 전송받음 (OTLP 프로토콜)
  otlp:
    protocols:
      grpc:
        endpoint: 0.0.0.0:4317
      http:
        endpoint: 0.0.0.0:4318

  # Node Exporter로부터 시스템 메트릭 수집
  # Prometheus 스크랩 방식으로 수집
  prometheus:
    config:
      scrape_configs:
        # Node Exporter
        - job_name: 'mysqld-exporter'
          scrape_interval: 15s
          static_configs:
            - targets: ['mysqld_exporter:9104']


# ,,, processor 나 exporter 에 대해서는 생략 ,,,
3) prometheus 상에서 조회
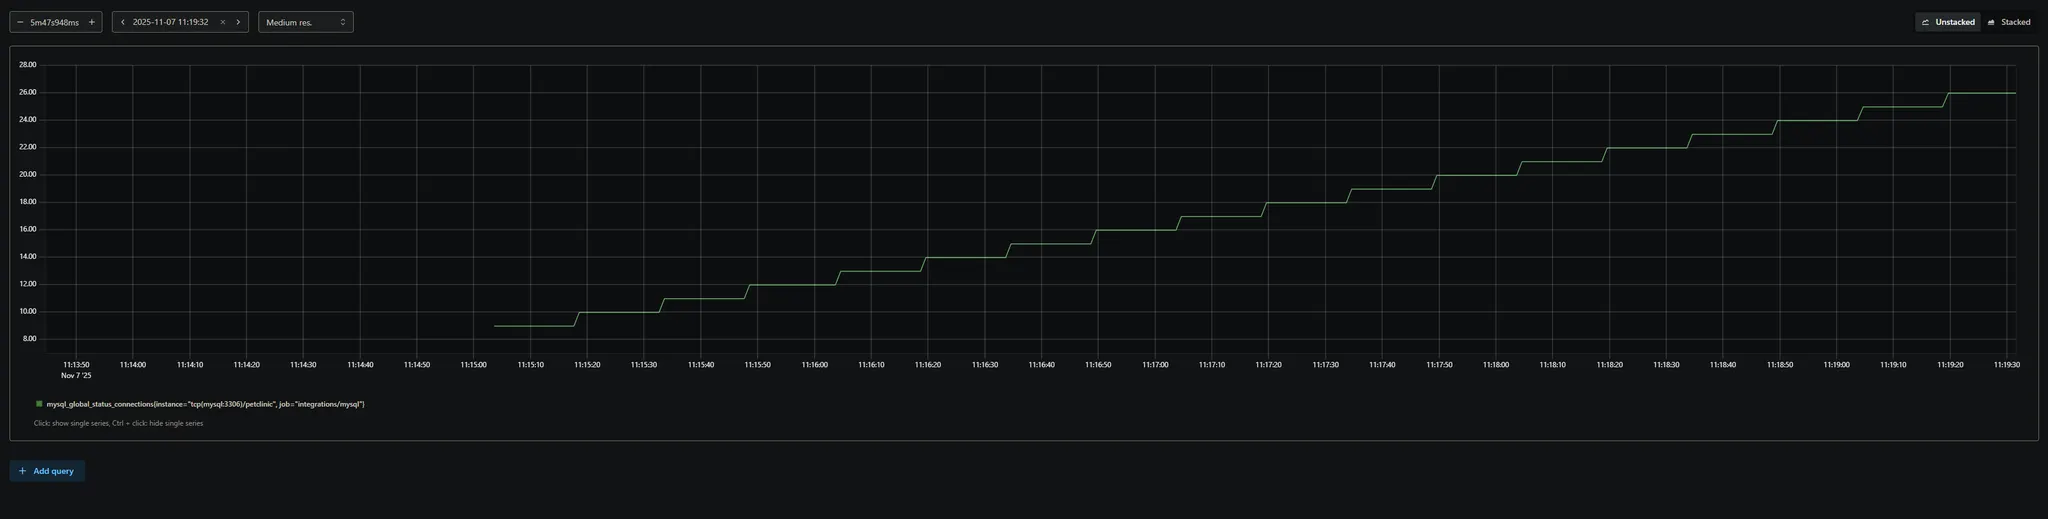
MySQL Exporter가 제공하는 Prometheus 메트릭을 쿼리할 때, 특히 커넥션 상태나 MySQL 서버 상태 관련 메트릭은 주로 mysql_global_status_ 접두사를 가진 메트릭명을 사용합니다.
- 현재 연결 수 (connected connections):
textmysql_global_status_threads_connected
- 최대 허용 연결 수:
textmysql_global_variables_max_connections
- 접속 시도 수:
textmysql_global_status_connections
- 활성 세션 상태별 쓰레드 수:
textmysql_info_schema_processlist_threads
- 슬레이브 복제 상태(복제 지연 등):
textmysql_slave_status_seconds_behind_master
Reference
https://grafana.com/docs/alloy/latest/reference/components/prometheus/prometheus.exporter.mysql/

내 코드로 세상이 더 나은 방향으로 나아갈 수 있기를