Why? 왜 배움?
컨테이너가 띄워진 노드, 즉 호스트 자체의 시스템 메트릭을 보고 싶을 때가 있다.
이 때 해결방법으로 통상 Node Exporter 를 데몬셋으로 데이터를 수집하여 모니터링 인프라로 넘길 수 있다.
그렇다면 Node Exporter 는 무엇이고 어떻게 동작하는지 알아보자.
What? 뭘 배움?
정의
💡
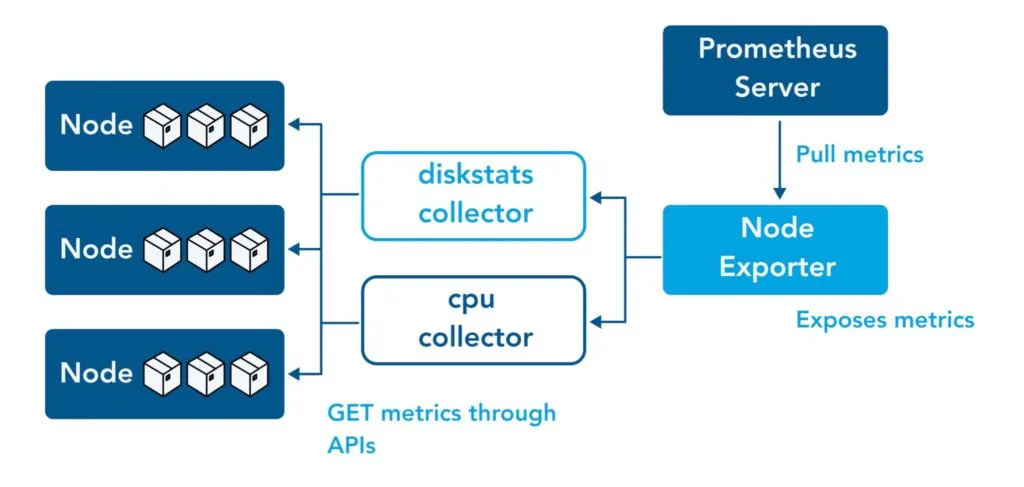
Prometheus Exporter 란 ?
우리가 배우고자 하는 Node Exporter 는 Prometheus Exporter 에 대한 구현체입니다.
그렇다면 Prometheus Exporter 란 무엇일까요?
Prometheus Exporter 는 애플리케이션에 대한 메트릭을 수집하여 데이터를 Prometheus 로 수출(export) 하는 모듈입니다.
아래 단계와 같이 처리합니다.
- 애플리케이션에서 해당 시스템이 사용하는 형식(예: XML)으로 데이터를 수집를 가져와,
- 이를 프로메테우스가 활용할 수 있는 메트릭으로 변환한 후
- 프로메테우스에 제공되는 도메인 URL에 노출하고
- 프로메테우스는 이를 수집하여 메트릭 데이터를 중앙화합니다.
메트릭을 내보내 프로메테우스 메트릭으로 변환할 수 있는 애플리케이션 라이브러리가 방대하며, 해당 목록은 여기에서 확인할 수 있습니다.
대부분의 쿠버네티스 클러스터는 클러스터 수준 서버 메트릭과 컨테이너 수준 메트릭을 노출합니다.
그러나 노드 수준 메트릭은 제공되지 않습니다.
Prometheus Node Exporter는 *NIX 커널이 메트릭 수집기를 통해 노출하는 하드웨어 및 OS 수준 시스템 메트릭을 제공합니다.
제공기능
Node Exporter는 다음과 같은 다양한 메트릭을 측정합니다:
- CPU 수집기 (사용률, 부하, 스로틀링, 스케줄링 통계)
- 메모리 하위 시스템 메트릭 (사용량, 스왑, 휴지페이지, NUMA 통계)
- 스토리지 메트릭 (디스크 I/O, 지연 시간, 처리량, 큐 깊이)
- 파일 시스템 메트릭 (용량, inode, 마운트 플래그)
- 네트워크 통계 (인터페이스 처리량, 연결 상태, 패킷 오류)
- 시스템 메트릭 (가동 시간, 부팅 시간, 파일 디스크립터, 엔트로피 가용성)
- 하드웨어 전용 수집기 (온도, 팬 속도, 전력 소비량)
기본 동작 원리
-
path.rootfs 처리
핵심 메커니즘은 파일 시스템 경로 앞에 path.rootfs 접두사를 추가하는 rootfsFilePath() 함수입니다.
수집기가 시스템 파일에 접근해야 할 때 이 함수를 호출하여 올바른 경로를 얻습니다.
이는 --path.rootfs=/host가 설정되었을 때 /proc/mounts를 /host/proc/mounts로 변환합니다.
이를 통해 익스포터가 컨테이너화되어 실행되든 아니든 관계없이 메트릭스가 /host/media/volume1 대신 /media/volume1로 표시되어 일관성을 유지합니다.
go stuckMountWatcher(labels.mountPoint, success, c.logger) buf := new(unix.Statfs_t) err := unix.Statfs(rootfsFilePath(labels.mountPoint), buf) stuckMountsMtx.Lock() close(success)func TestPathRootfs(t *testing.T) { if _, err := kingpin.CommandLine.Parse([]string{"--path.procfs", "./fixtures_bindmount/proc", "--path.rootfs", "/host"}); err != nil { t.Fatal(err) } expected := map[string]string{ // should modify these mountpoints (removes /host, see fixture proc file) "/": "", "/media/volume1": "", "/media/volume2": "", // should not modify these mountpoints "/dev/shm": "", "/run/lock": "", "/sys/fs/cgroup": "", } filesystems, err := mountPointDetails(slog.New(slog.NewTextHandler(io.Discard, nil))) if err != nil { t.Log(err) } for _, fs := range filesystems { if _, ok := expected[fs.mountPoint]; !ok { t.Errorf("Got unexpected %s", fs.mountPoint) } } -
컬렉터 초기화
node exporter 내부에는 각 메트릭에 대한 수집기 컴포넌트가 있습니다.
(이에 대한 목록은 여기서 살펴보실 수 있습니다.)
이 수집기가 초기화될 때, 구성된 경로를 수신합니다.
가령, btrfs 컬렉터는 sysPath 변수를 사용하여 파일 시스템 핸들을 생성합니다. btrfs_linux.go:43-46
마찬가지로, NFS 컬렉터는 procPath를 사용하여 /proc 파일에 접근합니다. nfs_linux.go:51-54
// NewBtrfsCollector returns a new Collector exposing Btrfs statistics.
func NewBtrfsCollector(logger *slog.Logger) (Collector, error) {
	fs, err := btrfs.NewFS(*sysPath)
	if err != nil {
		return nil, fmt.Errorf("failed to open sysfs: %w", err)
	}

	return &btrfsCollector{
		fs:     fs,

	// ,,, 이하 코드 생략 ,,,

}
// NewNfsCollector returns a new Collector exposing NFS statistics. func NewNfsCollector(logger *slog.Logger) (Collector, error) { fs, err := nfs.NewFS(*procPath) if err != nil { return nil, fmt.Errorf("failed to open procfs: %w", err) } return &nfsCollector{ fs: fs, // ,,, 이하 코드 생략 ,,, } -
네임스페이스 접근
--net=“host” 및 --pid=“host” 플래그는 node_exporter 코드 자체가 아닌 Docker 수준에서 작동합니다.
이 플래그는 Docker에 호스트의 네트워크 및 프로세스 네임스페이스를 컨테이너와 공유하도록 지시하므로, exporter 가 /proc(또는 바인드 마운트를 사용한 /host/proc)에서 읽을 때 컨테이너의 격리된 뷰가 아닌 호스트의 프로세스를 볼 수 있습니다.
필수요건
docker run -d \
  --net="host" \
  --pid="host" \
  -v "/:/host:ro,rslave" \
  quay.io/prometheus/node-exporter:latest \
  --path.rootfs=/host
---
version: '3.8'
services:
  node_exporter:
    image: quay.io/prometheus/node-exporter:latest
    container_name: node_exporter
    command:
      - '--path.rootfs=/host'
    network_mode: host
    pid: host
    restart: unless-stopped
    volumes:
- '/:/host:ro,rslave'- 호스트 네임스페이스 접근 컨테이너는 호스트의 네트워크 및 프로세스 네임스페이스에 접근하기 위해 --net=“host” 및 --pid=“host” 플래그를 사용해야 합니다. README.md:44-50
- 루트 파일시스템 바인드 마운트 호스트의 루트 파일시스템을 컨테이너에 마운트합니다(예: -v “/:/host:ro,rslave”). README.md:47
- 경로 접두사 구성 --path.rootfs=/host 플래그를 사용하여 node_exporter에 호스트 파일 시스템이 마운트된 위치를 알려줍니다. 이 접두사는 수집기가 메트릭을 읽을 때 모든 파일 시스템 경로 앞에 추가됩니다.
How? 어떻게 씀?
1) Container
아래와 같이 docker-compose.yml 선언
services:
node_exporter:
image: quay.io/prometheus/node-exporter:latest
container_name: node_exporter
command:
- '--path.rootfs=/host'
network_mode: host
pid: host
restart: unless-stopped
volumes:
- '/:/host:ro,rslave'2) otel-receiver 에서의 prometheus 설
# ====== receivers 선언부 ======
# https://opentelemetry.io/docs/collector/configuration/#receivers
receivers:
  # 웹 서버 컨테이너로부터
  # metric, log, trace 전송받음 (OTLP 프로토콜)
  otlp:
    protocols:
      grpc:
        endpoint: 0.0.0.0:4317
      http:
        endpoint: 0.0.0.0:4318

  # Node Exporter로부터 시스템 메트릭 수집
  # Prometheus 스크랩 방식으로 수집
  prometheus:
    config:
      scrape_configs:
        # Node Exporter
        - job_name: 'node-exporter'
          scrape_interval: 15s
          static_configs:
            - targets: ['node_exporter:9100']


# ,,, processor 나 exporter 에 대해서는 생략 ,,,
Reference
https://prometheus.io/docs/instrumenting/exporters/
https://www.virtana.com/glossary/what-is-a-node-exporter/
https://www.opsramp.com/guides/prometheus-monitoring/prometheus-node-exporter/