Why? 왜 배움?
데이터베이스 쿼리 성능은 애플리케이션 전체 성능에 직접적인 영향을 미친다.
운영 환경에서 어떤 쿼리가 느린지 실시간으로 파악하기는 쉽지 않다.
하지만 운영 중인 서비스에서 아래와 같은 요청이 들어올 때가 있다.
- "어제 갑자기 API 응답이 느려졌는데 원인을 모르겠어요"
- "특정 시간대에만 느려지는 쿼리가 있는 것 같은데 찾기 어려워요"
- "슬로우 쿼리 로그는 있지만 알림이 안 와서 놓치고 있어요"
이에 따라 본 포스트에서는 다음과 같은 내용을 다뤄보고자 한다.
- 슬로우 쿼리를 로그 상으로 보는 법
- 슬로우 쿼리를 자동으로 감지하고 알림을 받는 방법
- 센트리
- 그라파나
What? 뭘 배움?
Hibernate 상에서 감지
아래와 같이 application properties 를 설정하면
설정한 슬로우 쿼리 임계시간보다 느린 쿼리들이 로그 형태로 출력된다.
# Hibernate 6.6 JPA 설정 (로컬 환경)
# 참고: https://docs.hibernate.org/orm/6.6/userguide/html_single/Hibernate_User_Guide.html
spring:
  datasource:
    hikari:
      leak-detection-threshold: 2000      # 커넥션 누수 감지 임계값 (2초 넘게 반환 안 되면 스택트레이스 출력)
      maximum-pool-size: 20               # 최대 커넥션 풀 크기 (기본 10에서 임시 상향, DB가 감당 가능할 때만)
      connection-timeout: 30000           # 커넥션 대기 시간 (30초)
  jpa:
    hibernate:
      ddl-auto: none                      # DDL 자동생성 정책 (none: 스키마 자동생성 비활성화)
    show-sql: false                       # SQL 쿼리 콘솔 출력 여부
    open-in-view: false                   # OSIV(Open Session In View) 사용 여부 (false 권장)
    properties:
      hibernate:
        default_batch_fetch_size: 1000    # 배치 페칭 기본 크기 (N+1 문제 해결, 최적화 옵션)
        generate_statistics: false        # JPA/Hibernate 통계 수집 여부 (성능 모니터링용)
        jdbc:
          time_zone: Asia/Seoul           # JDBC 타임존 설정
          batch_size: 1000                # JDBC 배치 크기 (bulk insert/update 시 사용)
        order_inserts: true               # INSERT 문 정렬 (배치 효율성 향상)
        order_updates: true               # UPDATE 문 정렬 (배치 효율성 향상)
        globally_quoted_identifiers: true # 모든 식별자 인용 처리 (예약어 사용 가능)
        format_sql: true                  # SQL문 포맷팅하여 출력 (가독성 향상)
        highlight_sql: true               # SQL문에 색상 부여 (콘솔 가독성 향상)
        dialect: org.hibernate.dialect.PostgreSQLDialect  # PostgreSQL 방언 설정
        # 슬로우 쿼리 설정 (Hibernate 6.6+)
        # 참고: https://docs.hibernate.org/orm/6.6/javadocs/org/hibernate/cfg/JdbcSettings.html#LOG_QUERIES_SLOWER_THAN_MS
        session:
          events:
            log:
              LOG_QUERIES_SLOWER_THAN_MS: ${SLOW_QUERY_LIMIT:1}  # 슬로우 쿼리 로깅 임계값 (밀리초 단위)

# Config 설정
decorator:
  datasource:
    p6spy:
      enable-logging: true

# 로깅 설정
# 참고: https://docs.hibernate.org/orm/6.6/userguide/html_single/Hibernate_User_Guide.html#logging
logging:
  level:
    root: INFO                                # 루트 로거 레벨
    com.restApi.restApiSpringBootApp: DEBUG   # 애플리케이션 로그
    org.springframework: WARN                 # Spring Framework 로그
    org.springframework.web: DEBUG            # Spring MVC 웹 요청/응답 로그
    # Hibernate 로깅 설정
    org.hibernate.cfg: DEBUG                  # Hibernate 설정 로딩 로그
    org.hibernate.SQL: DEBUG                  # SQL 쿼리 실행 로그
    org.hibernate.SQL_SLOW: INFO              # 슬로우 쿼리 로그 (필수!)
    org.hibernate.stat: DEBUG                 # JPA/Hibernate 통계 로그 (쿼리 실행 횟수, 캐시 히트율 등)
    org.hibernate.orm.jdbc.bind: TRACE        # JDBC 파라미터 바인딩 값 로깅 (보안 주의)
실제로 아래 테스트코드를 실행해보면 슬로우 쿼리가 찍힌 걸 볼 수 있다.
// 지도 상 모든 영상 조회 (PostGIS 사용)

@Test
@DisplayName("지도 상 모든 영상 조회")
void 지도상모든영상조회() {
    // GIVEN
    ContentOnMapSearchReq req = ContentOnMapSearchReq.builder()
        // 서울 시청 위경도
        .userLatitude(BigDecimal.valueOf(37.5666))
        .userLongitude(BigDecimal.valueOf(126.9782))
        // 반경 50 미터
        .mapRadius(BigDecimal.valueOf(50))
        // 카테고리 조회는 없음
        .ccIdxes(null)
        .build();

    // WHEN
    ListResult<ContentOnMapSearchResp> contentsOnMap = contentUseCase.getContentsOnMap(req);

    // THEN
    assertNotNull(contentsOnMap);
    assertFalse(contentsOnMap.getList().isEmpty());
}
OpenJDK 64-Bit Server VM warning: Sharing is only supported for boot loader classes because bootstrap classpath has been appended
05:47:06.084 [main] DEBUG org.hibernate.SQL -
    select
        ce1_0."co_idx",
        ce1_0."ad_idx",
        ce1_0."co_approval_status",
        ce1_0."co_balance_empty",
        ce1_0."co_deny_reason",
        ce1_0."co_description",
        ce1_0."co_explanation",
        ce1_0."co_external_url",
        ce1_0."co_language",
        ce1_0."co_memo",
        ce1_0."co_normal_reward",
        ce1_0."co_point",
        ce1_0."co_pop_enabled",
        ce1_0."co_registered_at",
        ce1_0."co_service_type",
        ce1_0."co_title",
        ce1_0."co_upload_type",
        ce1_0."co_video_url",
        ce1_0."co_view_end_time",
        ce1_0."co_view_start_time",
        ce1_0."created_at",
        ce1_0."is_visible",
        ce1_0."me_idx",
        ce1_0."updated_at",
        cce1_0."cc_idx",
        cce1_0."cc_name",
        cce1_0."cc_seq",
        cce1_0."created_at",
        cce1_0."is_visible",
        cce1_0."updated_at"
    from
        "hama_content" ce1_0
    left join
        "hama_content_by_category" cbce1_0
            on cbce1_0."co_idx"=ce1_0."co_idx"
    left join
        "hama_content_category" cce1_0
            on cbce1_0."cc_idx"=cce1_0."cc_idx"
    where
        ce1_0."co_approval_status"=?
        and ce1_0."is_visible"=?
        and st_dwithin(st_transform(ce1_0."co_point", ?), st_transform(?, ?), ?)=?
05:47:06.088 [main] TRACE org.hibernate.orm.jdbc.bind - binding parameter (1:VARCHAR) <- [APPROVED]
05:47:06.088 [main] TRACE org.hibernate.orm.jdbc.bind - binding parameter (2:VARCHAR) <- [YES]
05:47:06.088 [main] TRACE org.hibernate.orm.jdbc.bind - binding parameter (3:INTEGER) <- [3857]
05:47:06.090 [main] TRACE org.hibernate.orm.jdbc.bind - binding parameter (4:GEOMETRY) <- [POINT (126.9782 37.5666)]
05:47:06.289 [main] TRACE org.hibernate.orm.jdbc.bind - binding parameter (5:INTEGER) <- [3857]
05:47:06.289 [main] TRACE org.hibernate.orm.jdbc.bind - binding parameter (6:DOUBLE) <- [50.0]
05:47:06.289 [main] TRACE org.hibernate.orm.jdbc.bind - binding parameter (7:BOOLEAN) <- [true]
## 아래와 같이 슬로우 쿼리 시간과 그에 해당하는 쿼리를 보여준다.
05:47:06.356 [main] INFO  org.hibernate.SQL_SLOW - Slow query took 65 milliseconds [select ce1_0."co_idx",ce1_0."ad_idx",ce1_0."co_approval_status",ce1_0."co_balance_empty",ce1_0."co_deny_reason",ce1_0."co_description",ce1_0."co_explanation",ce1_0."co_external_url",ce1_0."co_language",ce1_0."co_memo",ce1_0."co_normal_reward",ce1_0."co_point",ce1_0."co_pop_enabled",ce1_0."co_registered_at",ce1_0."co_service_type",ce1_0."co_title",ce1_0."co_upload_type",ce1_0."co_video_url",ce1_0."co_view_end_time",ce1_0."co_view_start_time",ce1_0."created_at",ce1_0."is_visible",ce1_0."me_idx",ce1_0."updated_at",cce1_0."cc_idx",cce1_0."cc_name",cce1_0."cc_seq",cce1_0."created_at",cce1_0."is_visible",cce1_0."updated_at" from "hama_content" ce1_0 left join "hama_content_by_category" cbce1_0 on cbce1_0."co_idx"=ce1_0."co_idx" left join "hama_content_category" cce1_0 on cbce1_0."cc_idx"=cce1_0."cc_idx" where ce1_0."co_approval_status"=? and ce1_0."is_visible"=? and st_dwithin(st_transform(ce1_0."co_point",?),st_transform(?,?),?)=?]
05:47:06.402 [main] DEBUG org.hibernate.SQL -
    select
        ae1_0."ad_idx",
        ae1_0."ad_id",
        ae1_0."ad_password",
        ae1_0."created_at",
        ae1_0."updated_at"
    from
        "hama_admin" ae1_0
    where
        ae1_0."ad_idx"=?
05:47:06.402 [main] TRACE org.hibernate.orm.jdbc.bind - binding parameter (1:BIGINT) <- [1]
## 아래와 같이 슬로우 쿼리 시간과 그에 해당하는 쿼리를 보여준다.
05:47:06.455 [main] INFO  org.hibernate.SQL_SLOW - Slow query took 53 milliseconds [select ae1_0."ad_idx",ae1_0."ad_id",ae1_0."ad_password",ae1_0."created_at",ae1_0."updated_at" from "hama_admin" ae1_0 where ae1_0."ad_idx"=?]
이제 각각의 옵션에 대해서 무슨 역할을 수행하는지 알아보자.
1. DataSource 설정 (HikariCP)
# Hibernate 6.6 JPA 설정 (로컬 환경)
# 참고: https://docs.hibernate.org/orm/6.6/userguide/html_single/Hibernate_User_Guide.html
spring:
  datasource:
    hikari:
      leak-detection-threshold: 2000      # 커넥션 누수 감지 임계값 (2초 넘게 반환 안 되면 스택트레이스 출력)
      maximum-pool-size: 20               # 최대 커넥션 풀 크기 (기본 10에서 임시 상향, DB가 감당 가능할 때만)
      connection-timeout: 30000           # 커넥션 대기 시간 (30초)딩 값 로깅 (보안 주의)
HikariCP는 Spring Boot의 기본 커넥션 풀로, 고성능과 낮은 오버헤드가 특징이다.
| 속성 | 기본값 | 설명 | 참고 문서 |
|---|---|---|---|
leak-detection-threshold | 0 (비활성) | 커넥션 누수 감지 임계값(ms). 설정 시간 내 반환되지 않으면 스택트레이스 출력. 권장: 2000ms | HikariCP GitHub |
maximum-pool-size | 10 | 최대 커넥션 풀 크기. DB 서버 용량과 동시 요청 수를 고려하여 설정 | HikariCP GitHub |
connection-timeout | 30000 | 커넥션 획득 대기 시간(ms). 초과 시 SQLException 발생 | HikariCP GitHub |
2. JPA 핵심 설정
spring:
  jpa:
    hibernate:
      ddl-auto: none                      # DDL 자동생성 정책 (none: 스키마 자동생성 비활성화)
    show-sql: false                       # SQL 쿼리 콘솔 출력 여부
open-in-view: false # OSIV(Open Session In View) 사용 여부 (false 권장)| 속성 | 기본값 | 설명 | 참고 문서 |
|---|---|---|---|
ddl-auto | none | DDL 자동 생성 정책. none/validate/update/create/create-drop. 운영환경은 none 필수 | Spring Boot Docs |
show-sql | false | SQL 콘솔 출력. org.hibernate.SQL 로거와 중복되므로 false 권장 | Spring Boot Docs |
open-in-view | true | OSIV 패턴. false 권장 (성능 이슈, 트랜잭션 범위 명확화) | Spring Boot Docs |
3. Hibernate 속성 설정
spring:
  jpa:
    properties:
      hibernate:
        default_batch_fetch_size: 1000    # 배치 페칭 기본 크기 (N+1 문제 해결, 최적화 옵션)
        generate_statistics: false        # JPA/Hibernate 통계 수집 여부 (성능 모니터링용)
        jdbc:
          time_zone: Asia/Seoul           # JDBC 타임존 설정
          batch_size: 1000                # JDBC 배치 크기 (bulk insert/update 시 사용)
        order_inserts: true               # INSERT 문 정렬 (배치 효율성 향상)
        order_updates: true               # UPDATE 문 정렬 (배치 효율성 향상)
        globally_quoted_identifiers: true # 모든 식별자 인용 처리 (예약어 사용 가능)
        format_sql: true                  # SQL문 포맷팅하여 출력 (가독성 향상)
        highlight_sql: true               # SQL문에 색상 부여 (콘솔 가독성 향상)
        dialect: org.hibernate.dialect.PostgreSQLDialect  # PostgreSQL 방언 설정
        # 슬로우 쿼리 설정 (Hibernate 6.6+)
        # 참고: https://docs.hibernate.org/orm/6.6/javadocs/org/hibernate/cfg/JdbcSettings.html#LOG_QUERIES_SLOWER_THAN_MS
        session:
          events:
            log:
              LOG_QUERIES_SLOWER_THAN_MS: ${SLOW_QUERY_LIMIT:1}  # 슬로우 쿼리 로깅 임계값 (밀리초 단위)
3.1 배치 처리 및 성능 최적화
| 속성 | 권장값 | 설명 | 참고 문서 |
|---|---|---|---|
default_batch_fetch_size | 100~1000 | IN 절 배치 페칭 크기. N+1 문제 해결의 핵심 옵션 | Hibernate User Guide - Fetching |
jdbc.batch_size | 100~1000 | JDBC 배치 크기. Bulk INSERT/UPDATE 시 성능 향상 | Hibernate User Guide - Batching |
order_inserts | true | INSERT 문 정렬. 같은 테이블 INSERT를 그룹화하여 배치 효율 향상 | Hibernate User Guide - Batching |
order_updates | true | UPDATE 문 정렬. 같은 테이블 UPDATE를 그룹화하여 배치 효율 향상 | Hibernate User Guide - Batching |
3.2 SQL 출력 및 디버깅
| 속성 | 권장값 | 설명 | 참고 문서 |
|---|---|---|---|
format_sql | true | SQL 포맷팅 출력. 가독성 향상을 위해 줄바꿈/들여쓰기 적용 | Hibernate User Guide - Logging |
highlight_sql | true | SQL 하이라이트. 콘솔에서 키워드에 색상 부여 | Hibernate User Guide - Logging |
generate_statistics | true | 통계 수집 활성화. 슬로우 쿼리 감지에 필수! | Hibernate User Guide - Statistics |
3.3 슬로우 쿼리 설정 (Hibernate 6.6+)
| 속성 | 설명 | 참고 문서 |
|---|---|---|
hibernate.session.events.log.LOG_QUERIES_SLOWER_THAN_MS | 슬로우 쿼리 임계값(ms). 설정값 초과 시 로그 출력 | Hibernate JavaDoc - JdbcSettings |
3.4 기타 설정
| 속성 | 권장값 | 설명 | 참고 문서 |
|---|---|---|---|
jdbc.time_zone | Asia/Seoul | JDBC 타임존. DB와 애플리케이션 간 시간 동기화 | Hibernate User Guide - Time Zone |
globally_quoted_identifiers | true | 모든 식별자 인용 처리. SQL 예약어를 컬럼명으로 사용 가능 | Hibernate User Guide - Identifiers |
dialect | 자동감지 | DB 방언. Hibernate 6.x부터 자동 감지되므로 명시 불필요 | Hibernate User Guide - Dialect |
4. 로깅 설정
**# 로깅 설정
# 참고: https://docs.hibernate.org/orm/6.6/userguide/html_single/Hibernate_User_Guide.html#logging
logging:
  level:
    root: INFO                                # 루트 로거 레벨
    com.restApi.restApiSpringBootApp: DEBUG   # 애플리케이션 로그
    org.springframework: WARN                 # Spring Framework 로그
    org.springframework.web: DEBUG            # Spring MVC 웹 요청/응답 로그
    # Hibernate 로깅 설정
    org.hibernate.cfg: DEBUG                  # Hibernate 설정 로딩 로그
    org.hibernate.SQL: DEBUG                  # SQL 쿼리 실행 로그
    org.hibernate.SQL_SLOW: INFO              # 슬로우 쿼리 로그 (필수!)
    org.hibernate.stat: DEBUG                 # JPA/Hibernate 통계 로그 (쿼리 실행 횟수, 캐시 히트율 등)
    org.hibernate.orm.jdbc.bind: TRACE        # JDBC 파라미터 바인딩 값 로깅 (보안 주의)**
Hibernate 6.x에서는 로거 패키지명이 변경되었습니다.
| 로거 | 레벨 | 출력 내용 | 참고 문서 |
|---|---|---|---|
org.hibernate.SQL | DEBUG | 실행되는 SQL 쿼리 (포맷팅/하이라이트 적용) | Hibernate User Guide - Logging |
org.hibernate.orm.jdbc.bind | TRACE | PreparedStatement 파라미터 바인딩 값 | Hibernate User Guide - Logging |
org.hibernate.stat | DEBUG | 쿼리 통계 및 슬로우 쿼리 정보 (time: Xms) | Hibernate User Guide - Statistics |
org.hibernate.engine.internal.StatisticalLoggingSessionEventListener | OFF | Session Metrics 로그 비활성화 (너무 많이 출력됨) | - |
5. 주요 주의사항
위 옵션들을 사용 시 아래 사항들을 주의하며 사용해야한다.
-
SQL 중복 출력 방지
show-sql: true와org.hibernate.SQL: DEBUG를 동시에 사용하면 SQL이 두 번 출력하게 된다.따라서 둘 중 하나만 설정해서 쓰는 것을 권장한다.
설정 출력 형태 format_sql 적용 highlight_sql 적용 show-sql: true[Hibernate] select...❌ ❌ org.hibernate.SQL: DEBUGDEBUG org.hibernate.SQL - select...✅ ✅ -
Hibernate 6.x 변경사항
본인이 사용하는 Hibernate 버전에 따라 syntax 를 맞춰서 설정한다.
항목 Hibernate 5.x Hibernate 6.x Dialect 설정 명시 필요 자동 감지 (명시 시 경고) 슬로우 쿼리 로거 org.hibernate.SQL_SLOWorg.hibernate.stat바인딩 로거 org.hibernate.typeorg.hibernate.orm.jdbc.bind
슬로우쿼리 자동감지 & 알림 파이프라인
Hibernate의 hibernate.session.events.log.LOG_QUERIES_SLOWER_THAN_MS 옵션으로
슬로우 쿼리 로그를 남길 수 있지만, 로그만으로는 부족하다.
우리에게 필요한 건 즉각적인 알림과 체계적인 추적이다.
이에 따라 자동적으로 감지하고 이를 사내 개발팀에 알림을 보내는 파이프라인 구성이 필요하다.
방법은 두 가지가 있다.
- 센트리 SDK 사용
- Prometheus 와 그라파나 Alert Rule 사용
하나씩 살펴보도록 하자.
1. 센트리를 통해 슬로우쿼리 감지
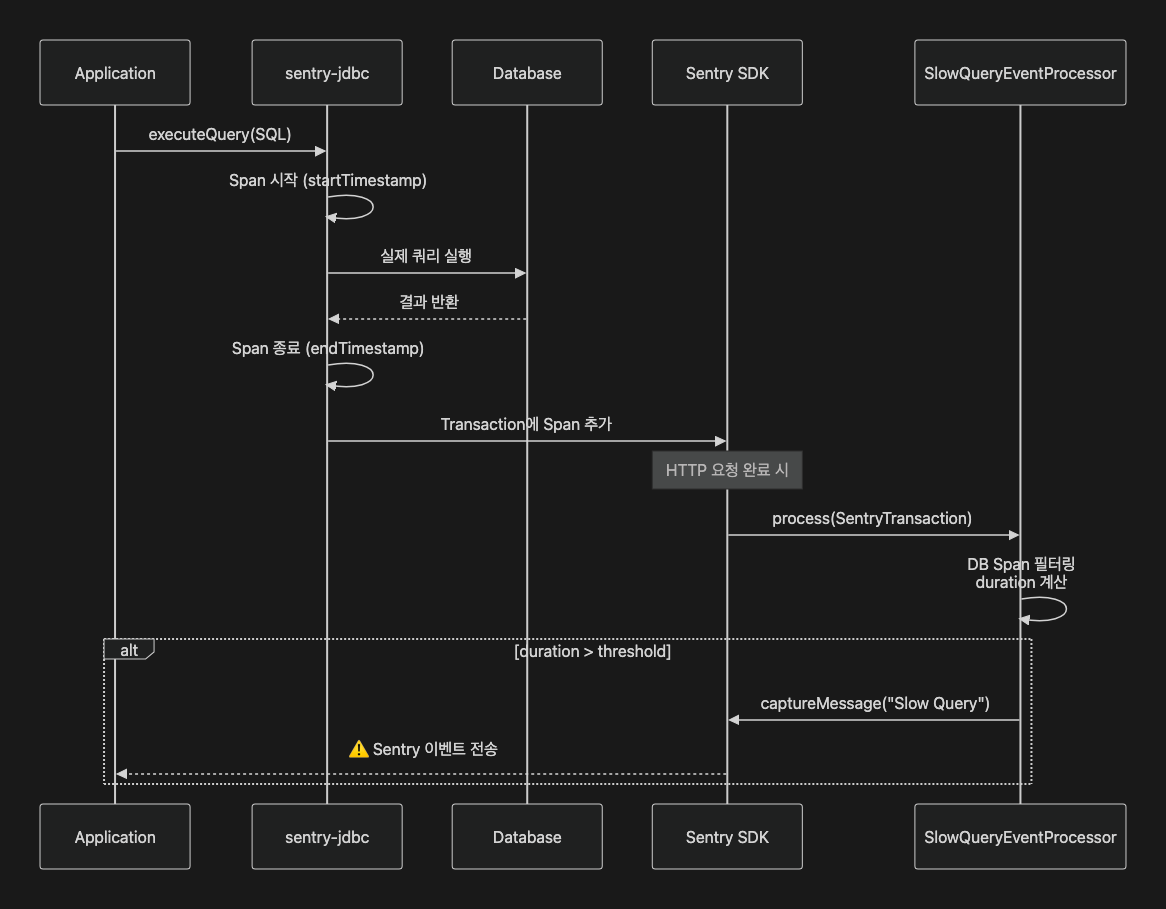
Sentry의 EventProcessor 에 대한 커스텀 구현체를 구현해서 모든 DB 쿼리를 검사하고,
임계값을 초과하면 자동으로 Sentry 이벤트를 생성하도록 한다.
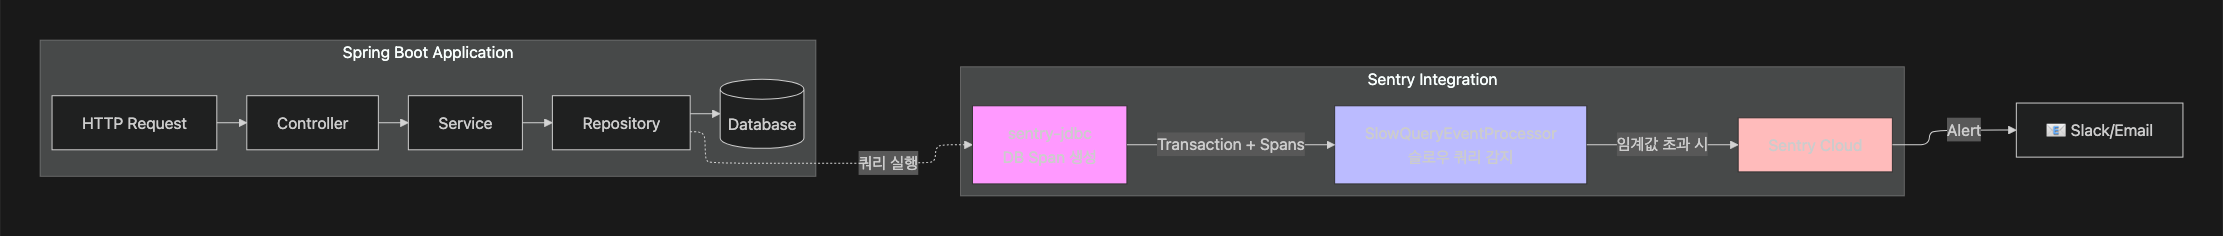
다만 여기서 선행조건이 있는데 바로 sentry-jdbc 없이는 이 솔루션이 작동하지 않는다는 것이다.
sentry-jdbc가 하는 일은 JDBC 레벨에서 모든 쿼리를 가로채서 Sentry Span으로 변환하는 것이다.
이 Span이 있어야 우리의 EventProcessor가 검사할 대상이 생긴다.
이제 원리와 과정을 살펴봤으니 어떻게 구성하는지를 살펴보자.
1) sentry-jdbc 의존성 추가
dependencies {
    implementation 'io.sentry:sentry-spring-boot-starter-jakarta:8.20.0'
    implementation 'io.sentry:sentry-jdbc:8.20.0'  // 필수!
}
2) application.yaml 설정
💡slow-query 에 대한 threshold 값을 monitoring.slow-query 을 바라보게끔 하였다.
이유인 즉슨 필자는 hibernate slow query 와 동일하게 관리되게끔 하고자
별도의 monitoring.slow-query 파일로 빼두었기 때문이다.
만약 그게 아니라면 그냥 100 와 같이 본인이 원하는 threshold 로 설정해주자.
sentry:
  dsn: ${SENTRY_DSN}
  environment: ${SPRING_PROFILES_ACTIVE}
  traces-sample-rate: 1.0
  slow-query:
    threshold-ms: ${monitoring.slow-query.threshold-ms:100}           # 슬로우 쿼리 임계값
    critical-threshold-ms: ${monitoring.slow-query.threshold-ms:100}  # 크리티컬 쿼리 임계값
3) DataSource 설정
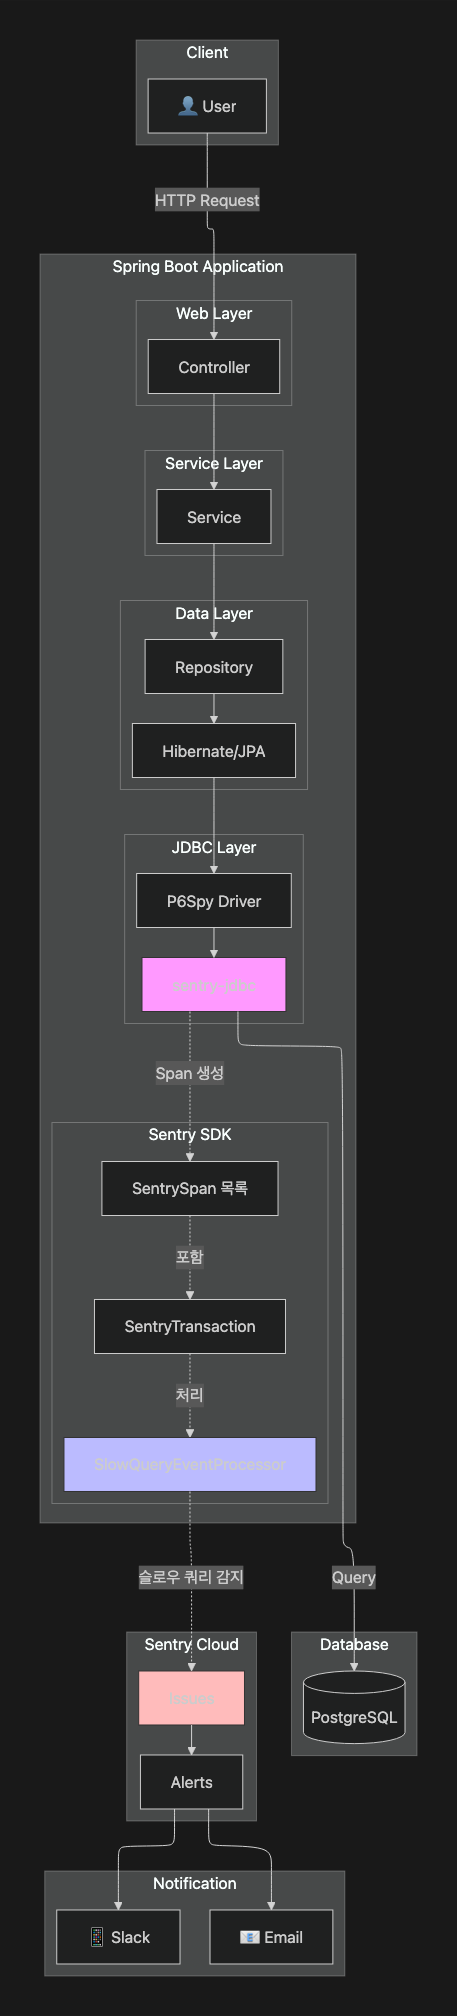
💡아래를 보다보면 엥 ? 굳이 p6spy 설정을 해줘야하는 이유가 뭐지 ? 싶을 것이다.
하지만 공식문서를 살펴보면 sentry-jdbc 에서 span 을 생성해내는 SentryJdbcEventListener 가 p6spy 인 것을 알 수 있다.
Sentry JDBC integration provides the SentryJdbcEventListener for P6Spy database activity interceptor, which creates a span for each JDBC statement executed over a proxied instance of javax.sql.DataSource.
고로 아쉽게도 p6spy 는 sentry 를 통해 슬로우쿼리 감지를 위한 필연조건이다
spring:
  datasource:
    url: jdbc:p6spy:postgresql://localhost:5432/mydb
    driver-class-name: com.p6spy.engine.spy.P6SpyDriver
4) EventProcessor 커스텀 구현체 구현
package com.cubalto.justreet.global.config.sentry;

import io.sentry.EventProcessor;
import io.sentry.Hint;
import io.sentry.Sentry;
import io.sentry.SentryEvent;
import io.sentry.SentryLevel;
import io.sentry.protocol.SentrySpan;
import io.sentry.protocol.SentryTransaction;
import jakarta.validation.constraints.NotNull;
import java.util.HashMap;
import java.util.Map;
import java.util.regex.Pattern;
import lombok.extern.slf4j.Slf4j;
import org.springframework.beans.factory.annotation.Value;
import org.springframework.stereotype.Component;

/**
 *
 * 느린 데이터베이스 쿼리를 감지하고 보고하기 위한 Sentry EventProcessor.
 * <p>
 * 이 프로세서는 데이터베이스 작업을 모니터링하고, 구성된 임계값을 초과하는 쿼리에 대해 별도의 Sentry 이벤트를 전송합니다.
 */
@Slf4j
@Component
public class SentrySlowQueryEventProcessor implements EventProcessor {

    // 정규표현식 사전 컴파일 (성능 최적화)
    private static final Pattern STRING_LITERAL_PATTERN = Pattern.compile("'[^']*'");
    private static final Pattern NUMBER_PATTERN = Pattern.compile("\\b\\d+\\b");
    private static final Pattern WHITESPACE_PATTERN = Pattern.compile("\\s+");

    @Value("${sentry.slow-query.threshold-ms:1000}")
    private long slowQueryThresholdMs;

    @Value("${sentry.slow-query.critical-threshold-ms:3000}")
    private long criticalQueryThresholdMs;

    @Override
    public @NotNull SentryEvent process(
        @NotNull SentryEvent event,
        @NotNull Hint hint
    ) {
        // SentryEvent는 현재 처리하지 않음
        return event;
    }

    @Override
    public @NotNull SentryTransaction process(
        @NotNull SentryTransaction transaction,
        @NotNull Hint hint
    ) {
        log.info("🔍 SentryTransaction received: {}, spans count: {}",
            transaction.getTransaction(),
            transaction.getSpans().size());

        for (SentrySpan span : transaction.getSpans()) {
            String op = span.getOp();

            if (op != null && op.startsWith("db")) {
                Double durationMs = calculateDurationMs(span);

                if (durationMs != null && durationMs > slowQueryThresholdMs) {
                    log.warn(
                        "Slow query detected: {}ms - {} (transaction: {})",
                        durationMs.longValue(),
                        truncateQuery(span.getDescription(), 100),
                        transaction.getTransaction()
                    );

                    captureSlowQueryEvent(span, durationMs, transaction);
                }
            }
        }

        return transaction;
    }

    /**
     * 슬로우 쿼리를 별도의 Sentry 이벤트로 캡처
     *
     * @param span        데이터베이스 span
     * @param durationMs  쿼리 실행 시간 (밀리초)
     * @param transaction 상위 트랜잭션
     */
    private void captureSlowQueryEvent(
        SentrySpan span,
        Double durationMs,
        SentryTransaction transaction
    ) {
        // 레벨 결정
        SentryLevel level = durationMs > criticalQueryThresholdMs
            ? SentryLevel.ERROR
            : SentryLevel.WARNING;

        Sentry.withScope(scope -> {
            // 레벨 설정
            scope.setLevel(level);

            // 태그 설정
            scope.setTag("query.operation", span.getOp());
            scope.setTag("query.duration_ms", String.valueOf(durationMs.longValue()));
            scope.setTag("transaction.name", transaction.getTransaction());

            // 컨텍스트 설정
            // Note: HashMap 생성은 Sentry의 scope 격리 특성상 필요함 (Thread-safety)
            Map<String, Object> queryContext = new HashMap<>();
            queryContext.put("query", span.getDescription());
            queryContext.put("duration_ms", durationMs);
            queryContext.put("threshold_ms", slowQueryThresholdMs);
            queryContext.put("critical_threshold_ms", criticalQueryThresholdMs);
            queryContext.put("span_id", span.getSpanId().toString());
            queryContext.put("trace_id", span.getTraceId().toString());
            scope.setContexts("slow_query", queryContext);

            // fingerprint 설정 (동일 쿼리 그룹화)
            scope.setFingerprint(java.util.Arrays.asList(
                "slow-query",
                normalizeQuery(span.getDescription())
            ));

            // 메시지 캡처 (레벨을 동적으로 설정)
            Sentry.captureMessage(
                String.format("Slow DB Query: %dms - %s",
                    durationMs.longValue(),
                    truncateQuery(span.getDescription(), 100)),
                level  // ✅ 수정: 동적 레벨 설정
            );
        });
    }

    /**
     * span의 실행 시간을 밀리초 단위로 계산
     *
     * @param span Sentry span
     * @return 실행 시간 (밀리초), 계산 불가능한 경우 null
     */
    private Double calculateDurationMs(SentrySpan span) {
        Double startTimestamp = span.getStartTimestamp();
        Double endTimestamp = span.getTimestamp();

        if (startTimestamp == null || endTimestamp == null) {
            return null;
        }
        return (endTimestamp - startTimestamp) * 1000;
    }

    /**
     * 쿼리 정규화 (fingerprint용)
     * <p>
     * 파라미터 값을 제거하여 동일 쿼리 패턴을 그룹화합니다. 정규표현식은 static으로 사전 컴파일되어 성능이 최적화됩니다.
     * </p>
     *
     * @param query 원본 SQL 쿼리
     * @return 정규화된 쿼리 문자열
     */
    private String normalizeQuery(String query) {
        if (query == null) {
            return "unknown";
        }

        // 사전 컴파일된 Pattern 사용 (성능 최적화)
        String normalized = STRING_LITERAL_PATTERN.matcher(query).replaceAll("?");
        normalized = NUMBER_PATTERN.matcher(normalized).replaceAll("?");
        normalized = WHITESPACE_PATTERN.matcher(normalized).replaceAll(" ");

        return normalized.trim();
    }

    /**
     * 쿼리 문자열을 지정된 길이로 자르기
     *
     * @param query     원본 쿼리
     * @param maxLength 최대 길이
     * @return 잘린 쿼리 문자열
     */
    private String truncateQuery(String query, int maxLength) {
        if (query == null) {
            return "N/A";
        }
        if (query.length() <= maxLength) {
            return query;
        }
        return query.substring(0, maxLength) + "...";
    }
}
-
두 가지 threshold 를 통해 슬로우 쿼리 이벤트를 발행한다.
-
우선 실행시간이 slowQueryThresholdMs 보다 느리면 슬로우 쿼리 이벤트를 발행한다.
-
이후 criticalQueryThresholdMs 에 비교하여 심각도에 따라 레벨을 나누어
처리되도록 두 가지로 구성해두었다.
if (durationMs != null && durationMs > slowQueryThresholdMs) {
    log.warn(
        "Slow query detected: {}ms - {} (transaction: {})",
        durationMs.longValue(),
        truncateQuery(span.getDescription(), 100),
        transaction.getTransaction()
    );

    captureSlowQueryEvent(span, durationMs, transaction);
}
// 레벨 결정 SentryLevel level = durationMs > criticalQueryThresholdMs ? SentryLevel.ERROR : SentryLevel.WARNING; -
-
정규화를 통해 슬로우 쿼리에 대한 캐싱을 해두었다.
- 같은 패턴이 100번 쌓이면 이벤트를 100번 처리하면 불편하다.
- 따라서 DB 쿼리 자체를 정규화하고 sentry 의 fingerprint 에 적재하여 동일 이벤트로 grouping 되어 무시되게끔 처리하였다.
    /**
     * 쿼리 정규화 (fingerprint용)
     * <p>
     * 파라미터 값을 제거하여 동일 쿼리 패턴을 그룹화합니다. 정규표현식은 static으로 사전 컴파일되어 성능이 최적화됩니다.
     * </p>
     *
     * @param query 원본 SQL 쿼리
     * @return 정규화된 쿼리 문자열
     */
    private String normalizeQuery(String query) {
        if (query == null) {
            return "unknown";
        }

        // 사전 컴파일된 Pattern 사용 (성능 최적화)
        String normalized = STRING_LITERAL_PATTERN.matcher(query).replaceAll("?");
        normalized = NUMBER_PATTERN.matcher(normalized).replaceAll("?");
        normalized = WHITESPACE_PATTERN.matcher(normalized).replaceAll(" ");

        return normalized.trim();
    }
이를 실제로 테스트해보았을 때 아래와 같이 로그와 센트리 대시보드가 찍히는 것을 볼 수 있었다.
  .   ____          _            __ _ _
 /\\ / ___'_ __ _ _(_)_ __  __ _ \ \ \ \
( ( )\___ | '_ | '_| | '_ \/ _` | \ \ \ \
 \\/  ___)| |_)| | | | | || (_| |  ) ) ) )
  '  |____| .__|_| |_|_| |_\__, | / / / /
 =========|_|==============|___/=/_/_/_/

 :: Spring Boot ::                (v3.4.5)

2025-11-28T08:01:37.443+09:00  INFO 75372 --- [justreet] [           main] c.cubalto.justreet.JustreetApplication   : Starting JustreetApplication using Java 17.0.12 with PID 75372 (/Users/limjihoon/dev/justreet-java-api/out/production/classes started by limjihoon in /Users/limjihoon/dev/justreet-java-api)

,,,

    select
        ae1_0."ad_idx",
        ae1_0."ad_id",
        ae1_0."ad_password",
        ae1_0."created_at",
        ae1_0."updated_at"
    from
        "hama_admin" ae1_0
    where
        ae1_0."ad_idx"=?
2025-11-28T08:01:54.580+09:00 TRACE 75372 --- [justreet] [nio-8080-exec-1] org.hibernate.orm.jdbc.bind              : binding parameter (1:BIGINT) <- [1]
2025-11-28T08:01:54.629+09:00  INFO 75372 --- [justreet] [nio-8080-exec-1] org.hibernate.SQL_SLOW                   : Slow query took 48 milliseconds [select ae1_0."ad_idx",ae1_0."ad_id",ae1_0."ad_password",ae1_0."created_at",ae1_0."updated_at" from "hama_admin" ae1_0 where ae1_0."ad_idx"=?]
2025-11-28T08:01:54.690+09:00 DEBUG 75372 --- [justreet] [nio-8080-exec-1] m.m.a.RequestResponseBodyMethodProcessor : Using 'application/json', given [*/*] and supported [application/json, application/*+json, application/yaml]
2025-11-28T08:01:54.695+09:00 DEBUG 75372 --- [justreet] [nio-8080-exec-1] m.m.a.RequestResponseBodyMethodProcessor : Writing [SuccessResponse(success=true, code=1, message=성공하였습니다., result=ListResult(page=null, list=[ContentOn (truncated)...]
2025-11-28T08:01:54.714+09:00 DEBUG 75372 --- [justreet] [nio-8080-exec-1] o.s.web.servlet.DispatcherServlet        : Completed 200 OK
2025-11-28T08:01:54.720+09:00  INFO 75372 --- [justreet] [nio-8080-exec-1] .c.j.g.c.s.SentrySlowQueryEventProcessor : 🔍 SentryTransaction received: GET /api/v1/content/maps, spans count: 2
2025-11-28T08:01:54.720+09:00  WARN 75372 --- [justreet] [nio-8080-exec-1] .c.j.g.c.s.SentrySlowQueryEventProcessor : Slow query detected: 93ms - select ce1_0."co_idx",ce1_0."ad_idx",ce1_0."co_approval_status",ce1_0."co_balance_empty",ce1_0."co_d... (transaction: GET /api/v1/content/maps)
2025-11-28T08:01:54.726+09:00  WARN 75372 --- [justreet] [nio-8080-exec-1] .c.j.g.c.s.SentrySlowQueryEventProcessor : Slow query detected: 48ms - select ae1_0."ad_idx",ae1_0."ad_id",ae1_0."ad_password",ae1_0."created_at",ae1_0."updated_at" from "... (transaction: GET /api/v1/content/maps)
2025-11-28T08:03:50.098+09:00  INFO 75372 --- [justreet] [ionShutdownHook] com.zaxxer.hikari.HikariDataSource       : HikariPool-1 - Shutdown initiated...
2025-11-28T08:03:50.488+09:00  INFO 75372 --- [justreet] [ionShutdownHook] com.zaxxer.hikari.HikariDataSource       : HikariPool-1 - Shutdown completed.
2. 그라파나를 통해 슬로우쿼리 감지
sentry 를 통한 로깅은 너무 sentry centric 이다.
우리는 아예 raw level 로 DB 에 직접 접근하여 DB 데이터 정보를 긁어오는 친구가 필요하다.
이를 처리하려면 모니터링 툴을 사용할 수 있을 것이다.
해당 부분은 Hibernate/Sentry 기반한 본 포스트의 취치에서 벗어나므로
방법만 짧고 굵게 설명하고 넘기겠다.
-
mysql exporter 사용하기
prometheus exporter 를 통해 mysql 에 직접 접근하여 데이터들을 긁어오고
실행되는 쿼리들과 쿼리 수행시간을 감시하고, 그 중에 threshold 보다 높은 녀석들에 대해서
grafana alert rule 을 선언하여 사내에 알림이 오게끔 하는 방법이 있다.
다만 이렇게 구성하려면 mysql 에서 slow_query_log 값을 활성화해주어야 한다.
-
loki 에 대한 쿼리 처리
loki 사용 시 로그와 수행시간이 남게된다. 이에 대해 LogQL 를 사용하여 해당 부분에 대한 alert rule 을 생성할 수 있다.
# 1초 이상 걸린 쿼리 필터링
{app="postgresql"}
  | pattern `<_> LOG:  duration: <duration> ms  statement: <query>`
  | duration > 1000

# JSON 포맷 로그인 경우
{app="api-server"}
  | json
  | duration_ms > 1000
  | line_format "{{.query}} took {{.duration_ms}}ms"
Reference
Hibernate
- https://docs.hibernate.org/orm/6.6/userguide/html_single/
- https://docs.hibernate.org/orm/6.6/javadocs/
- https://docs.hibernate.org/orm/6.6/javadocs/org/hibernate/cfg/JdbcSettings.html#LOG_SLOW_QUERY:~:text=false-,LOG_SLOW_QUERY,-static%20final%C2%A0
- https://github.com/brettwooldridge/HikariCP#gear-configuration-knobs-baby
- https://medium.com/@AlexanderObregon/slow-query-detection-in-spring-boot-with-jpa-logging-ef6e51667d6a
Sentry