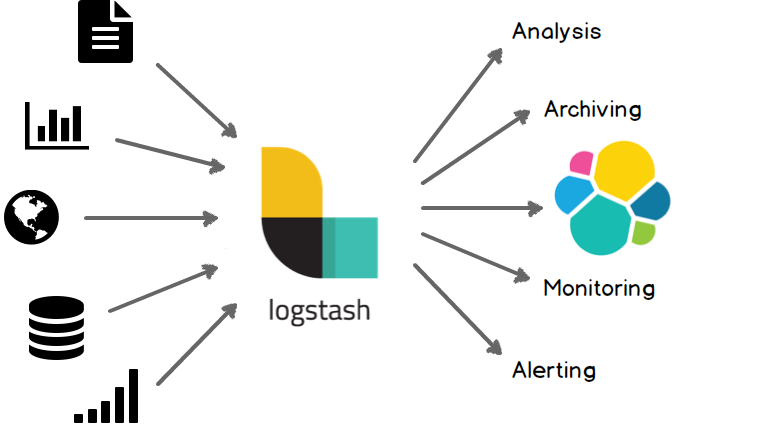
🧺 LogStash란?
- 플러그인 기반의 오픈소스 데이터 처리가 가능한 파이프라인 도구
- 데이터 전처리 과정을 별도의 어플리케이션 없이 간단한 설정만으로 수행이 가능함
- 장애 대응 로직 또는 성능 저하 요인등을 쉽게 파악할 수 있는 모니터링 API 제공
 *출처 : https://www.elastic.co/guide/kr/logstash/current/introduction.html
〰️ Pipeline
- 로그 스태시의 핵심 기능
- 로그 스태시 실행하기 위해 반드시 파이프라인 설정이 필요함
- 데이터를 입력받은 후에 실시간으로 변경하고 이를 다른 시스템에 전달
- input, filter, output 세가지 구성요소로 이루어짐
input { {input plugin} } filter { {filter plugin} } output { {output plugin} }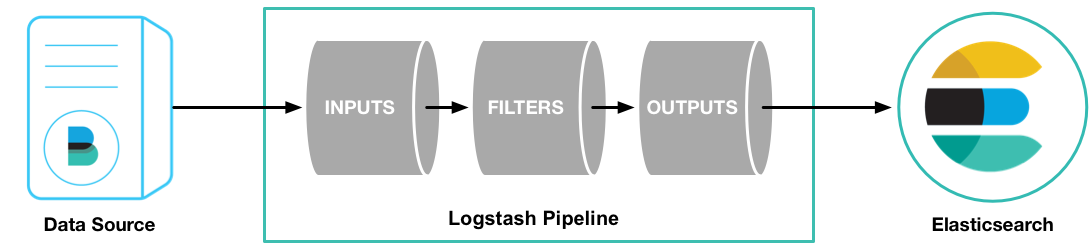 *출처 : https://www.elastic.co/guide/kr/logstash/current/first-event.html
🎅 Logstash 설치방법
-
pipeline 세팅
input { stdin { } } output { elasticsearch { cloud_id => "<cloud id>" api_key => "<api key>" } stdout { codec => rubydebug } } -
logstash 실행
bin/logstash -f pipeline.conf
☝️ Input Plugin
| 플러그인 | 설명 | 예시 |
|---|---|---|
| file | 파일을 스트리밍하여 이벤트를 읽음 | input { file {id =>"my_plugin_id"}} |
| syslog | 시스템로그 메세지를 이벤트로 읽음 | input { syslog { port => 12345 codec => cefsyslog_field => "syslog" grok_pattern => "<%{POSINT:priority}>%{SYSLOGTIMESTAMP:timestamp} CUSTOM GROK HERE"} } |
| kafka | 카프카 토픽을 읽음 | input {kafka { sasl_jaas_config => "org.apache.kafka.common.security.plain.PlainLoginModule required username='auser' password='apassword';" }} |
| … | … | ... |
☝️ Filter Plugin
| 플러그인 | 설명 | 예시 |
|---|---|---|
| grok | grok 패턴을 사용하여 메세지를 분석 | filter { grok { match => { "message" =>"%{TIMESTAMP_ISO8601:timestamp} %{LOGLEVEL:log-level} [%{DATA:class}]:%{GREEDYDATA:message}" } } } |
| mutate | 다양한 필드를 변형하여 로그 메세지를 변형할 수 있음 | filter { grok {...} mutate { lowercase => [ "log-level" ] } } |
| … | … | ... |
☝️Output Plugin
| 플러그인 | 설명 | 예시 |
|---|---|---|
| elasticsearch | bulk API로 엘라스틱서치에 인덱싱 | output { elasticsearch { hosts => "hostname" data_stream => "true" } } |
| file | 지정한 파일에 데이터를 기록 | output { file { path => ... codec => line { format => "custom format: %{message}"} } } |
| kafka | 카프카 토픽에 데이터를 기록 | output { kafka { codec => json topic_id => "mytopic" }} |

발새발개