이번 글은
- 앞선 [2022 공간빅데이터 경진대회] 3. 데이터 확보 및 DB 구축의 소스 데이터 중 침수예상도 데이터를 업로드
- 코드 파일 첨부(github)
데이터 확인(in QGIS)
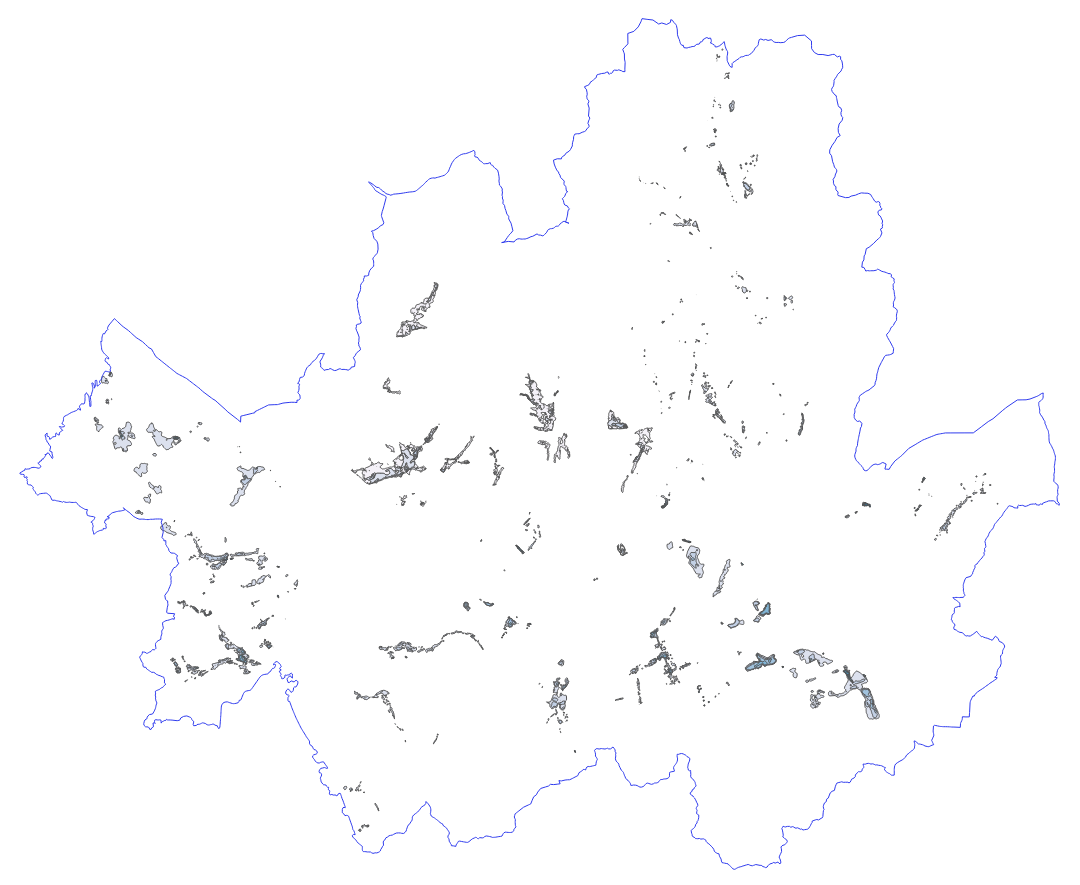
서울 전역에 대한 침수지역 폴리곤 데이터
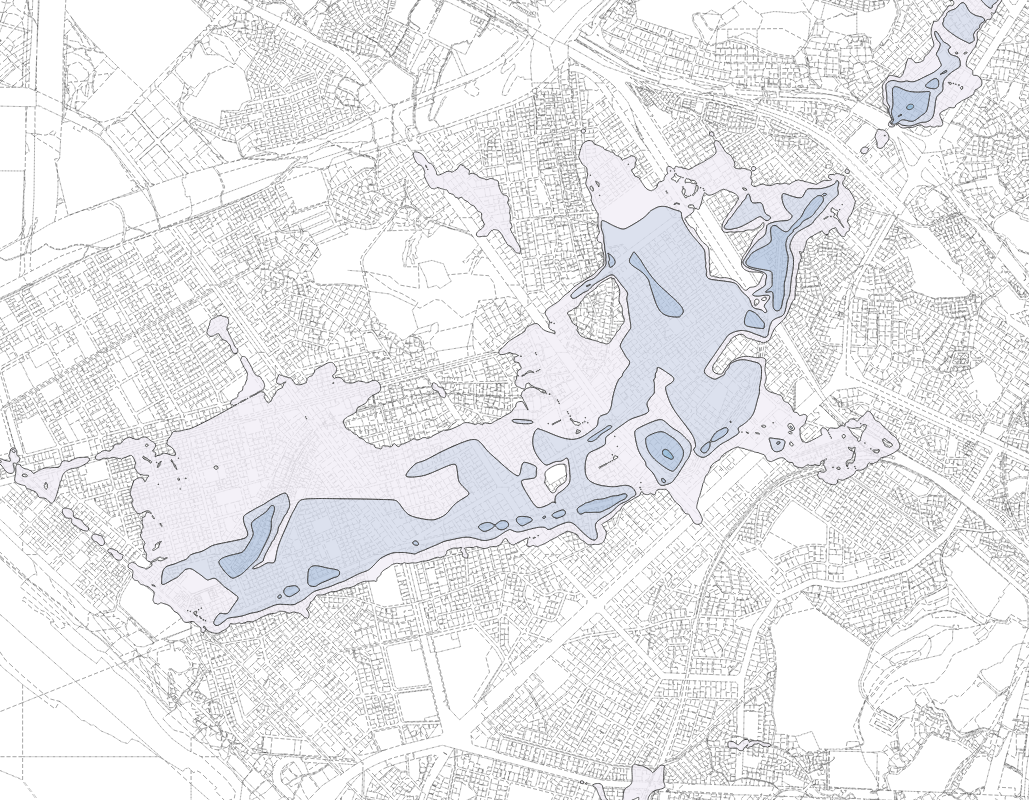
수위별 침수예상지역 - 망원역(6호선)~홍대입구역(2호선)
데이터 읽기
import geopandas as gpd

ef_zone = gpd.read_file( # ef_zone : expected flooding zone
  'D:/2022 공간빅데이터 경진대회/서울시 풍수해 침수예상도/DS_FLOODING.zip!DS_FLOODING.shp'
)
ef_zone
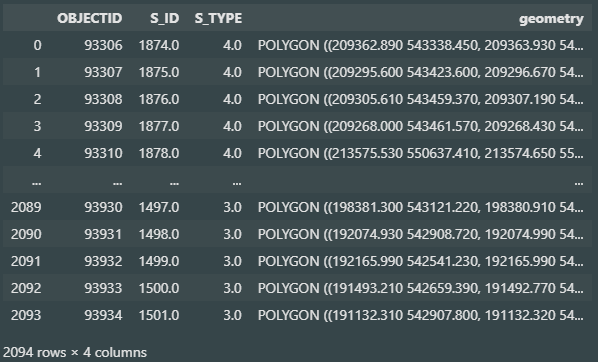
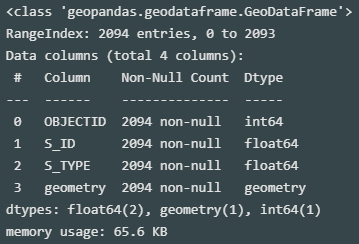
ef_zone.info()
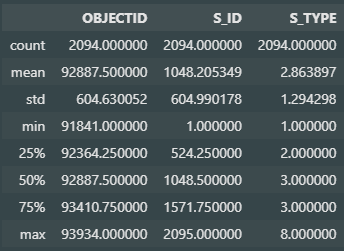
ef_zone.describe()
S_ID, S_TYPE의 형변환(float -> int -> string)
ef_zone['S_ID'] = ef_zone.S_ID.astype('int').astype('string')
ef_zone['S_TYPE'] = ef_zone.S_TYPE.astype('int').astype('string')
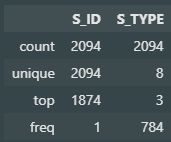
ef_zone.describe(include='string')
- S_ID는 중복없음
- S_TYPE의 범위는 1~8
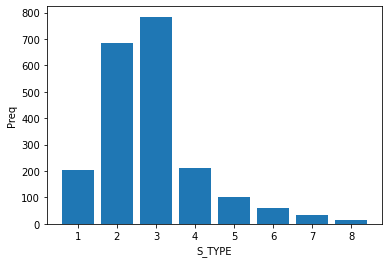
import matplotlib.pyplot as plt

s_type_counts = ef_zone.S_TYPE.value_counts().sort_index()
plt.bar(
  s_type_counts.index,
  s_type_counts.values
)
plt.xlabel('S_TYPE')
plt.ylabel('Preq')
plt.show()
- S_TYPE은 3과 2이 압도적으로 많음
S_TYPE 값에 대한 침수량 항목 입력하기
(단위 mm) 0.2 미만 / 0.2~0.5 / 0.5~1.0 / 1.0~1.5 / 1.5~2.0 / 2.0~2.5 / 2.5~3.0 / 3.0 이상
import pandas as pd

zone_level_description = pd.DataFrame(
  {
    'S_TYPE':['1','2','3','4','5','6','7','8'],
    'level_description':[
      '0.2mm 미만',
      '0.2mm 이상 0.5mm 미만',
      '0.5mm 이상 1.0mm 미만',
      '1.0mm 이상 1.5mm 미만',
      '1.5mm 이상 2.0mm 미만',
      '2.0mm 이상 2.5mm 미만',
      '2.5mm 이상 3.0mm 미만',
      '3.0mm 이상'
    ]
  }
)
ef_zone = ef_zone.merge(
  zone_level_description,
  how = 'left',
  on = 'S_TYPE'
)
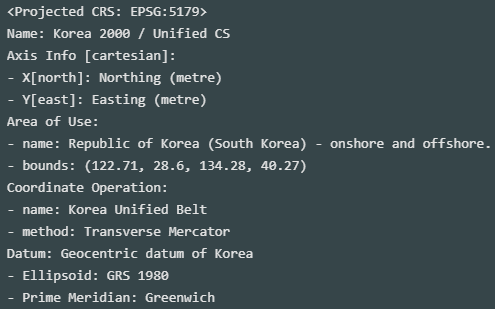
좌표계 변환 (to EPSG:5179)
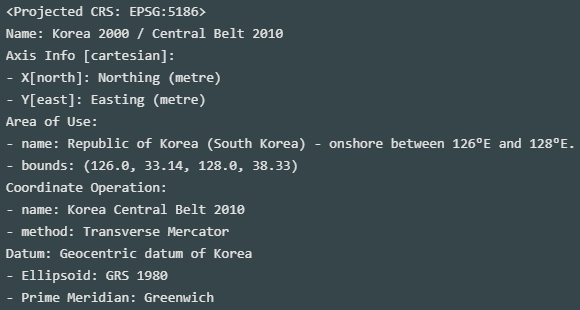
ef_zone.crs
- 좌표계 초기값 없음
- 소스 좌표계는 EPSG:5186 (출처 사이트 내 기재됨)
ef_zone = ef_zone.set_crs(5186)
ef_zone.crs
ef_zone = ef_zone.to_crs(5179)
ef_zone.crs
테이블 컬럼 설정
- id : S_ID
- level : S_TYPE
- level_description : level_description
- geometry : geometry
ef_zone = ef_zone[['S_ID', 'S_TYPE', 'level_description', 'geometry']]
ef_zone.columns = ['zone_id', 'level', 'level_description', 'geometry']
테이블 스키마 설정
create table dem_point (
  id int,
  value numeric,
  geometry public.geometry(geometry, 5179),
  uploaded_at timestamp default current_timestamp
);
create index index_dem_point_on_geometry on dem_point (geometry);
DB 연결
import psycopg2
from sqlalchemy import create_engine

conn = psycopg2.connect(
  'host=localhost port=5432 dbname=postgres user=postgres password=postgres',
  options='-c search_path=sbd'
)
conn.set_session(autocommit=True)
cur = conn.cursor()
gconn = create_engine(
  'postgresql://postgres:postgres@localhost:5432/postgres'
)
테이블 생성
cur.execute(
  f'''
  select count(*)
  from information_schema.tables
  where
    table_schema = 'sbd' and
    table_name ~ 'expected_flooding_zone'
  '''
)
if not cur.fetchone()[0]:
  cur.execute(
    open('./sql/sbd-create_table_expected_flooding_zone.sql', 'r').read()
  )
데이터 업로드
cur.execute(
  'delete from expected_flooding_zone'
)
ef_zone.to_postgis(
  'expected_flooding_zone',
  gconn,
  schema='sbd',
  if_exists='append'
)

가치를 만드는 데이터 분석가