데이터 불러오기
df_seoul = pd.read_excel('data/seoul.xlsx', sheet_name='Sheet1')
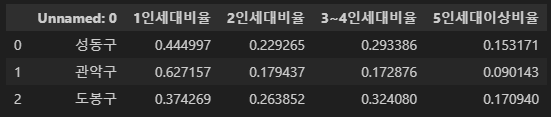
df_seoul.head(3)
print(df_seoul.iloc[0,0])
print(df_seoul.iloc[1,1])
print(df_seoul.iloc[0:2,0])
df_seoul = pd.read_excel('data/seoul.xlsx',sheet_name='Sheet1', index_col = 0)
df_seoul.head(3)
print(df_seoul.loc['성동구','1인세대비율'])
print(df_seoul.loc['성동구',['1인세대비율','2인세대비율']])

filtered_df = df_seoul[df_seoul['1인세대비율'] >= 0.5]
filtered_df
lambda식
def get_square(n):
    return n ** 2
print(get_square(3))

lambda_square = lambda x : x ** 2
print(lambda_square(3))
df['화재크기분류'] = df['재산피해소계'].apply(lambda x : '소형' if x <= 1000 else '대형')
df.head(1)
def classify_fire(row):
if row['재산피해소계'] < 500:
return '소형'
elif row['재산피해소계'] < 10000:
return '중형'
else:
return '대형'
df['화재크기분류'] = df.apply(classify_fire, axis=1)
df.head(2)
cond1 = df['재산피해소계'] >= 500
cond2 = df['재산피해소계'] < 10000
filtered_df = df[cond1 & cond2]
filtered_df['화재크기분류'].value_counts()

new_df = df.drop('연번',axis=1)
new_df.head(2)
df.drop(0, axis=0)
df.head(2)
df.drop('연번', axis=1, inplace=True)
df_titanic= pd.read_csv('data/titanic.csv')
df_titanic.head(2)
df_titanic.isna().head(3)
df_titanic.info()
df['재산피해소계'].sum()
df.groupby('시도')['재산피해소계'].sum()
- 2018, 2019년의 화재 데이터를 각각 로드
df_2018 = pd.read_csv('data/2018년화재.csv', encoding='cp949')
df_2019 = pd.read_csv('data/2019년화재.csv', encoding='cp949')
print('2018 shape: {}'.format(df_2018.shape))
print('2019 shape: {}'.format(df_2019.shape))
df_total['화재발생년월일'] = pd.to_datetime(df_total['화재발생년월일'])
df_total['화재발생연도'] = df_total['화재발생년월일'].dt.year
df_total.head(2)
df_sales = pd.read_excel('data/adw.xlsx', sheet_name='인터넷판매')
df_customer = pd.read_excel('data/adw.xlsx', sheet_name='고객')

print('df_sales: {}'.format(df_sales.shape))
print('df_customer: {}'.format(df_customer.shape))
df_adw = pd.merge(df_sales, df_customer, on="고객키", how='inner')
df_adw.shape
import matplotlib.pyplot as plt
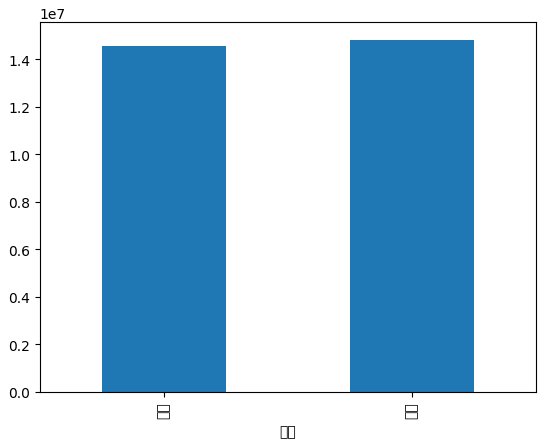
result = df_adw.groupby('성별')['판매금액'].sum()
result.plot(kind='bar')
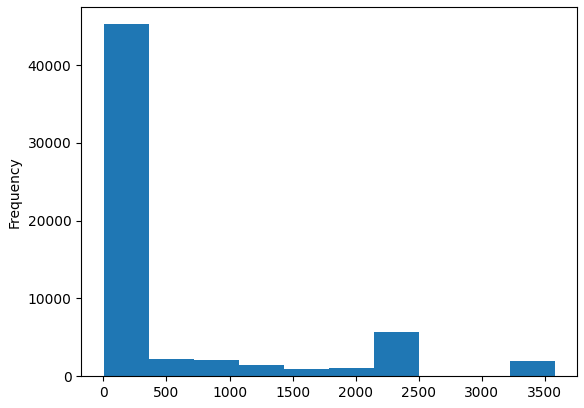
df_adw['판매금액'].plot(kind='hist')
iris
import pandas as pd
from sklearn.tree import DecisionTreeClassifier
iris = pd.read_csv('data/iris.csv')
x = iris.drop('variety',axis=1)
y = iris['variety']
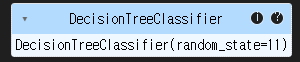
clf = DecisionTreeClassifier(random_state=11)
clf.fit(x,y)
pred = clf.predict(x)
pred