내용출처 : 이수안컴퓨터연구소 Youtube
Setting
import cv2
import numpy as np
import matplotlib.pyplot as plt
import urllib
import requests
from io import BytesIO
1. util functions
- 자주쓰는 기능 함수로 정의
def url_to_image(url, gray=False):
  resp = urllib.request.urlopen(url)
  image = np.asarray(bytearray(resp.read()), dtype="uint8")

  if gray == True:
    image = cv2.imdecode(image, cv2.IMREAD_GRAYSCALE)
  else:
    image = cv2.imdecode(image, cv2.IMREAD_COLOR)
    image = cv2.cvtColor(image, cv2.COLOR_BGR2RGB)

  return image

def filtered_image(image, filter, output_size):
  filtered_img = np.zeros((output_size, output_size))
  filter_size = filter.shape[0]

  for i in range(output_size):
    for j in range(output_size):
      multiply_values = image[i:(i + filter_size), j:(j+filter_size)] * filter
      sum_value = np.sum(multiply_values)

      if (sum_value > 255):
        sum_value = 255

      filtered_img[i, j] = sum_value

  return filtered_img
2. 이미지 확인
- 예시이므로 정사각형 사이즈로 진행
img_url = "https://upload.wikimedia.org/wikipedia/ko/thumb/2/24/Lenna.png/440px-Lenna.png"

image = url_to_image(img_url, gray=True)
print("image.shape:", image.shape)

plt.imshow(image, cmap='gray')
plt.show()
image.shape: (440, 440)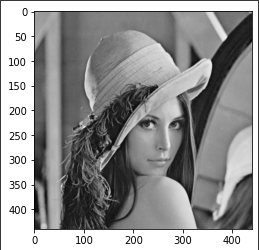
S
3. 필터연산 적용
vertical_filter = np.array([[1., 2., 1.],
                            [0., 0., 0.],
                            [-1., -2., -1.]])

horizontal_filter = np.array([[1., 2., -1.],
                              [2. ,0., -2.],
                              [-1.,0. ,-1.]])

output_size = int((image.shape[0] - 3) / 1 + 1)
print("output size:", output_size)

vertical_filtered = filtered_image(image, vertical_filter, output_size)
horizontal_filtered = filtered_image(image, horizontal_filter, output_size)

plt.figure(figsize=(10,10))
plt.subplot(1, 2, 1)
plt.title("Vertical")
plt.imshow(vertical_filtered, cmap='gray')

plt.subplot(1, 2, 2)
plt.title("Horizontal")
plt.imshow(vertical_filtered, cmap='gray')
plt.show()
output size: 438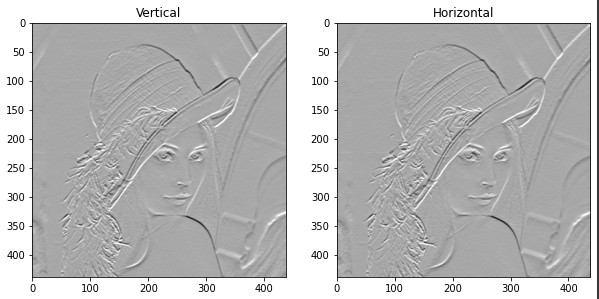
이미지 필터를 적용한 최종 결과
sobel_img = np.sqrt(np.square(horizontal_filtered) + np.square(vertical_filtered))

plt.imshow(sobel_img, cmap='gray')<matplotlib.image.AxesImage at 0x7fd891f3f850>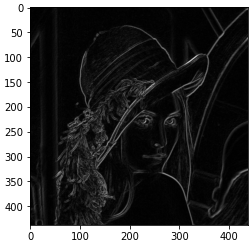
4. 3차원 데이터의 합성곱 연산
- 이미지는 3차원으로 구성
- 가로, 세로 채널 수
- 채널 : RGB (색상값 정도에 따라 color 결정)
img_url = "https://upload.wikimedia.org/wikipedia/ko/thumb/2/24/Lenna.png/440px-Lenna.png"

image = url_to_image(img_url)
print("image.shape:", image.shape)

plt.imshow(image)
plt.show()
image.shape: (440, 440, 3)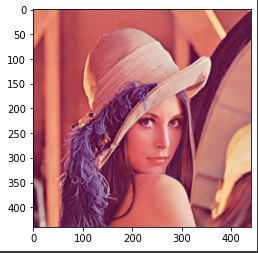
image_copy = image.copy()
image_copy[:,:,1] = 0  # 2차원(G) 그린채널 모두 0
image_copy[:,:,2] = 0  # 3차원(B) 블루채널 모두 0
image_red = image_copy # 레드만 남은 상황print(image_red)[[[226 0 0]
[225 0 0]
[222 0 0]
...
[233 0 0]
[224 0 0]
[202 0 0]]
[[226 0 0]
[225 0 0]
[222 0 0]
...
[233 0 0]
[224 0 0]
[202 0 0]]
[[226 0 0]
[225 0 0]
[222 0 0]
...
[232 0 0]
[223 0 0]
[201 0 0]]
...
[[ 84 0 0]
[ 86 0 0]
[ 93 0 0]
...
[174 0 0]
[169 0 0]
[172 0 0]]
[[ 82 0 0]
[ 86 0 0]
[ 95 0 0]
...
[177 0 0]
[178 0 0]
[183 0 0]]
[[ 81 0 0]
[ 86 0 0]
[ 96 0 0]
...
[178 0 0]
[181 0 0]
[185 0 0]]]image_copy = image.copy()
image_copy[:,:,0] = 0 # 1차원(R) 레드채널 모두 0
image_copy[:,:,2] = 0 # 3차원(B) 블루채널 모두 0
image_green = image_copy # 그린만 남은 상황image_copy = image.copy()
image_copy[:,:,0] = 0 # 1차원(R) 레드채널 모두 0
image_copy[:,:,1] = 0 # 2차원(B) 블루채널 모두 0
image_blue = image_copy # 블루만 남은 상황fig = plt.figure(figsize=(12,8))
title_list = ['R', 'G', 'B',
'R - grayscale', 'G - grayscale', 'B - grayscale']
image_list = [image_red, image_green, image_blue,
image_red[:,:,0], image_green[:,:,1], image_blue[:,:,2]]
for i, image in enumerate(image_list):
ax = fig.add_subplot(2, 3, i+1)
ax.title.set_text("{}".format(title_list[i]))
if i >=3:
plt.imshow(image, cmap='gray')
else:
plt.imshow(image)
plt.show()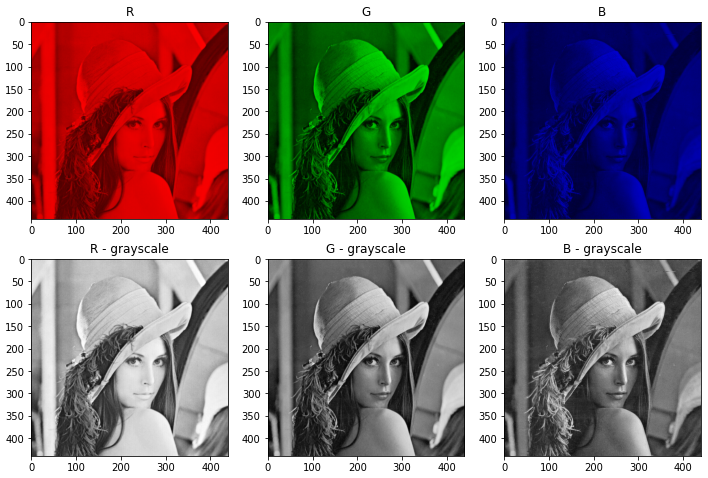

나무를 심는 사람