- 목표 함수
import matplotlib.pyplot as plt
import numpy as np
%matplotlib inline


def plotSinWave(amp, freq, endTime, sampleTime, startTime, bias):


	# 이 부분은 함수에 대한 설명을 고정하는 것 (다른 사람들도 쉽게 이해할 수 있도록 함)

    """
    plot sine wave
    y = a sin(2 pi f t + t_0) + b
    """


    time = np.arange(startTime, endTime, sampleTime)
    result = amp * np.sin(2 * np.pi * freq * time + startTime) + bias


    plt.figure(figsize=(12, 6))
    plt.plot(time, result)
    plt.grid(True)
    plt.xlabel("time")
    plt.ylabel("sin")
    plt.title(str(amp) + "*sin(2*pi" + str(freq) + "*t+" + str(startTime) + ")+" + str(bias))
    plt.show()


plotSinWave(2, 1, 10, 0.01, 0.5, 0)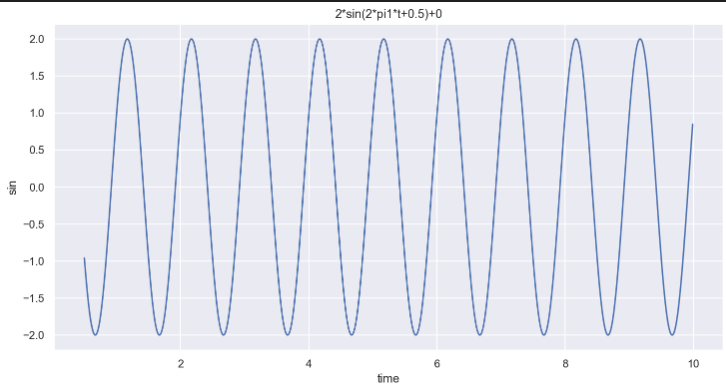
좀 더 편하게 고쳐보자 !
# 변수를 **kwargs 으로 설정
# 만약 변수가 따로 주어지지 않을 경우, 디폴트값 사용


def plotSinWave(**kwargs):


    """
    plot sine wave
    y = a sin(2 pi f t + t_0) + b
    """


    endTime = kwargs.get("endTime", 1)
    sampleTime = kwargs.get("sampleTime", 0.01)
    amp = kwargs.get("amp", 1)
    freq = kwargs.get("freq", 1)
    startTime = kwargs.get("startTime", 0)
    bias = kwargs.get("bias", 0)
    figsize = kwargs.get("figsize", (12, 6))


    time = np.arange(startTime, endTime, sampleTime)
    result = amp * np.sin(2 * np.pi * freq * time + startTime) + bias

    plt.figure(figsize=(12, 6))
    plt.plot(time, result)
    plt.grid(True)
    plt.xlabel("time")
    plt.ylabel("sin")
    plt.title(str(amp) + "*sin(2*pi" + str(freq) + "*t+" + str(startTime) + ")+" + str(bias))
    plt.show()


plotSinWave()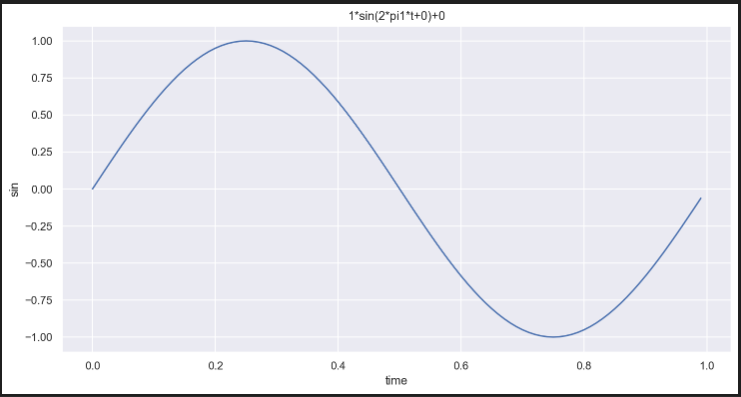
이전에는 amp, freq, endTime, sampleTime, startTime, bias에 해당하는 값을 모두 입력해야 했는데,
이제는 그럴 필요가 없다 ! 필요한 값만 설정해보자
plotSinWave(amp=2, freq=0.5, endTime=10)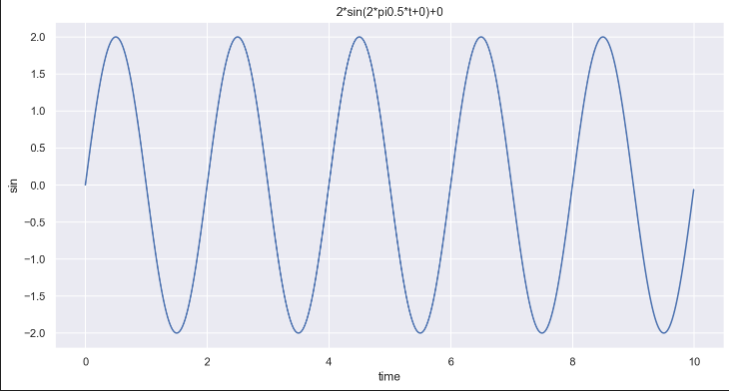
-
직접 만든 함수 import
-
"drawSinWave.py"
# drawSinWave.py

%%writefile ./drawSinWave.py

import numpy as np
import matplotlib.pyplot as plt

def plotSinWave(**kwargs):
    """
    plot sine wave
    y = a sin(2 pi f t + t_0) + b
    """
    endTime = kwargs.get("endTime", 1)
    sampleTime = kwargs.get("sampleTime", 0.01)
    amp = kwargs.get("amp", 1)
    freq = kwargs.get("freq", 1)
    startTime = kwargs.get("startTime", 0)
    bias = kwargs.get("bias", 0)
    figsize = kwargs.get("figsize", (12, 6))

    time = np.arange(startTime, endTime, sampleTime)
    result = amp * np.sin(2 * np.pi * freq * time + startTime) + bias

    plt.figure(figsize=(12, 6))
    plt.plot(time, result)
    plt.grid(True)
    plt.xlabel("time")
    plt.ylabel("sin")
    plt.title(str(amp) + "*sin(2*pi" + str(freq) + "*t+" + str(startTime) + ")+" + str(bias))
    plt.show()

if __name__ == "__main__":
    print("hello world~!!")
    print("this is test graph!!")
    plotSinWave(amp=1, endTime=2)
import drawSinWave as dS
dS.plotSinWave()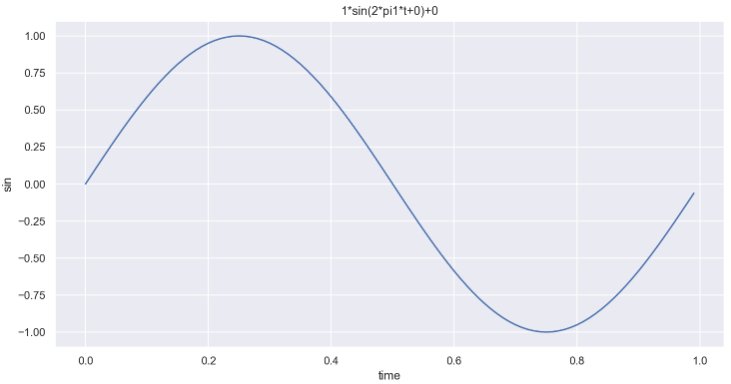
dS.plotSinWave(freq=5)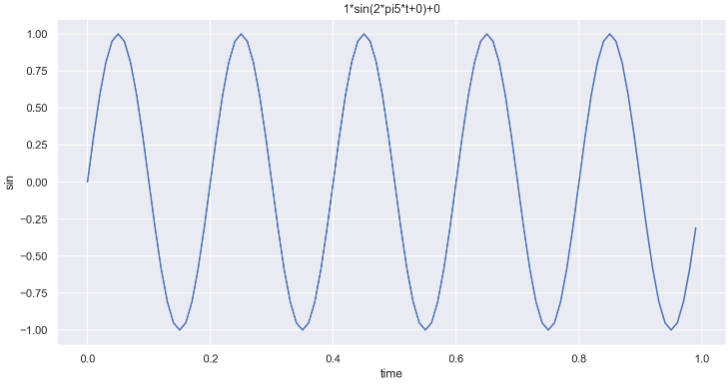
- 그래프 한글 설정 함수도 만들어보자 !
%%writefile ./set_matplotlib_hangul.py

import platform
import matplotlib.pyplot as plt
from matplotlib import font_manager, rc

path = "c:/Windows/Fonts/malgun.ttf"

if platform.system() == "Darwin":
    print("Hangul OK in your MAC!!!")
    rc("font", family="Arial Unicode MS")
elif platform.system() == "Windows":
    font_name = font_manager.FontProperties(fname=path).get_name()
    print("Hangul OK in your Windows!!!")
    rc("font", family=font_name)
else:
    print("Unknown system.. sorry~~~")

plt.rcParams["axes.unicode_minus"] = False
import set_matplotlib_hangul
plt.title("한글")

데이터 관련 학습 일지