1) Streamlit 한 줄 요약과 시작하기
-
웹 지식 없이 데이터 앱/대시보드를 손쉽게 만들 수 있음 .
-
pip install streamlit→streamlit run app.py로 바로 실행 . -
.py파일만 있으면 로컬에서 곧바로 웹 UI 확인 가능.
2) 텍스트·표 컴포넌트 핵심
-
제목/헤더/서브헤더/코드블록/마크다운/텍스트로 정보 구조화.
-
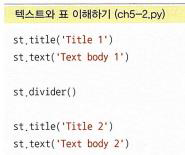
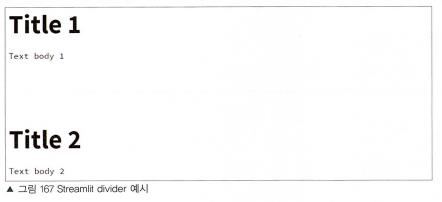
st.divider()섹션 구분선 만들기 → 주제별 그룹화에 유용 .
3) 가장 많이 쓰는 입력 위젯
Button: 클릭 시 True 반환 → 조건문과 함께 동작 제어.
	def button_write():
    	st.write('button activated')

    st.button('Reset', type='primary')
st.button('activate', on_click=button_write)-
Checkbox/Toggle: 체크/스위치 형태. on_change 콜백 지원, 상태 변화마다 실행. -
Selectbox/Radio/Multiselect: 단일/복수 선택. label, options, index=None로 비선택 초기화 가능. -
Slider: 단일 값 또는 (시작, 종료) 튜플로 범위 선택. -
Input계열:text_input(placeholder, max_chars, password),number_input,date_input,ime_input,camera_input. -
File uploader: 파일 타입 제한, 다중 업로드, on_change 콜백 지원.
4) 차트·이미지 붙이기
- Matplotlib →
st.pyplot(fig)/ Plotly →st.plotly_chart(fig)로 렌더링.
import streamlit as st
import matplotlib.pyplot as plt
import seaborn as sns

df = sns.load_dataset('tips')
fig, ax = plt.subplots()
sns.histplot(df, x='total_bill', ax=ax, hue='time')

st.pyplot(fig)-
Selectbox로 x/y/hue(또는 color)를 고르는 인터랙티브 박스플롯/스캐터 구성 가능.
-
st.image()는 PIL/numpy 이미지,width/caption옵션 지원.
5) 레이아웃 제대로 쓰기
-
Sidebar: with st.sidebar: 블록에 필터·설명 배치 (p.24).
-
Columns: col1, col2 = st.columns(2)로 가로 배치 (p.25).
-
Tabs: 여러 뷰를 탭으로 전환 (p.26).
-
Expander: 상세/부가 정보를 접어서 깔끔하게 유지 (p.27).
 # --- Tabs ---
    tab_h1, tab_h2, tab_h3 = st.tabs(["히트맵(AMT)", "TOP 페어(AMT)", "TOP 페어(AOV)"])

    with tab_h1:
        st.plotly_chart(
            px.imshow(
                pivot_amt,
                aspect="auto",
                color_continuous_scale="Viridis",
                labels=dict(color="AMT")
            ),
            use_container_width=True
        )

    with tab_h2:
        top_n = st.slider("TOP N (AMT 기준)", 5, 30, 10, 1, key="amt_topn")
        top_pairs = hot_agg.sort_values("AMT", ascending=False).head(top_n)
        st.dataframe(top_pairs, use_container_width=True)
        st.plotly_chart(
            px.bar(top_pairs, x="CTY_RGN_NM", y="AMT", color="TP_GRP_NM",
                   title=f"지역×업종 AMT TOP {top_n}", barmode="stack"),
            use_container_width=True
        )

    with tab_h3:
        top_aov = hot_agg.sort_values("AOV", ascending=False).head(10)
        st.dataframe(top_aov, use_container_width=True)
        fig_aov = px.bar(
            top_aov,
            x="CTY_RGN_NM", y="AOV", color="TP_GRP_NM",
            title="지역 × 업종 객단가(AOV) TOP 10",
            barmode="group",
            text_auto=".0f"
        )
        st.plotly_chart(fig_aov, use_container_width=True)
streamlit 패키지 이용!
시각화하기 좋은 툴을 이제야 알았다는 것에 아수운 마음이다.
리액트보다 훨씬 수월하고 쉽게 사용 가능 ..
Streamlit
데이터 과학자/분석가가 빠르게 프로토타입을 만들 수 있도록 설계됨.
코드 작성 방식이 일반적인 파이썬 스크립트와 거의 동일해서 진입 장벽이 낮음.
“실험용 앱/내부 툴/보고용 대시보드”에 최적.
Dash (by Plotly)
웹 앱을 좀 더 체계적이고 정교하게 개발하는 데 초점.
레이아웃과 콜백 구조가 필요해 학습곡선이 Streamlit보다 다소 있음.
“엔터프라이즈 대시보드/고객-facing 앱/멀티 페이지 앱”에 더 적합.
༼ つ ◕_◕ ༽つ
Dash도 파이썬 기반 웹/앱 프레임워크
각 특징을 확인하면서 프레임워크를 적절히 골라 사용하면 좋을 거 같다.
개인적으로는 streamlit이 기본 ui가 더 예뿌다.
(☞゚ヮ゚)☞ 한달후기
파이썬, mysql, 대쉬보드 만들기까지 한 달 동안 매우 많은 것들을 배우고 실습했다.
학부 때 배운 걸 한 달 동안 후다닥 정리해볼 수 있어서 유익했다.
프로젝트가 매우매우 기대된다.
끝.