연도별 어린이 보행자 사고건수를 보기위해 TASS 교통사고 분석 시스템에서 데이터를 받아왔다.
- 필요한 패키지와 폰트를 로드해 주었다.
import pandas as pd
import matplotlib.pyplot as plt
from matplotlib import font_manager, rc
import matplotlib
import platform
if platform.system() == 'Windows':
    matplotlib.rc('font', family='Malgun Gothic')
    #Malgun
%matplotlib inline- 데이터 불러오기
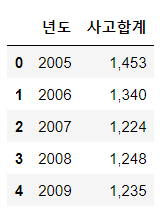
df1 = pd.read_csv('../data/어린이보호구역 사고수/어린이 보호구역 사고(2005~2020).csv')

df1.head()
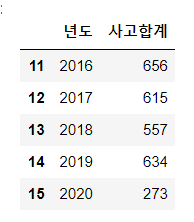
- 16년부터 20년 데이터만 가져오기
all = df1.iloc[11:16]
all
- 년도와 사고합계의 데이터 타입을 변경해준다.
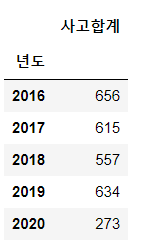
all = all.astype({'년도':'int64','사고합계':'int'})- 인덱스를 초기화해준다.
all.set_index('년도', inplace=True)
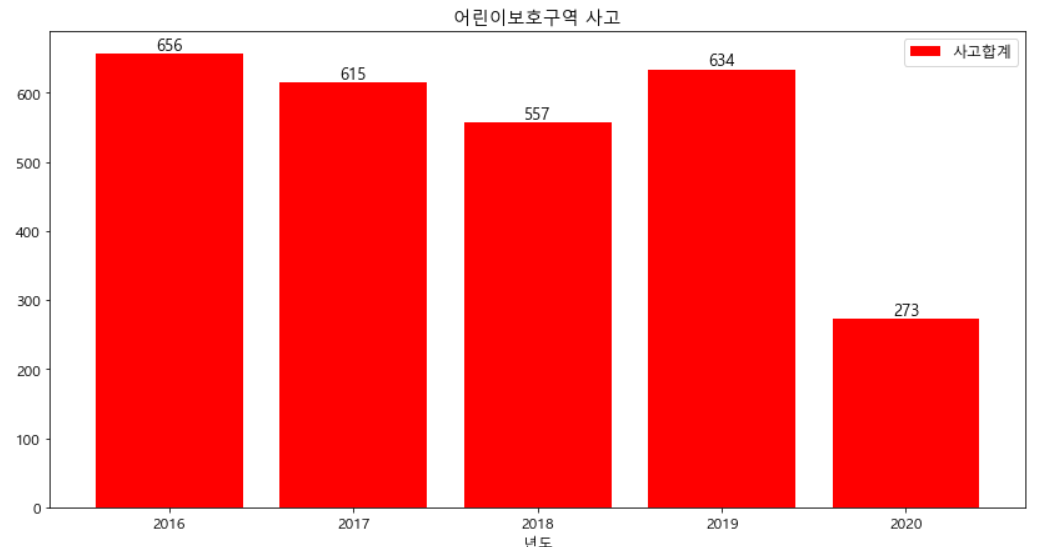
- 그래프를 그려준다.
plt.rcParams["figure.figsize"] = (14,7)
plt.rcParams['font.size'] = 12
ax = all.plot.bar(y=['사고합계'],rot=0,color=['r','c','b','g','y'],width=0.8)
for temp in ax.patches:
    ax.annotate('%d'%temp.get_height(),(temp.get_x()+temp.get_width()/2 , temp.get_height()) , ha = 'center' , va='bottom',fontsize=13)
    plt.title('어린이보호구역 사고')
plt.show()
- 분석결과
어린이보호구역 내 사고가 2020년에 매우 많이 감소했다.
이는 민식이법과 같은 강력한 법이 있기 때문에 가능했다.
출처
연도별 어린이 사고 건수(http://taas.koroad.or.kr/web/shp/sbm/initUnityAnalsSys.do?menuId=WEB_KMP_OVT_UAS)
