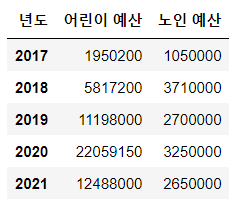
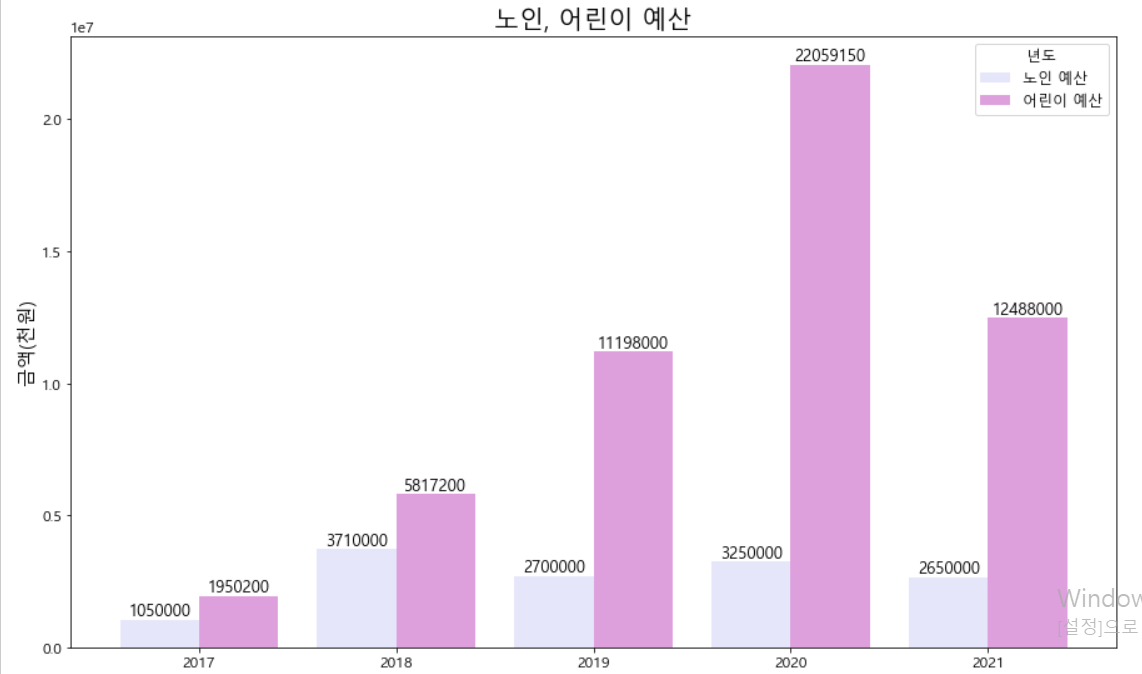
어린이 보호구역과 노인보호구역의 예산을 비교했다. 데이터는 서울시 예산사이트를 이용하였다.
- 필요한 패키지와 폰트를 로드해 주었다.
import pandas as pd
import matplotlib.pyplot as plt
from matplotlib import font_manager, rc
import matplotlib
import platform
if platform.system() == 'Windows':
    matplotlib.rc('font', family='Malgun Gothic')
    #Malgun
%matplotlib inline- 필요한 데이터를 불러온다.
df = pd.read_csv('../data/예산/예산.csv',index_col=0)- 전처리를 해준다.
df = df.T

df['어린이 예산'] = df['어린이 예산'].astype('int')
df['노인 예산'] = df['노인 예산'].astype('int')
- 그래프를 그려준다.
plt.rcParams["figure.figsize"] = (15, 9)
plt.rcParams['font.size'] = 12
ax = df.plot.bar(y=['노인 예산','어린이 예산'],rot=0,color=['lavender','plum'],width=0.8)
for temp in ax.patches:
    ax.annotate('%d'%temp.get_height(),(temp.get_x()+temp.get_width()/2 , temp.get_height()) , ha = 'center' , va='bottom',fontsize=13)

plt.xlabel('년도', size=15)
plt.ylabel('금액(천원)', size=15)
plt.title('노인, 어린이 예산', size = 20)
plt.show()
- 분석 결과
현재 노인보호구역에 대한 예산은 어린이 보호구역에 비해 현저히 떨어지는 현황이다.
특히나 2020년의 민식이 법으로 인해 예산이 크게 증가한 반면, 노인보호구역에 대한 예산은 줄었다.
노인 보호구역의 필요성에 대한 인식과 관심이 현저하게 떨어지는 상황이다.
