이미지 확장자 주의 (jpg, jpeg)
열 때 프롬포트에서 spyder 오픈
matplotlib 창 닫고 다음 코드 실행
import cv2 as cv
import sys

img=cv.imread('bus.jpeg')

if img is None:
    sys.exit('파일을 찾을 수 없습니다')

gray=cv.cvtColor(img,cv.COLOR_BGR2GRAY)

(thresh, binary_otsu_img)= cv.threshold(gray,0,255, cv.THRESH_BINARY+cv.THRESH_OTSU)

print('The Best Threshold Value obtained by Otsu = ',thresh)

cv.imwrite('bus_bin_otsu.jpeg',binary_otsu_img)

cv.imshow('Gray Image',gray)
cv.imshow('Binary Otsu Image', binary_otsu_img)

cv.waitKey()
cv.destroyAllWindows()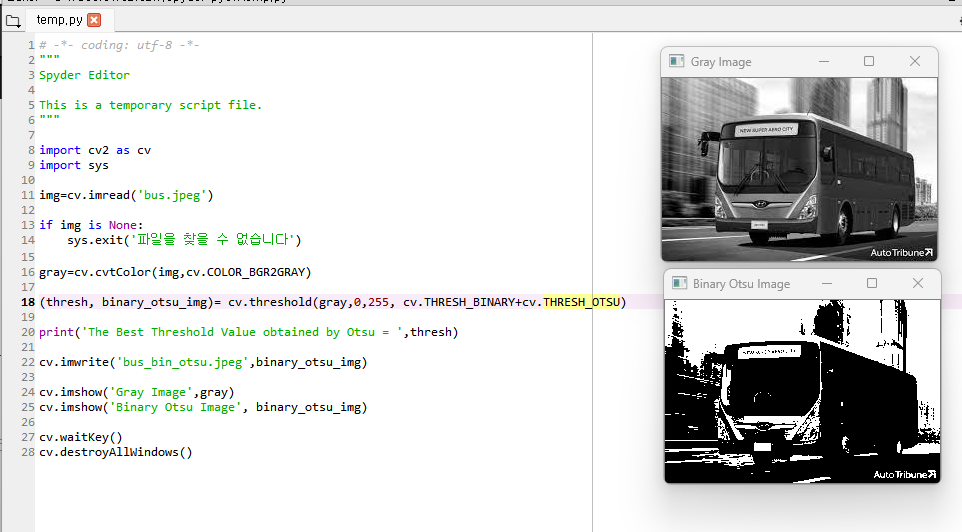
RGB 색상 추출
import cv2 as cv
import sys
import matplotlib.pyplot as plt

img=cv.imread('soccer.jpg')

if img is None:
    sys.exit('파일을 찾을 수 없습니다')

# Order ->BGR (0,1,2)

#red
image_red=img.copy()
image_red[:,:,1]=0 #delete green
image_red[:,:,0]=0 #delete blue

#green
image_green=img.copy()
image_green[:,:,2]=0#delete red
image_green[:,:,0]=0#delete blue

#blue
image_blue=img.copy()
image_blue[:,:,2]=0#delete red
image_blue[:,:,1]=0#delete green

#display
cv.imshow('Color Image', img)
cv.imshow('Red Channel', image_red)
cv.imshow('Green Channel', image_green)
cv.imshow('Blue Channel', image_blue)

cv.waitKey()
cv.destroyAllWindows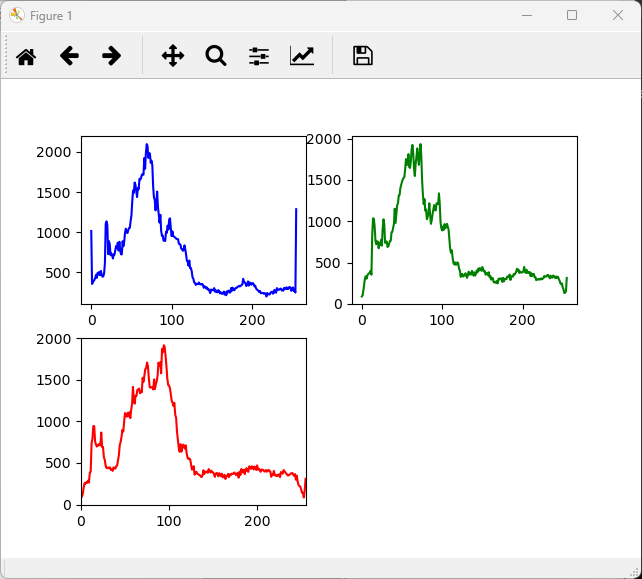
# -*- coding: utf-8 -*-
"""
RGB plot 출력 코드
"""

import cv2 as cv
import sys
import matplotlib.pyplot as plt

img=cv.imread('soccer.jpg')

if img is None:
    sys.exit('파일을 찾을 수 없습니다')

hist1=cv.calcHist([img],[0],None,[256],[0,256]) #B
hist2=cv.calcHist([img],[1],None,[256],[0,256])#G
hist3=cv.calcHist([img],[2],None,[256],[0,256])#R

plt.subplot(221),plt.plot(hist1,color='b')
plt.subplot(222),plt.plot(hist2,color='g')
plt.subplot(223),plt.plot(hist3,color='r')

plt.xlim([0,256])

plt.show()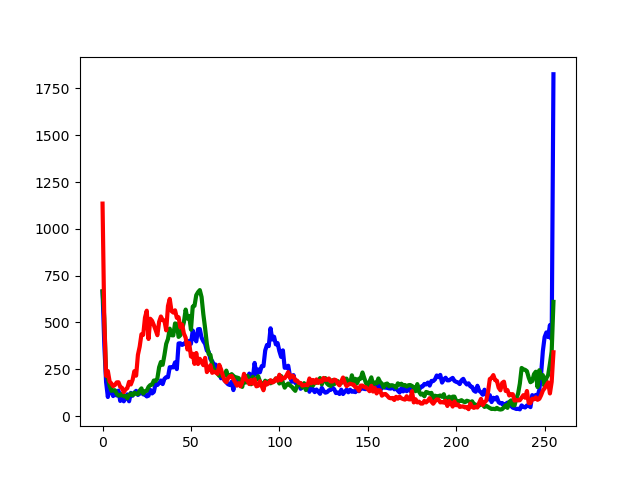
# -*- coding: utf-8 -*-
"""
Spyder Editor

This is a temporary script file.
"""

import cv2 as cv
import sys
import matplotlib.pyplot as plt

img=cv.imread('bus.jpeg')

if img is None:
    sys.exit('파일을 찾을 수 없습니다')

colors=['b','g','r']
bgr_planes=cv.split(img)

for(p,c) in zip(bgr_planes, colors):
    histogram=cv.calcHist([p],[0],None,[256],[0,256])
    plt.plot(histogram,color=c, linewidth=3)

plt.show()
++ plot window 창에 추가
https://talkingaboutme.tistory.com/entry/ML-Spyder%EB%82%B4%EC%97%90%EC%84%9C-plot%EC%9D%84-new-window%EC%97%90-%ED%95%98%EA%B8%B0
# -*- coding: utf-8 -*-
"""
Spyder Editor

This is a temporary script file.
"""

import cv2 as cv
import numpy as np
from matplotlib import pyplot as plt

img=cv.imread('Lena_gray.png',0)

sobelx=cv.Sobel(img,-1,1,0,3)
sobely=cv.Sobel(img,-1,0,1,3)

abs_grad_x=cv.convertScaleAbs(sobelx)
abs_grad_y=cv.convertScaleAbs(sobely)
sobel=cv.addWeighted(abs_grad_x,0.5,abs_grad_y, 0.5,0)

mask=np.array([[-1,-1,-1],[-1,8,-1],[-1,-1,-1]])

plt.subplot(2,2,1),plt.imshow(img,cmap='gray')
plt.title('Original'),plt.xticks([]),plt.yticks([])
plt.subplot(2,2,2),plt.imshow(sobel,cmap='gray')
plt.title('Sobel'),plt.xticks([]),plt.yticks([])
plt.subplot(2,2,3),plt.imshow(sobelx,cmap='gray')
plt.title('Sobel X'),plt.xticks([]),plt.yticks([])
plt.subplot(2,2,4),plt.imshow(sobely,cmap='gray')
plt.title('SobelY'),plt.xticks([]),plt.yticks([])

cv.imshow('Original',img)
cv.imshow('Sobel X', sobelx)
cv.imshow('Sobel Y',sobely)
cv.imshow('Sobel',sobel)

cv.waitKey()
cv.destroyAllWindows()