📊통계
신뢰구간과 가설검정
-
가설검정
새로운 약물이 기존 약물보다 효과가 있는지 검정
이 때 새로운 약물은 기존 약물과 큰 차이가 없다는 것이귀무가설
대립가설은 새로운 약물이 기존 약물과 대비해 교과가 있다는 것 -
T검정
두 집단간의 평균 차이가 통계적으로 유의미한지 확인하는 검정방법
독립표본 T검정대응표본 T검정
# 학생 점수 데이터
scores_method1 = np.random.normal(70, 10, 30)
scores_method2 = np.random.normal(75, 10, 30)

# 독립표본 t검정
t_stat, p_val = stats.ttest_ind(scores_method1, scores_method2)
print(f"T-Statistic: {t_stat}, P-value: {p_val}") - 다중검정
여러 가설을 동시에 검정할때 발생하는 문제 (본페로니 보정)
import numpy as np
import scipy.stats as stats

# 세 그룹의 데이터 생성
np.random.seed(42)
group_A = np.random.normal(10, 2, 30)
group_B = np.random.normal(12, 2, 30)
group_C = np.random.normal(11, 2, 30)

# 세 그룹 간 평균 차이에 대한 t검정 수행
p_values = []
p_values.append(stats.ttest_ind(group_A, group_B).pvalue)
p_values.append(stats.ttest_ind(group_A, group_C).pvalue)
p_values.append(stats.ttest_ind(group_B, group_C).pvalue)

# 본페로니 보정 적용
alpha = 0.05
adjusted_alpha = alpha / len(p_values)

# 결과 출력
print(f"본페로니 보정된 유의 수준: {adjusted_alpha:.4f}")
for i, p in enumerate(p_values):
    if p < adjusted_alpha:
        print(f"검정 {i+1}: 유의미한 차이 발견 (p = {p:.4f})")
    else:
print(f"검정 {i+1}: 유의미한 차이 없음 (p = {p:.4f})")- 카이제곱 검정
범주형 데이터의 표본 분포가 모집단 분포와 일치하는지 검정(적합도 검정) 하거나 두 범주형 변수간의 독립성을 검정(독립성 검정)
제1종, 2종 오류
- 제 1종오류 : 귀무가설이 참인데 기각하는 오류
- 제 2종오류 : 귀무가설이 거짓인데 기각하지 않는 오류
✅ 회귀
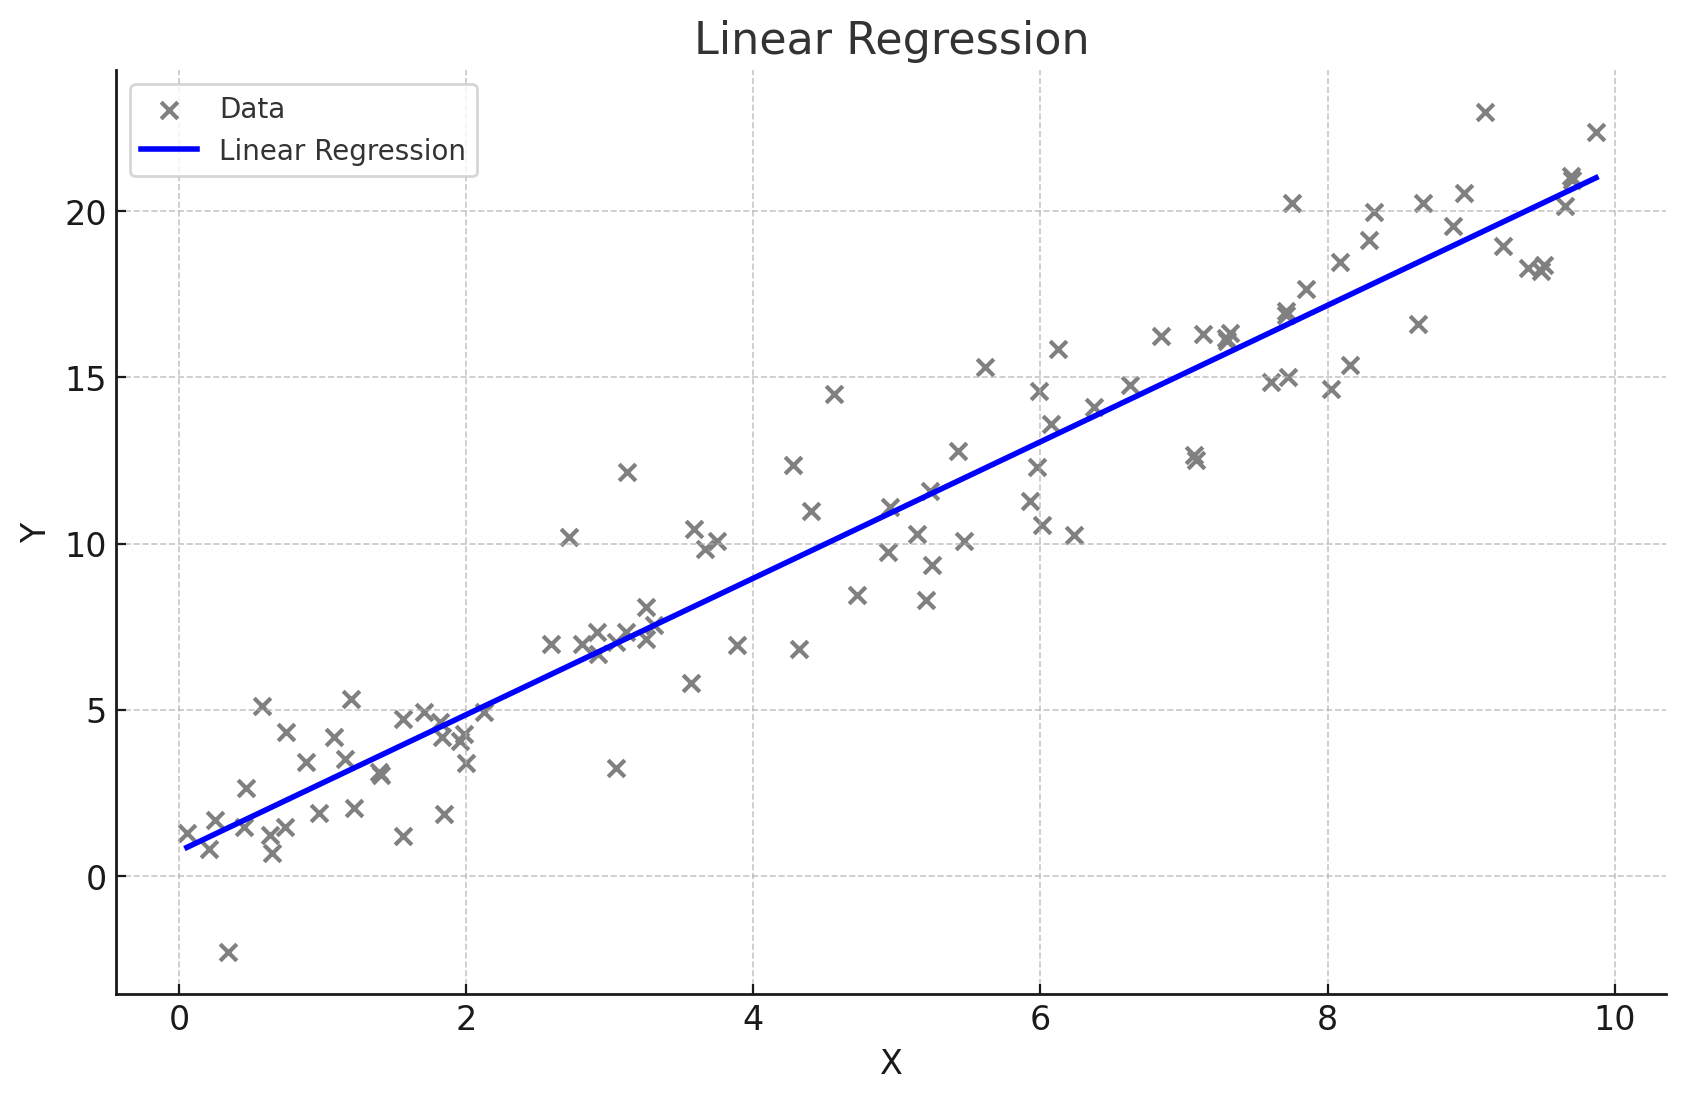
단순선형회귀
다중선형회귀
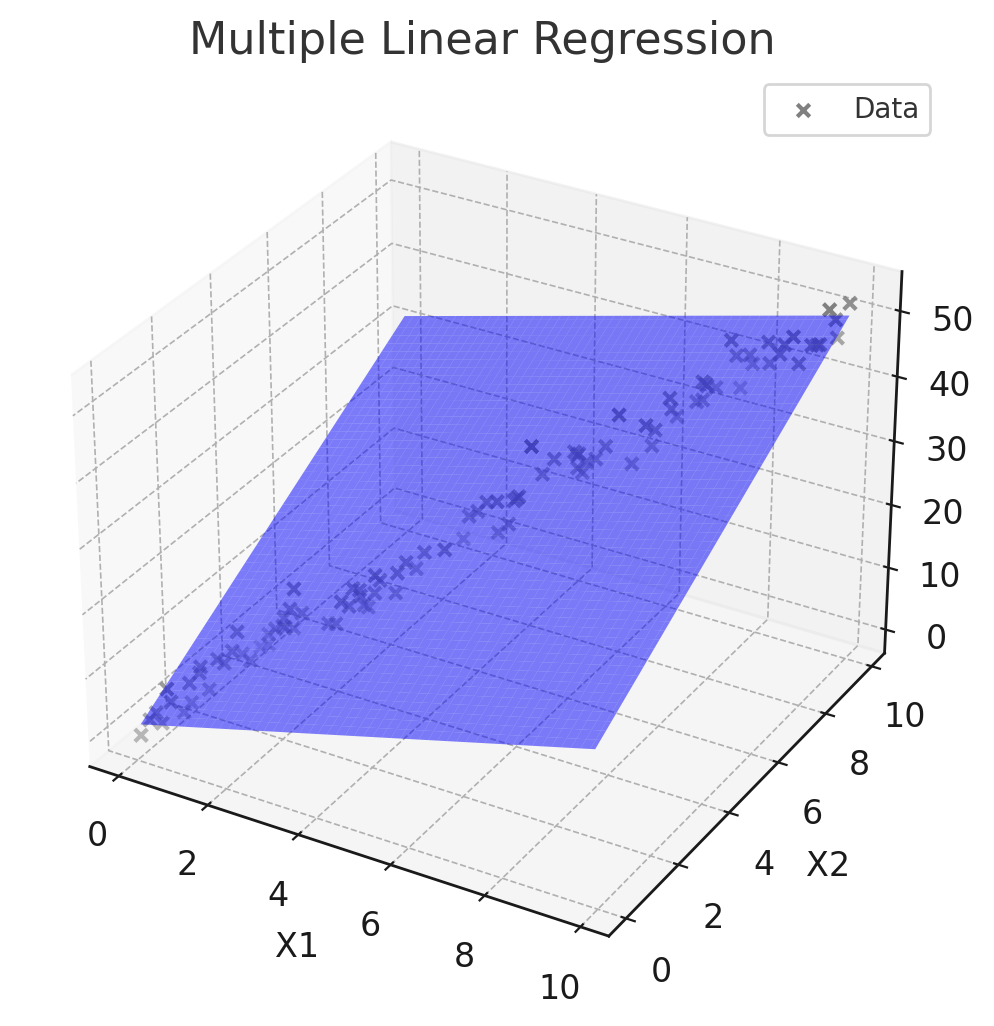
- 다중공선성
독립변수들 간에 높은 상관관계가 있는 경우
이때 각 변수의 개별적인 효과를 분리해내기 어려워 회귀 해석이 어려워짐.
💡해결방법 :
1) 높은 계수를 가진 변수 중 하나를 제거
2) 주성분 분석(pca) 변수들을 효과적으로 줄이기
-
범주형 변수
1) 순서가 있는 범주형 : 옷의 사이즈(s,m,l)
-> s ->1 , m ->22) 순서가 없는 범주형 : 성별(남,여), 지역(서울,대전,대구 등)
-> 3개 이상의 경우 무조건 원-핫 인코딩(판다스 get_dummies)
# 범주형 변수 더미 변수로 변환
df = pd.get_dummies(df, drop_first=True)
다항회귀 / 스플라인 회귀
-
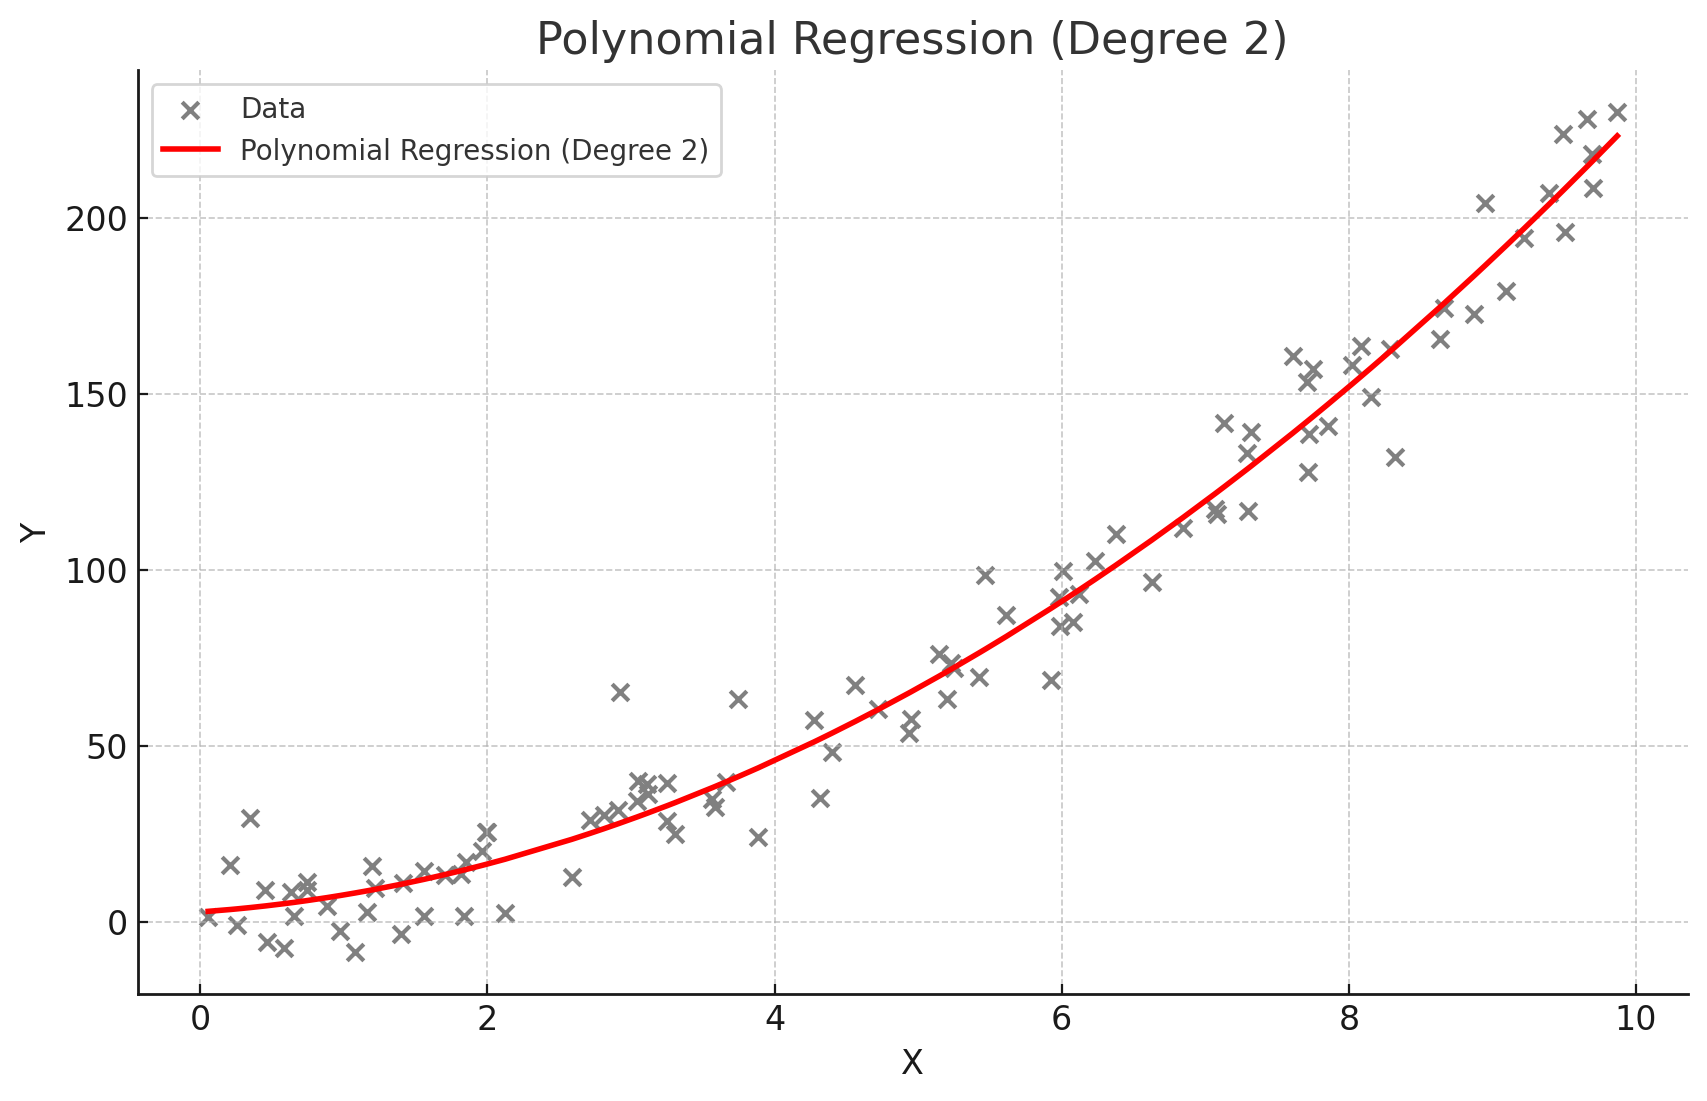
다항회귀
독립변수와 종속변수 간의 관계가 선형이 아닐때 사용
고차 다항식의 경우 과적합 위험
-
스플라인 회귀
구간마다 다른 회귀식을 적용하여 복잡한 관계를 모델링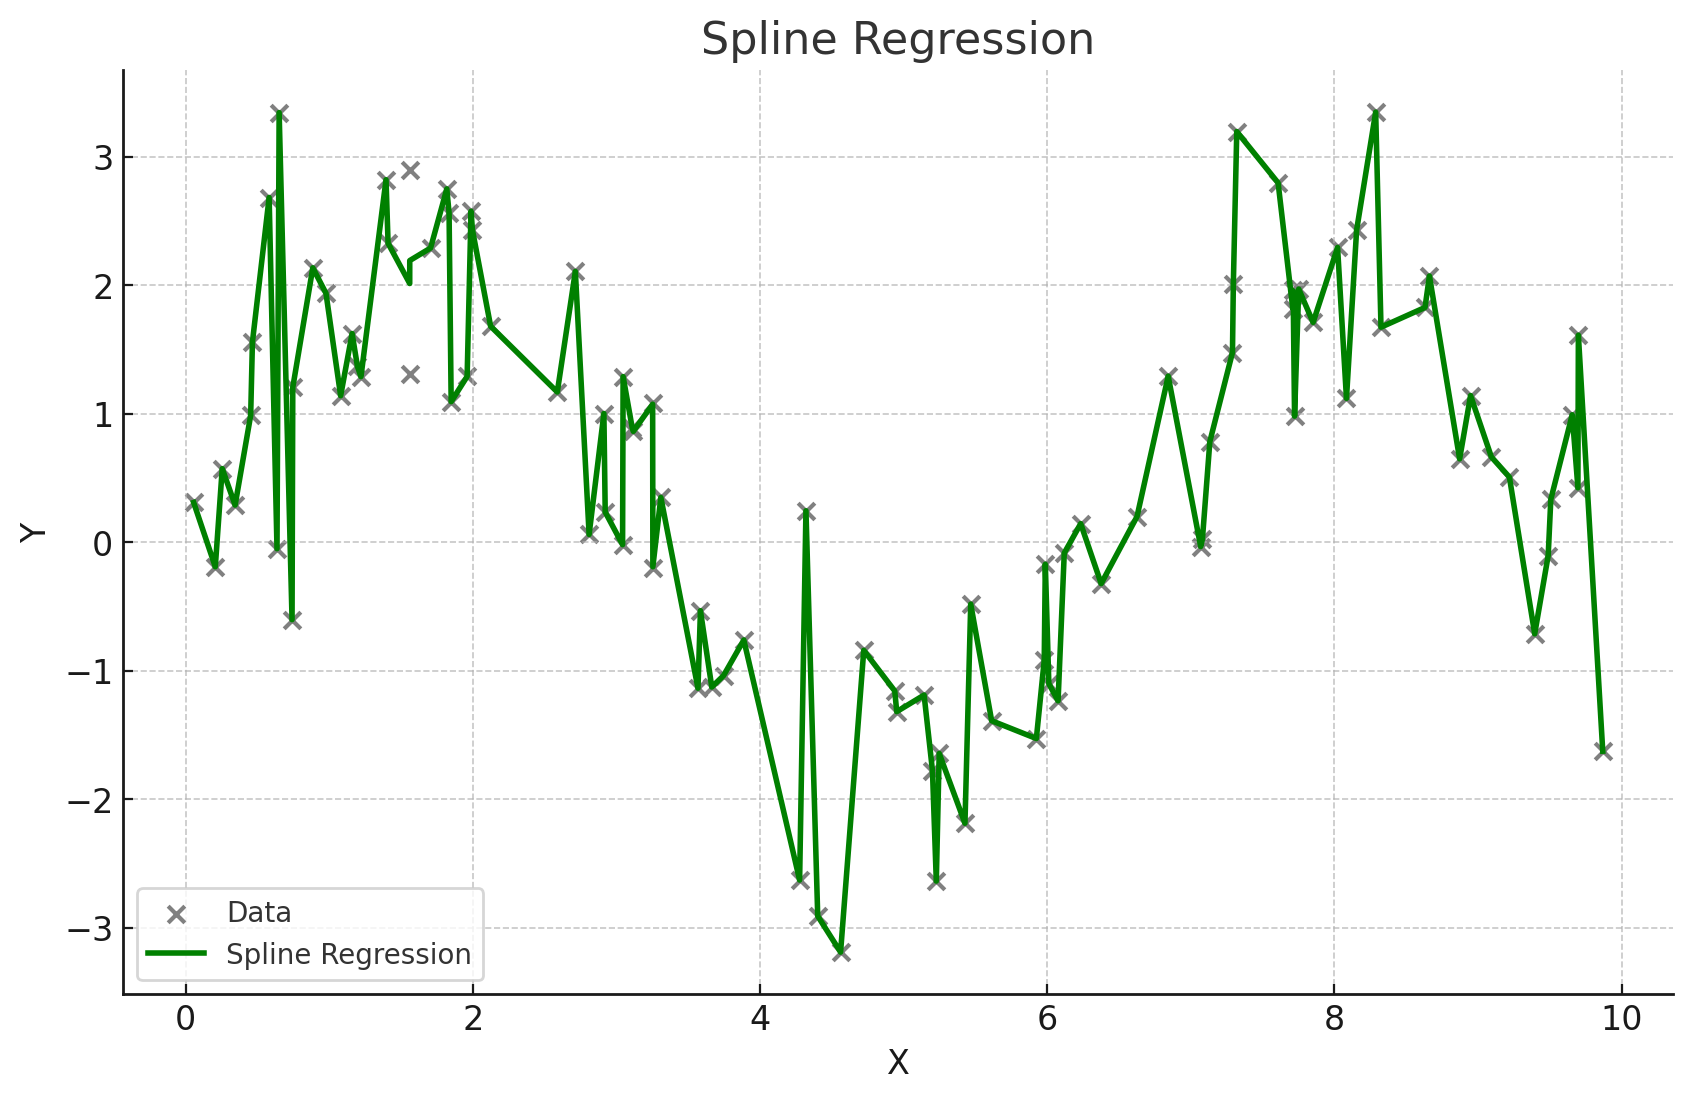
✅ 상관관계
-
피어슨 상관계수
두 연속형 변수 간의 선형 관계를 측정하는 지표
선형적인 관계가 예상될때 사용가능(비선형x)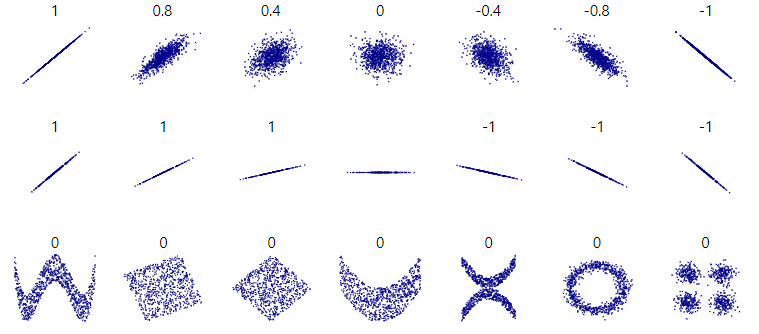
맨 마지막 줄은 피어슨 상관계수로는 0이 나옴
import numpy as np
import pandas as pd
import matplotlib.pyplot as plt
import seaborn as sns
from scipy.stats import pearsonr

# 예시 데이터 생성
np.random.seed(0)
study_hours = np.random.rand(100) * 10
exam_scores = 3 * study_hours + np.random.randn(100) * 5

# 데이터프레임 생성
df = pd.DataFrame({'Study Hours': study_hours, 'Exam Scores': exam_scores})

# 피어슨 상관계수 계산
pearson_corr, _ = pearsonr(df['Study Hours'], df['Exam Scores'])
print(f"피어슨 상관계수: {pearson_corr}")

# 상관관계 히트맵 시각화
sns.heatmap(df.corr(), annot=True, cmap='coolwarm', vmin=-1, vmax=1)
plt.title('pearson coefficient heatmap')
plt.show()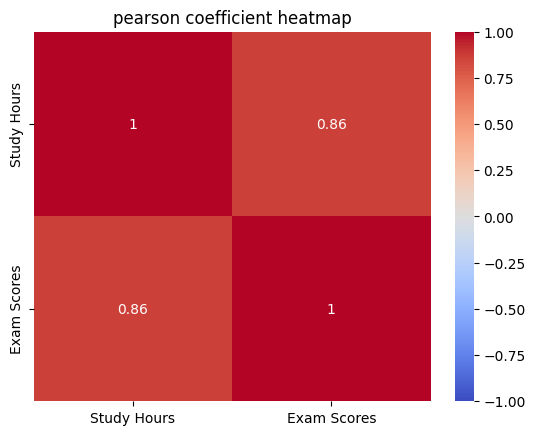
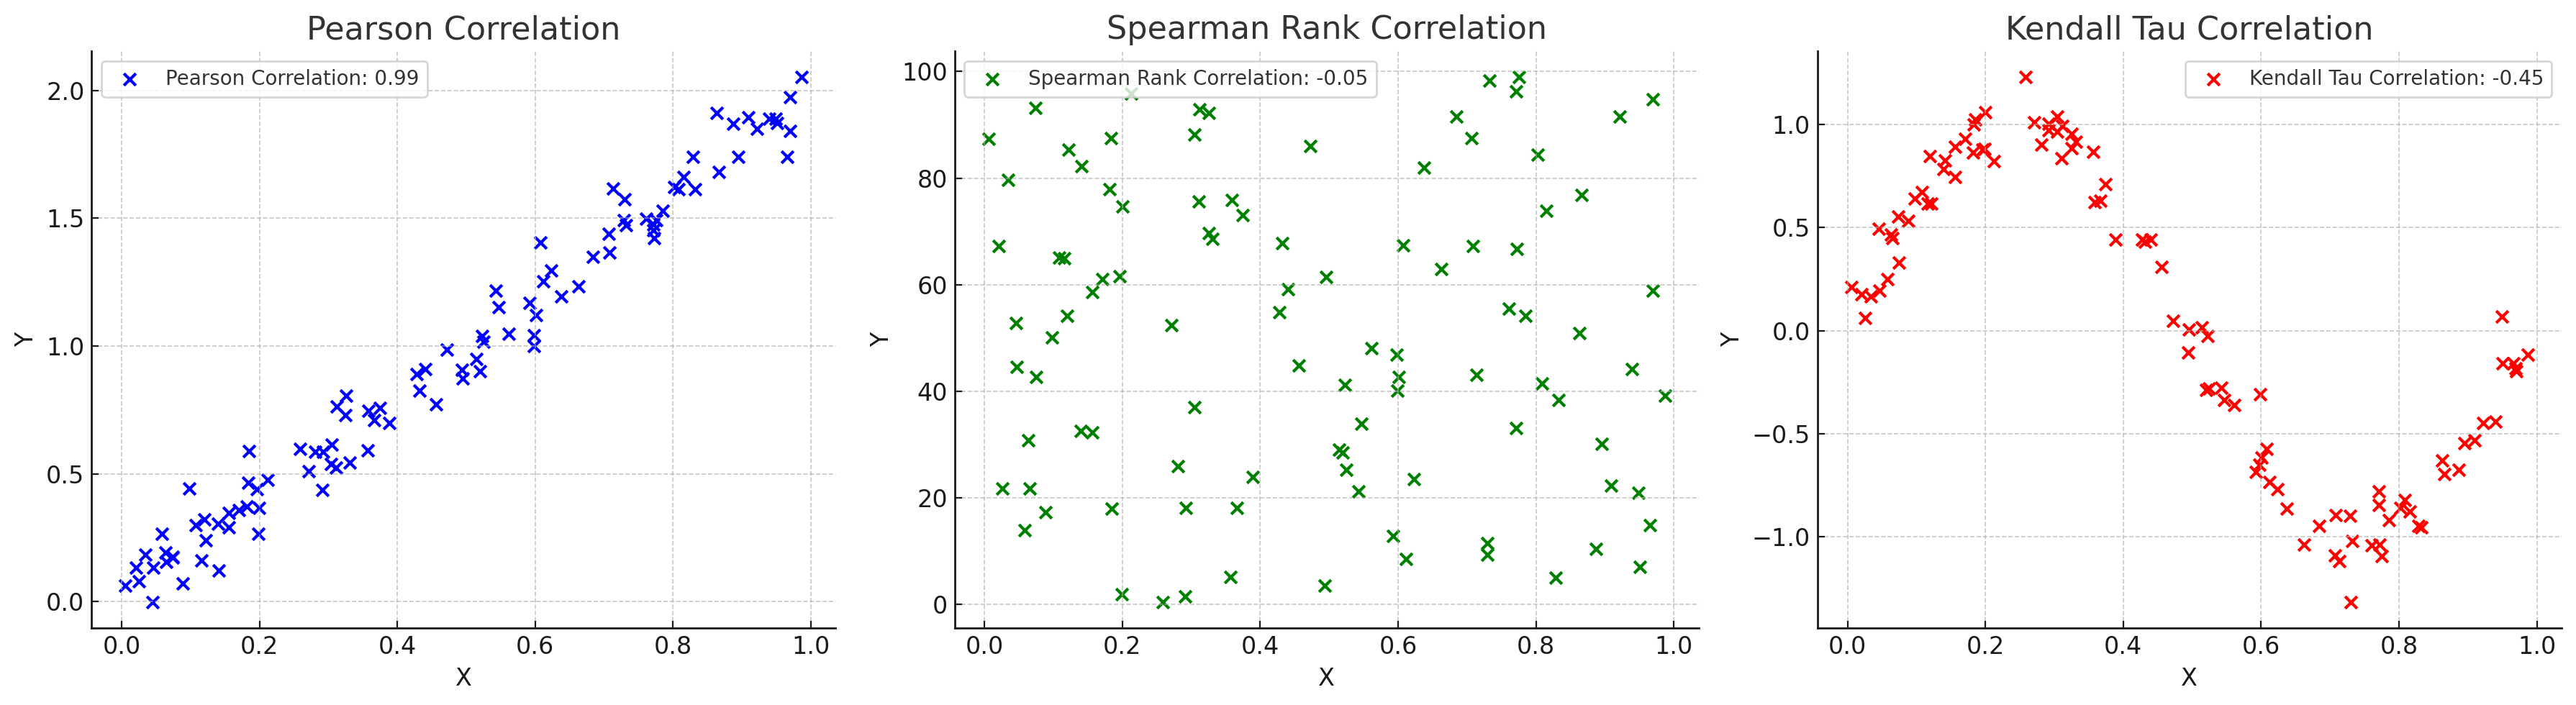
비모수 상관계수
데이터가 정규분포를 따르지 않거나 변수들이 순서형 데이터일때 사용하는 상관계수
스피어만 상관계수 : 두 변수의 순위 간의 일관성 측정, 데이터 내 편차와 에러에 민감
타우 상관계수 순위 간의 일치 쌍 및 불일치 쌍의 비율을 바탕으로 계산
상호정보 상관계수
변수간의 정보 의존성을 바탕으로 비선형 관계를 탐지
📌 가설검정의 주의점
- 재현 가능성 : 우연히 결과가 나오는것이 아닌, 항상 일관된 결과가 나오는지 확인!
-
p해킹 : 유의미한 결과를 얻기 위해 다양한 변수를 시도하거나 데이터를 계속해서 분석하는 등의 방법
-
선택적 보고 : 유의미한 결과만 보고하는것
-
자료수집 중단시점 : 언제 중단할지 명확하게 결정하지 않으면, 원하는 결과가 나올때까지 계속 수집할수 있음.
-
데이터 탐색 / 검증 분리
from sklearn.model_selection import train_test_split

# 데이터 생성
np.random.seed(42)
X = 2 * np.random.rand(100, 1)
y = 4 + 3 * X + np.random.randn(100, 1)

# 데이터 분할 (탐색용 80%, 검증용 20%)
X_train, X_test, y_train, y_test = train_test_split(X, y, test_size=0.2, random_state=42)

# 모델 학습
model = LinearRegression()
model.fit(X_train, y_train)

# 탐색용 데이터로 예측
y_train_pred = model.predict(X_train)

# 검증용 데이터로 예측
y_test_pred = model.predict(X_test)

# 탐색용 데이터 평가
train_mse = mean_squared_error(y_train, y_train_pred)
train_r2 = r2_score(y_train, y_train_pred)
print(f"탐색용 데이터 - MSE: {train_mse}, R2: {train_r2}")

# 검증용 데이터 평가
test_mse = mean_squared_error(y_test, y_test_pred)
test_r2 = r2_score(y_test, y_test_pred)
print(f"검증용 데이터 - MSE: {test_mse}, R2: {test_r2}")