✔ 벡터의 내적은 두 벡터 간의 유사도를 계산하는 데도 이용할 수 있다.
전체 코드
from sklearn.datasets import load_digits
import matplotlib.gridspec as gridspec
digits = load_digits()
d1 = digits.images[0]
d2 = digits.images[10]
d3 = digits.images[1]
d4 = digits.images[11]
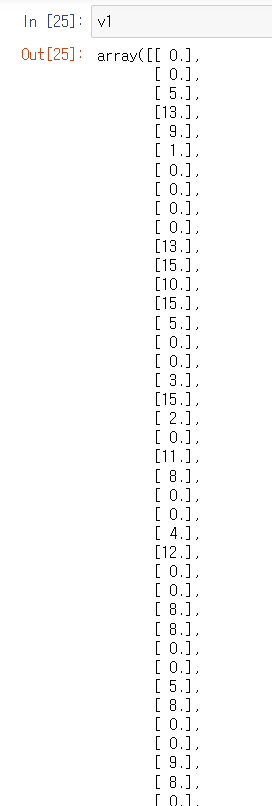
v1 = d1.reshape(64, 1)
v2 = d2.reshape(64, 1)
v3 = d3.reshape(64, 1)
v4 = d4.reshape(64, 1)
plt.figure(figsize=(9, 9))
gs = gridspec.GridSpec(1, 8, height_ratios=[1],
width_ratios=[9, 1, 9, 1, 9, 1, 9, 1])
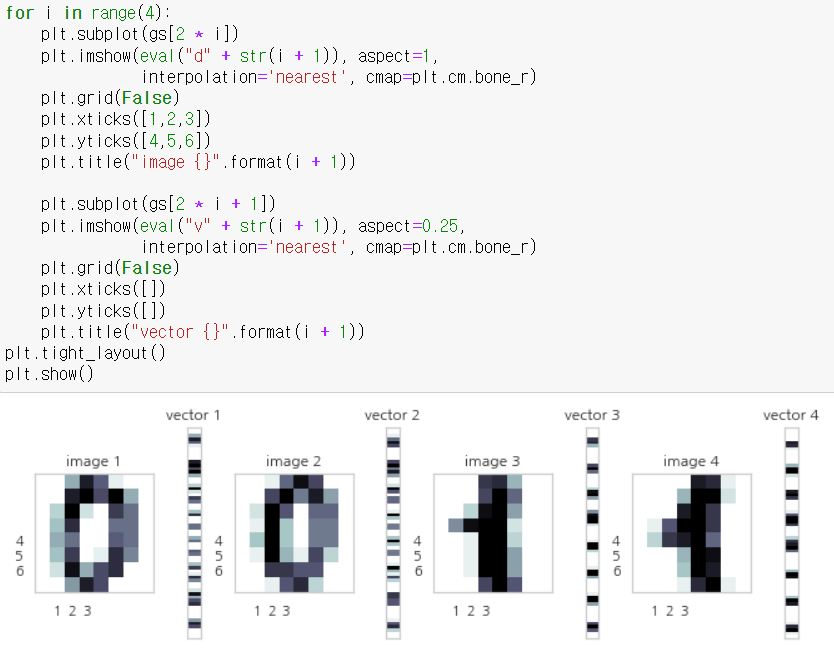
for i in range(4):
plt.subplot(gs[2 * i])
plt.imshow(eval("d" + str(i + 1)), aspect=1,
interpolation='nearest', cmap=plt.cm.bone_r)
plt.grid(False)
plt.xticks([])
plt.yticks([])
plt.title("image {}".format(i + 1))
plt.subplot(gs[2 * i + 1])
plt.imshow(eval("v" + str(i + 1)), aspect=0.25,
interpolation='nearest', cmap=plt.cm.bone_r)
plt.grid(False)
plt.xticks([])
plt.yticks([])
plt.title("vector {}".format(i + 1))
plt.tight_layout()
plt.show()💻 코드로 학습한 파이썬
✔ 패키지 임포트
◻ from sklearn.datasets import load_digits
작은 데이터셋을 제공하는 패키지
그 중에서 숫자 데이터를 제공함
◻ import matplotlib.gridspec
Figure를 그릴 때 영역을 자유자재로 나누고 싶으면 사용함
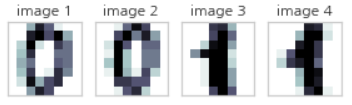
✔ 손글씨 가져오기
digits = load_digits()
d1 = digits.images[0]
d2 = digits.images[10]
d3 = digits.images[1]
d4 = digits.images[11]
load.digits().images[ 입력값 ] 으로 손글씨 숫자를 가져올 수 있다.
입력값을 10으로 나누었을 때 나머지 값이 가져오는 손글씨 숫자이다.
d1 = digits.images[0]
d2 = digits.images[10]
이 코드를 실행하면, 모두 0을 가져온다.
하지만 같은 0이 아니다. 조금씩 다르다.
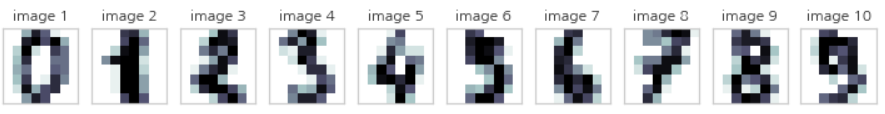
images[0] ~ images[9]를 가져오면 다음과 같다.
✔ 2차원 이미지를 1차원으로 변경
내적을 계산하기 위해 2차원 이미지를 1차원으로 변경한다.
⚠ 벡터의 내적을 위한 조건
1. 우선 두 벡터의 차원(길이)이 같아야 한다.
2. 앞의 벡터가 행 벡터이고 뒤의 벡터가 열 벡터여야 한다.
v1 = d1.reshape(64, 1)
v2 = d2.reshape(64, 1)
v3 = d3.reshape(64, 1)
v4 = d4.reshape(64, 1)
✔ 화면에 손글씨를 보여주기 위해 틀 잡기
plt.figure(figsize=(9, 9))
gs = gridspec.GridSpec(1, 8, height_ratios=[1],
                       width_ratios=[9, 1, 9, 1, 9, 1, 9, 1])
◻ plt.figure( figsize=(9, 9) )
전체 화면은 가로 세로 각각 9인치이다.
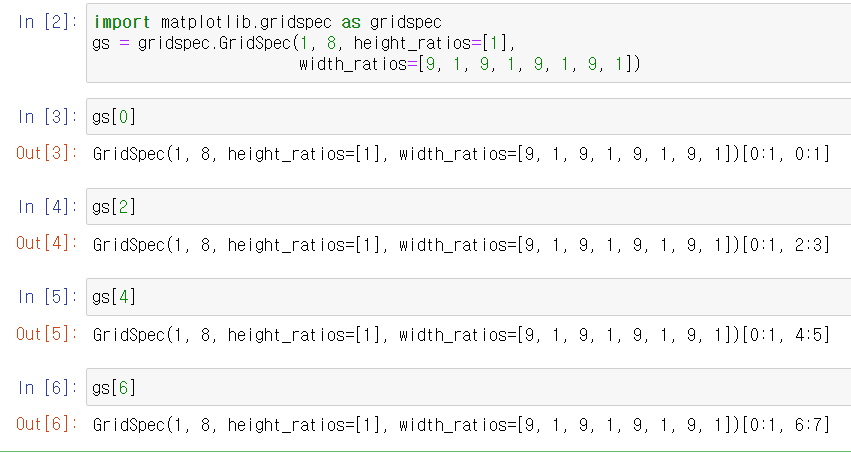
◻ gs = gridspec.GridSpec(1, 8, height_ratios=[1],
width_ratios=[9, 1, 9, 1, 9, 1, 9, 1])
figure 내에서 서브플롯을 배치하기 위한 그리드 레이아웃
⚠ 그리드 레이아웃은 1행 8열이다.
⚠ height_ratios : 행의 상대적 높이를 정의함.
⚠ width_ratios : 열의 상대적 너비를 정의함
✔ 화면에 손글씨 배치하기
for i in range(4):
    plt.subplot(gs[2 * i])
    plt.imshow(eval("d" + str(i + 1)), aspect=1,
               interpolation='nearest', cmap=plt.cm.bone_r)
    plt.grid(False)
    plt.xticks([])
    plt.yticks([])
    plt.title("image {}".format(i + 1))
    plt.subplot(gs[2 * i + 1])
    plt.imshow(eval("v" + str(i + 1)), aspect=0.25,
               interpolation='nearest', cmap=plt.cm.bone_r)
    plt.grid(False)
    plt.xticks([])
    plt.yticks([])
    plt.title("vector {}".format(i + 1))
◻ plt.subplot(gs[2 * i])
한 화면에 여러 개의 그래프 그리기
gs[2 * i]를 수동으로 실행시킨 결과 :
서브플롯을 적절한 위치에 배치시키는 역할을 함
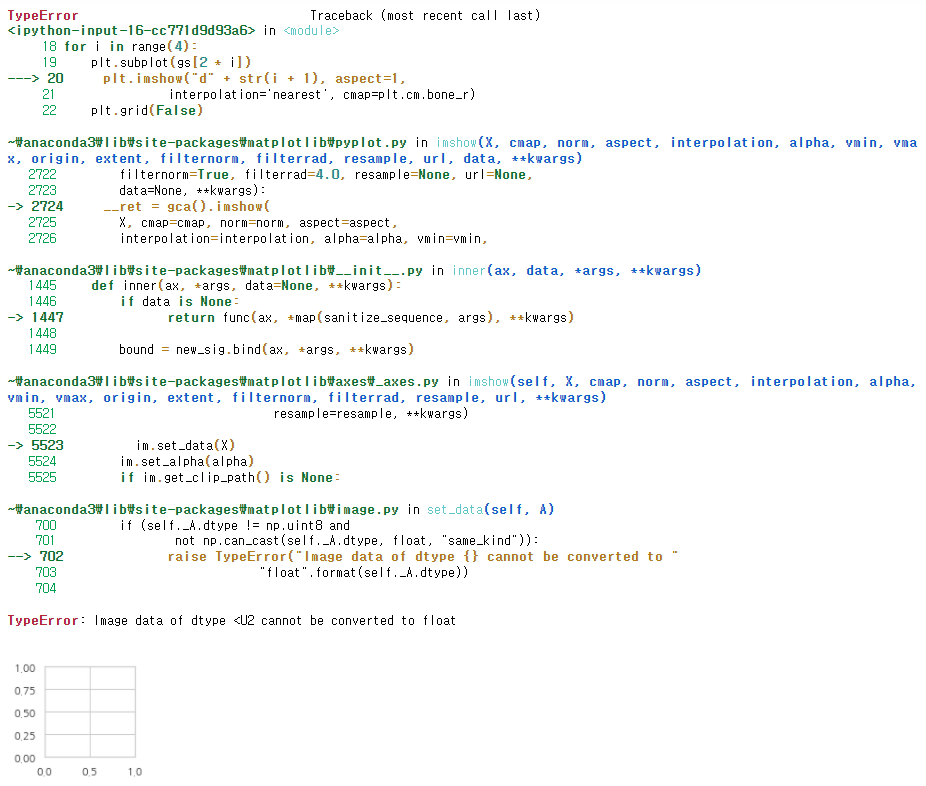
◻ eval("d" + str(i + 1)) / eval("v" + str(i + 1))
"d" + str(i+1) / "v" + str(i + 1) 는 문자열이다.
코드로 동작하게 하려면 코드로 변환이 필요하다.
이 때 사용하는 게 eval()이다.
eval 함수를 사용하지 않았을 때의 결과
◻ plt.grid(False)
격자를 그리고 싶으면 True, 아니면 False
◻ plt.xticks([]) / plt.yticks([])
x축과 y축의 눈금을 설정하는 부분이다.
눈금을 설정하지 않기를 원하므로 빈 공간으로 채워준다.
⚠ 눈금을 설정한 경우이다.
이미지는 8X8 사이즈이고 눈금 설정을 3개만 해서,
화면에 보여지는 눈금도 3개이다.
✔ 화면에 보여주기
plt.tight_layout()
plt.show()
◻ plt.tight_layout()
서브 플롯간에 올바른 간격 유지
◻ plt.show()
최종적으로 완성된 그래프 보여주기
✔ 내적하여 유사도 계산하기
⚠ 벡터의 내적을 위한 조건
1. 우선 두 벡터의 차원(길이)이 같아야 한다.
2. 앞의 벡터가 행 벡터이고 뒤의 벡터가 열 벡터여야 한다.
2차원 배열을 1차원으로 변경하여 저장한 변수 v1의 형태 :
열 벡터이다. (행 벡터로 변경해주어야 한다.)
다음과 같이 열 벡터를 행 벡터로 변경해준다.
변수.T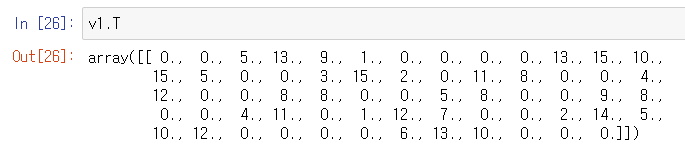
⚠ 내적 계산하기
변수 @ 변수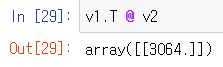
결과를 깔끔하게 출력하려면
(변수 @ 변수)[0][0] # 0행 0열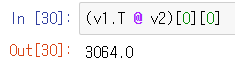
0과 1의 유사도를 계산해보면?
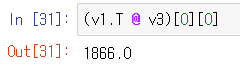
결론은?
내적으로 유사도를 계산해보니,
v1 (숫자 0)과 v2 (숫자 0)의 유사도는.
v1 (숫자 0)과 v3 (숫자 1)의 유사도보다 높게 측정이 되었다.
그래서 v1은 v3보단 v2에 가깝다.