실시간 Data Pipeline 구축
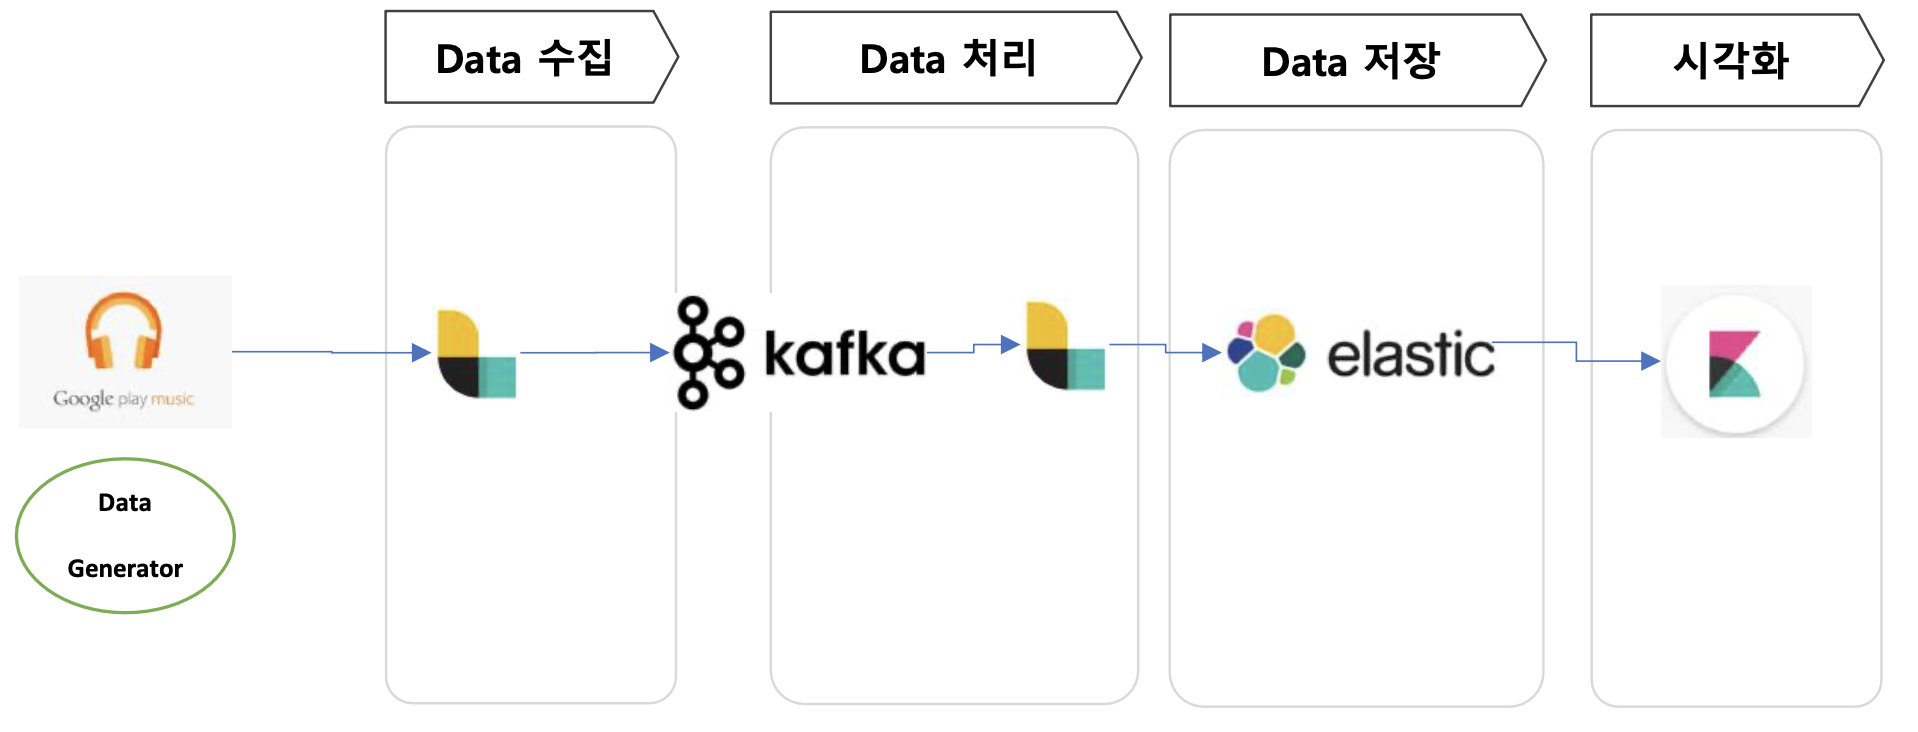
- Elastic Stack으로 빠르게 구성할 수 있음
- Logstash (Producer와 Consumer)
- elastic search (data 저장)
- Kibana (시각화)
기본 설정
1) 주키퍼, 카프카 켜주기
cd ~/apps/kafka_2.12-3.6.2

bin/zookeeper-server-start.sh -daemon config/zookeeper.properties

bin/kafka-server-start.sh -daemon config/server.properties
elastic search
1) elastic search 설치
다운로드 참조 링크
2) 다운로드
cd ~/apps
wget https://artifacts.elastic.co/downloads/elasticsearch/elasticsearch-8.14.1-linux-x86_64.tar.gz
tar -xzf elasticsearch-8.14.1-linux-x86_64.tar.gz
cd ~/apps/elasticsearch-8.14.1- config 설정 : 파일 내용 수정
vi config/elasticsearch.yml

# bind ip to connect from client  (lan이 여러개 있을 경우 외부에서 접속할 ip를 지정할 수 있음.)
network.host: 0.0.0.0   #(":" 다음에 스페이스를 추가해야 함.)

# Master Node의 후보 서버 목록을 적어준다. (여기서는 1대 이므로 본인의 IP만(내부아이피)
cluster.initial_master_nodes: ["서버이름"]

# kibana에서 보안정책 없이 접근 가능하도록 "false"로 변경
xpack.security.enabled: false
- virtual memory error 해결 :1-3번으로 시행
# 0) 현재 설정 값 확인
> cat /proc/sys/vm/max_map_count
65530

# 아래 3가지 방법 중 1가지를 선택하여 적용 가능
# 1-1) 현재 서버상태에서만 적용하는 방식
> sudo sysctl -w vm.max_map_count=262144

# 1-2) 영구적으로 적용 (서버 재부팅시 자동 적용)
> sudo vi /etc/sysctl.conf

# 아래 내용 추가
vm.max_map_count = 262144

# 1-3) 또는 아래 명령어 실행
> echo vm.max_map_count=262144 | sudo tee -a /etc/sysctl.conf


# 3) 시스템에 적용하여 변경된 값을 확인
> sudo sysctl -p
vm.max_map_count = 262144
3) 실행
bin/elasticsearch4) 엘라스틱 서치 방화벽 열어주기 (디폴트 : 9200)
- 탐색 -> VPC -> 방화벽
- 방화벽 규칙 만들기
- 대상 : 네트워크의 모든 인스턴스
- 소스범위 : 0.0.0.0/0
- TCP 포트 : 9200
- 다른 포트 알아보기
- zookeeper : 2181
- Broker : 9202
Kibana 설치
1) 설치
cd ~/apps
curl -O https://artifacts.elastic.co/downloads/kibana/kibana-8.14.1-linux-x86_64.tar.gz
tar -xzf kibana-8.14.1-linux-x86_64.tar.gz
cd ~/apps/kibana-8.14.1/- 설정 변경
> vi config/kibana.yml
# 외부에서 접근 가능하도록 설정
server.host: "0.0.0.0"
2) 키바나 실행
> cd ~/apps/kibana-8.14.1/
> bin/kibana
.....
  log   [10:40:10.296] [info][server][Kibana][http] http server running at http://localhost:5601
  log   [10:40:12.690] [warning][plugins][reporting] Enabling the Chromium sandbox provides an additional layer of protection
3) 방화벽 설정
- 엘라스틱 설치와 같은 방화벽 설정에서 포트 추가해주기 ( 5601포트)
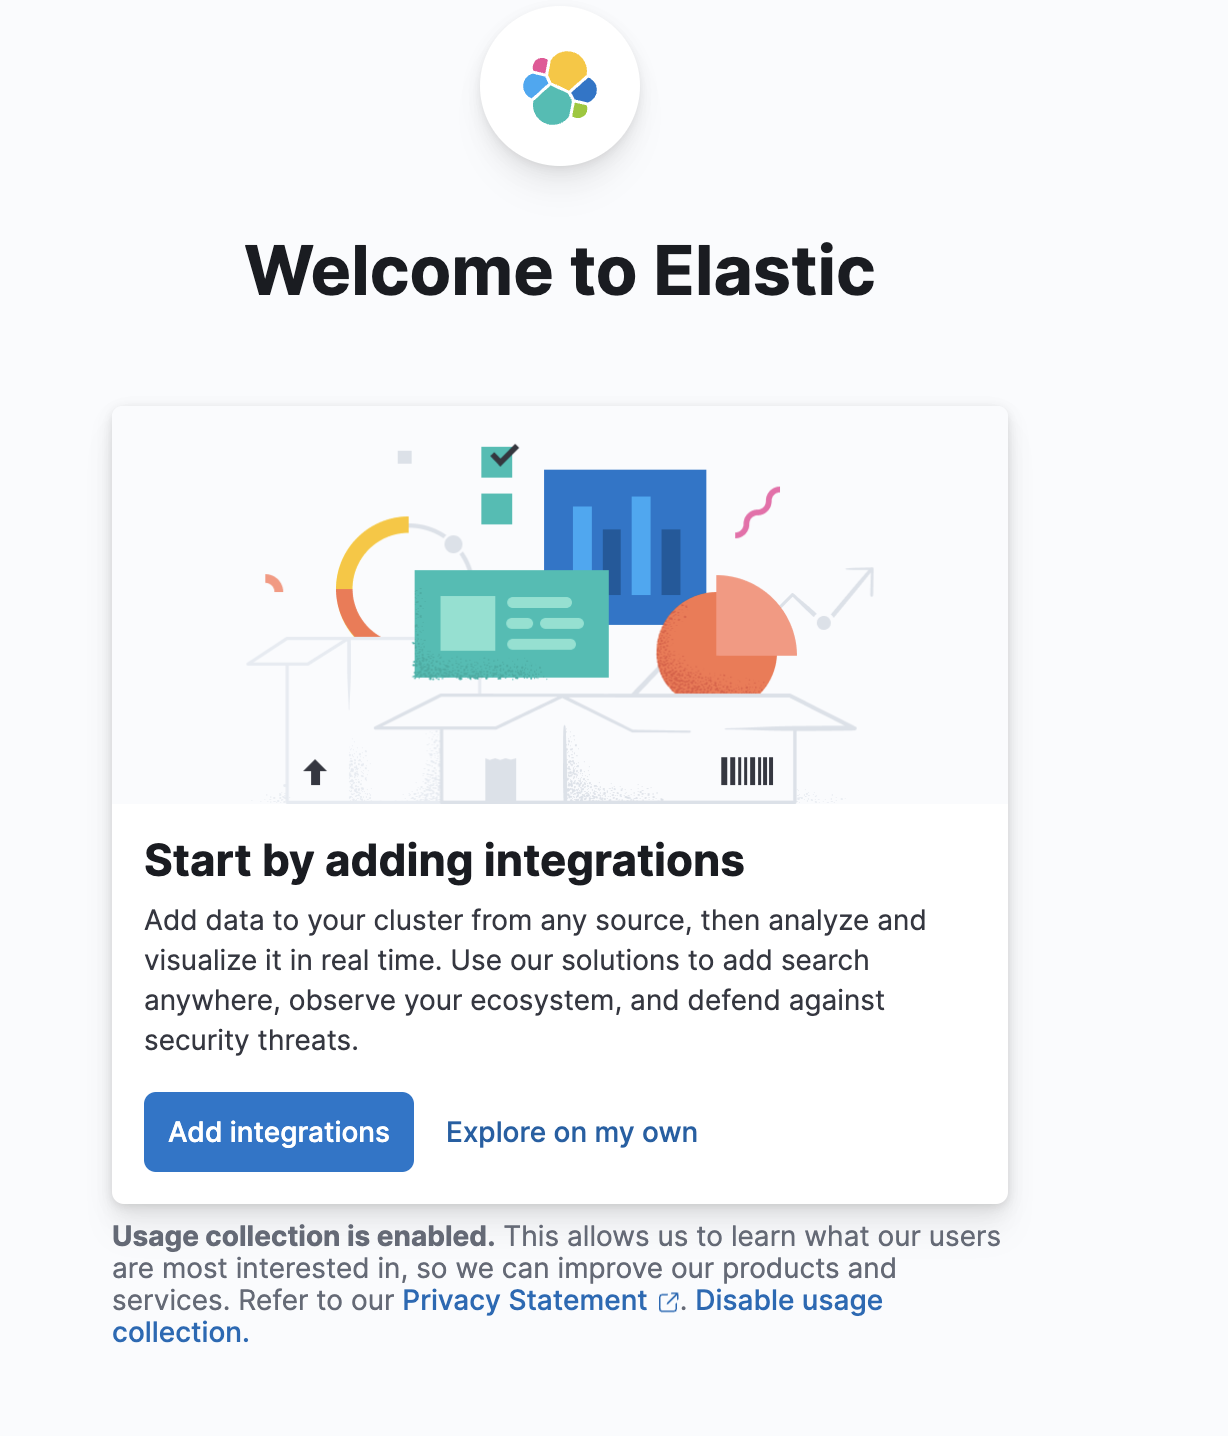
4) 웹으로 들어가보기
Logstash
1) 설치
> cd ~/apps
> wget https://artifacts.elastic.co/downloads/logstash/logstash-8.14.1-linux-x86_64.tar.gz
> tar xvf logstash-8.14.1-linux-x86_64.tar.gz
> cd ~/apps/logstash-8.14.1
2) test
- 뭘 원하는지 이야기를 해줘야함 (액션 지정 필요)
- 테스트는 키보드 입력을 받고 출력해 주는걸로만 test 진행
> bin/logstash -e 'input { stdin { } } output { stdout {} }'
# 실행까지 시간이 소요된다. (아래 메세지가 출력되면 정상 실행된 것으로 확인)
.........
[2024-07-02T15:42:37,938][INFO ][logstash.javapipeline    ][main] Pipeline started {"pipeline.id"=>"main"}
The stdin plugin is now waiting for input:
[2024-07-02T15:42:37,953][INFO ][logstash.agent           ] Pipelines running {:count=>1, :running_pipelines=>[:main], :non_running_pipelines=>[]}

mytest  <-- 메세지 입력 후 아래와 같이 출력되면 정상적으로 설치된 것
{
         "event" => {
        "original" => "mytest"
    },
    "@timestamp" => 2024-07-08T02:11:50.695154985Z,
      "@version" => "1",
       "message" => "mytest",
          "host" => {
        "hostname" => "kafka-demo.asia-northeast1-b.c.gifted-kit-428310-f4.internal"
    }
}
Pipeline 구축
Kafka Topic 만들기
- 토픽 생성
> cd ~/apps/kafka_2.12-3.6.2

> bin/kafka-topics.sh --create --bootstrap-server localhost:9092 --replication-factor 1 --partitions 1 --topic realtime

# check created topic "realtime"
> bin/kafka-topics.sh --list --bootstrap-server localhost:9092
__consumer_offsets
realtime- 토픽 확인해보기 (test)
Producer

> bin/kafka-console-producer.sh --broker-list localhost:9092 --topic realtime
This is a message
This is another message

Consumer

> cd ~/apps/kafka_2.12-3.6.2
> bin/kafka-console-consumer.sh --bootstrap-server localhost:9092 --topic realtime --from-beginning

This is a message
This is another message
Data file
- 실습 파일 다운로드
> cd ~/apps
> wget https://github.com/freepsw/demo-spark-analytics/raw/master/00.stage1/tracks.csv
- csv 파일을 통해서 한줄씩 읽어와서 Data Generator을 통해서 실제 음악을 듣는 것 처럼 생성해냄
- 이를 tracks_live.csv에 저장
> touch tracks_live.csv- 위와 같은 파일 생성의 파이썬 코드 만들기
> cd ~/apps
> vi data_generator.py
#-*- coding: utf-8 -*-
import time
import random
r_fname = "tracks.csv"
w_fname = "tracks_live.csv"
rf = open(r_fname)
wf = open(w_fname, "a+")
try:
num_lines = sum(1 for line in rf)
print(num_lines)
#num_lines = 10
rf.seek(0)
lines = 0
while (1):
line = rf.readline()
wf.write(line)
wf.flush()
# sleep for weighted time period
stime = random.choice([1, 1, 1, 0.5, 0.5, 0.8, 0.3, 2, 0.1, 3])
print(stime)
time.sleep(stime)
lines += 1
# exit if read all lines
if(lines == num_lines):
break
# if(lines == num_lines):
# rf.seek(0)
finally:
rf.close()
wf.close()
print("close file")Logstash 설정
- 로그 스테시가 어떤 것을 기준으로 실행될것인지 만들어주는 것
Producer
1)생성
- ~/apps/producer.conf
- 입력 : csv
- 출력
1) 콘솔
2) 카프카로 보내기 (logstash 출력값에서 메세지만 보내겠다.)
> vi ~/apps/producer.conf

input {
  file {
    path => "{csv 경로 적어주기}"
  }
}

output {
  stdout {
    codec => rubydebug{ }
  }

  kafka {
    codec => plain {
      format => "%{message}"
    }
    bootstrap_servers => "localhost:9092"
    topic_id => "realtime"
  }
}
2) 실행 해보기
- logstash 실행
~/apps/logstash-8.14.1/bin/logstash -f ~/apps/producer.conf- data_generater 실행
> cd ~/apps
> python data_generator.py- 로그들이 계속 생성됨 (콘솔창)

consumer
1) 생성
> cd ~/apps
> vi ~/apps/consumer.conf
input {
kafka{
topics => ["realtime"]
bootstrap_servers => "localhost:9092"
}
}
filter {
csv {
columns => ["event_id","customer_id","track_id","datetime","ismobile","listening_zip_code"]
separator => ","
}
date {
match => [ "datetime", "YYYY-MM-dd HH:mm:ss"]
target => "datetime"
}
mutate {
convert => { "ismobile" => "integer" }
}
}
output {
stdout { codec => rubydebug }
elasticsearch {
hosts => "http://localhost:9200"
index => "ba_realtime"
}
} - elarstic search 는 index 이름이 필요한데, index 만 설정해주면 알아서 잘 만들어줌.
2) 실행
- path.data : data를 어디까지 읽어왔는지 내부적으로 확인하는 용도.
> cd ~/apps
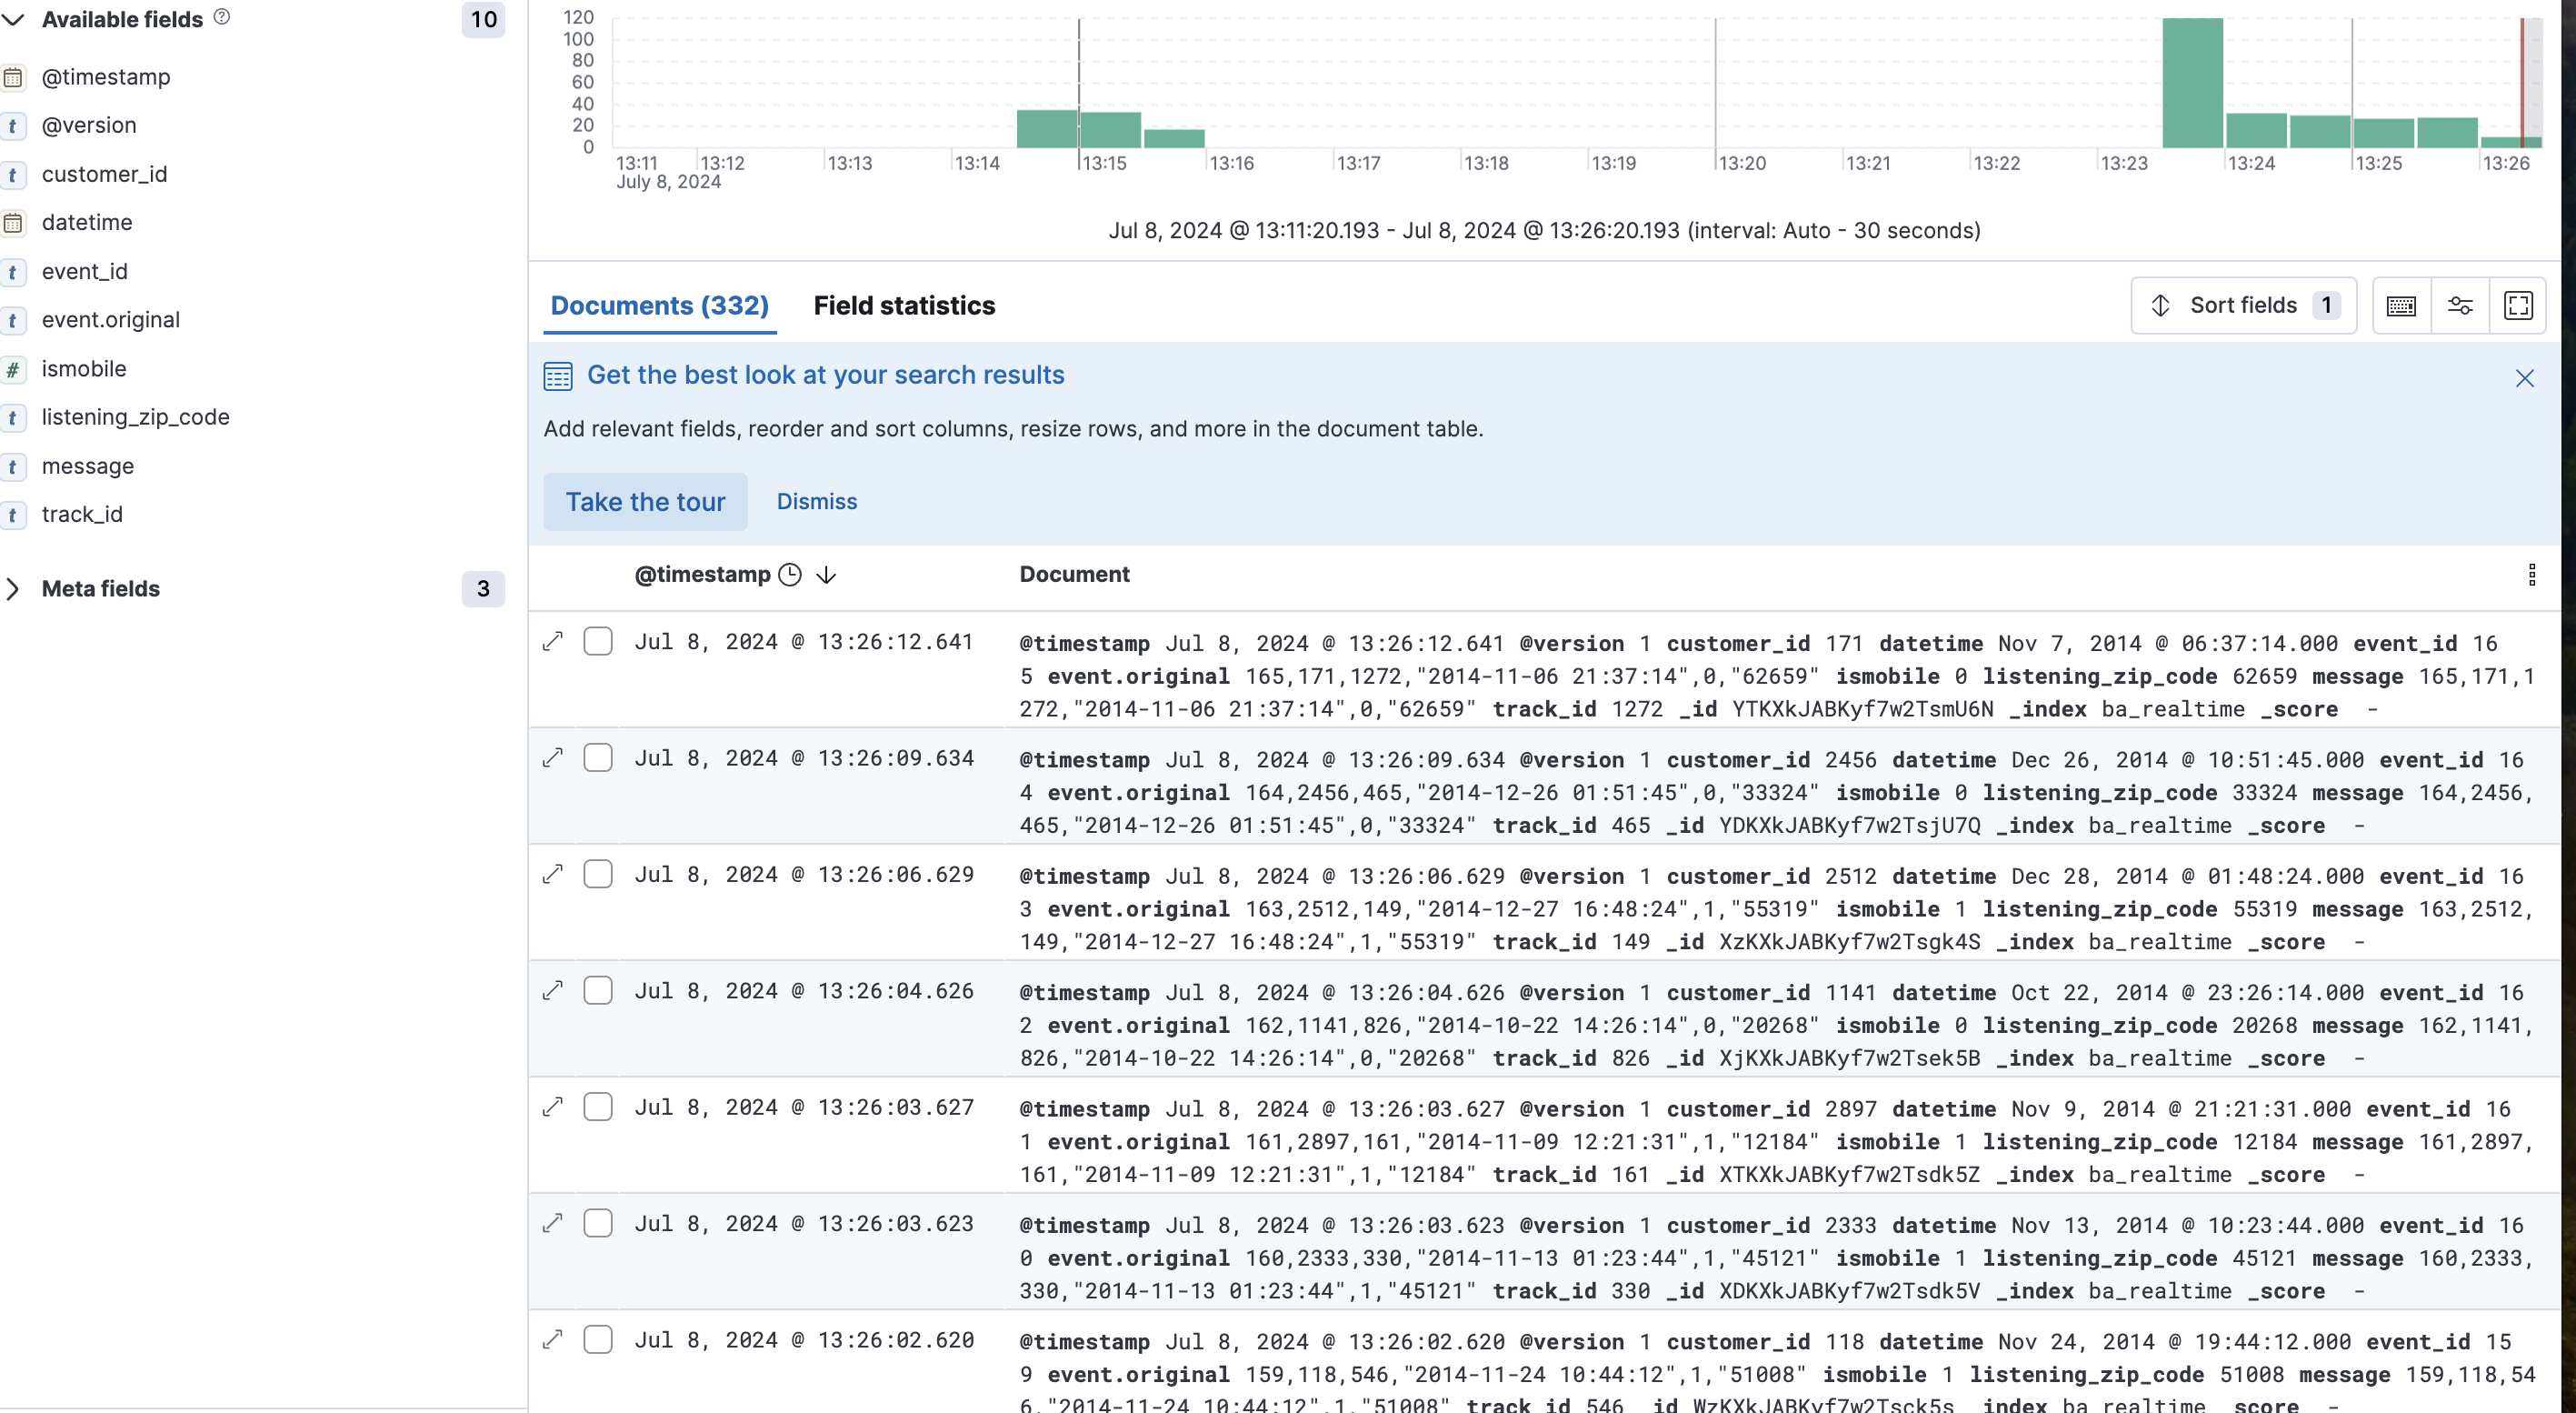
> ~/apps/logstash-8.14.1/bin/logstash --path.data ~/apps/consumer-data -f ~/apps/consumer.conf3) 결과

- 키바나에서도 볼수 있음 (5601 port)
- Discover -> 내가 만들어준 인덱스를 name, index pattern 동일하게 적어주고 만드렴 시각화로도 볼 수 있음.
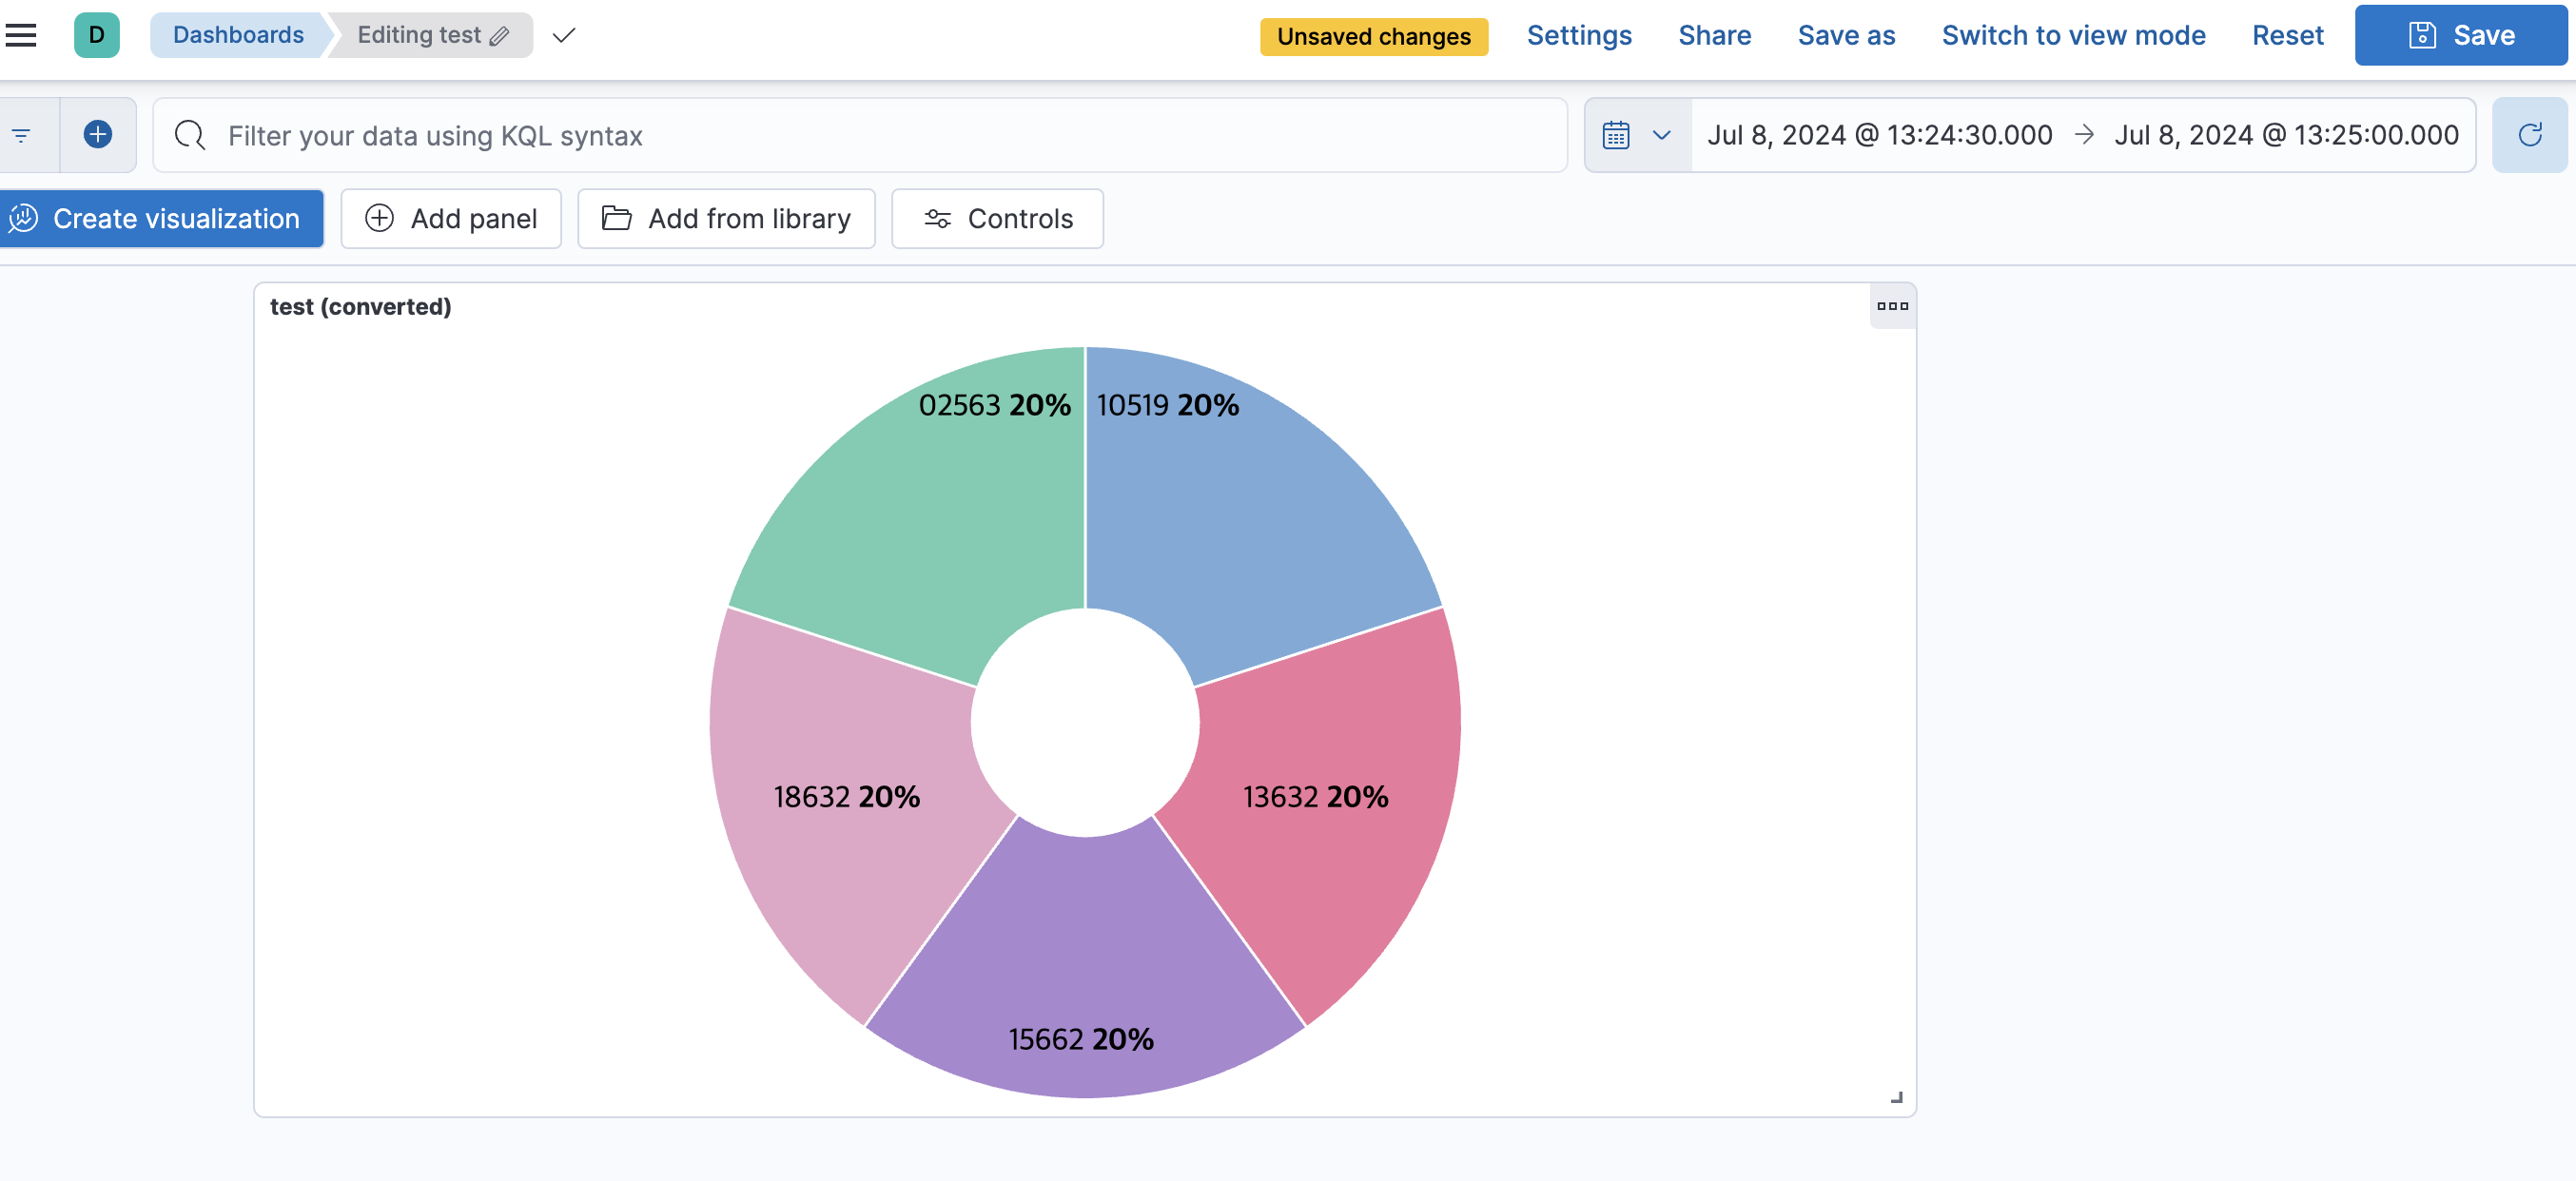
시각화
Visualize Library
-> explore option -> Pie
오른쪽의 옵션들을 선택해주면 빠르게 로그들로 시각화 가능

- 저장시, 대쉬보드로도 넣을 수 있음.
- 대쉬보드 Share 에서 iframe 으로 code를 주기 때문에 웹페이지에 띄울 수 수 있음. html 안에 넣을 수 있음.

신윤재입니다