Confidence Intervals and Hypothesis testing - Week 4
Lesson 1 - Confidence Intervals
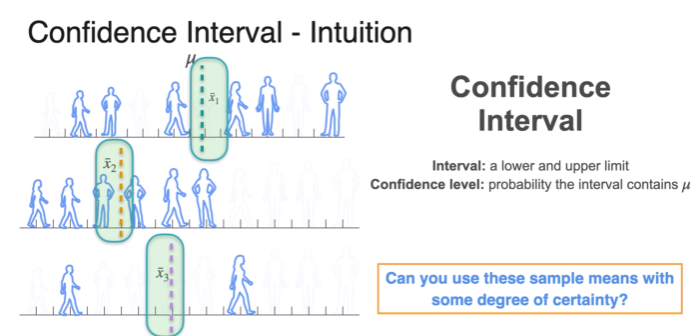
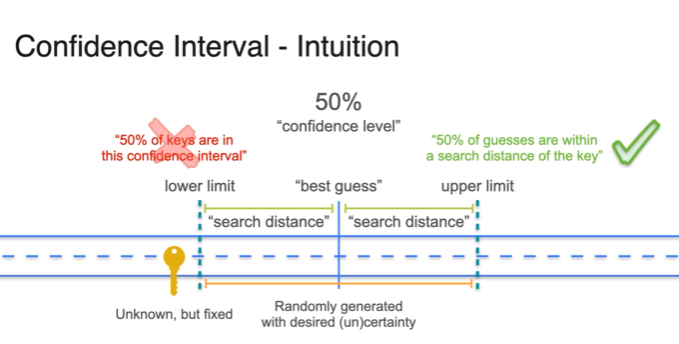
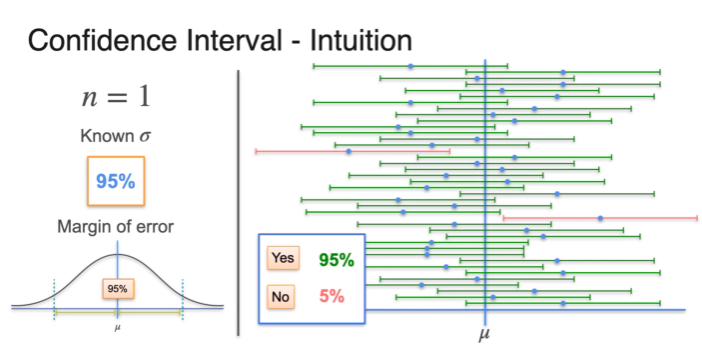
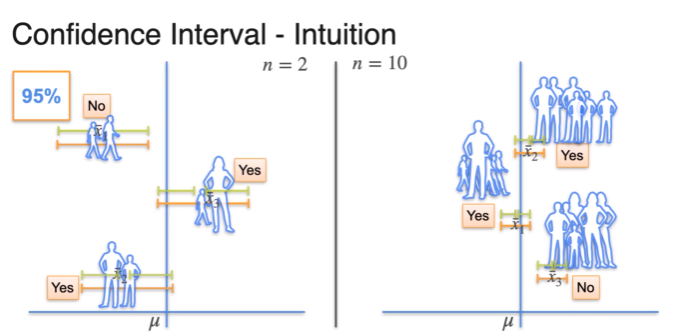
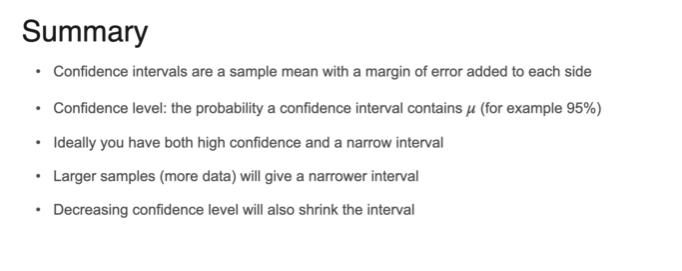
Confidence Intervals - Overview
-
신뢰구간 50% 50% key가 in the intervals
-
True value is the key
- he drew the but we never know that
- we will generate confidence intervals
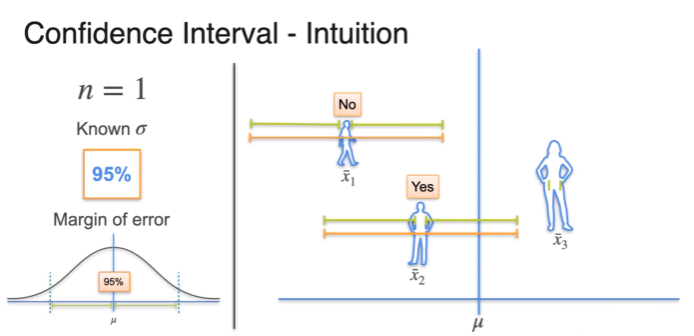
Confidence Intervals - Changing the Interval
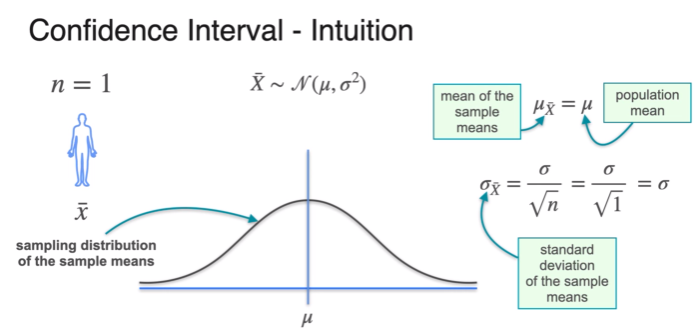
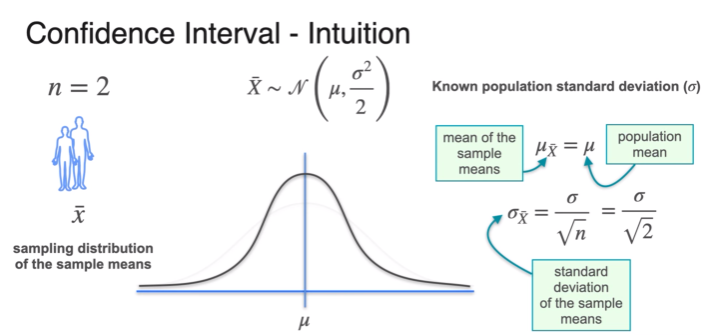
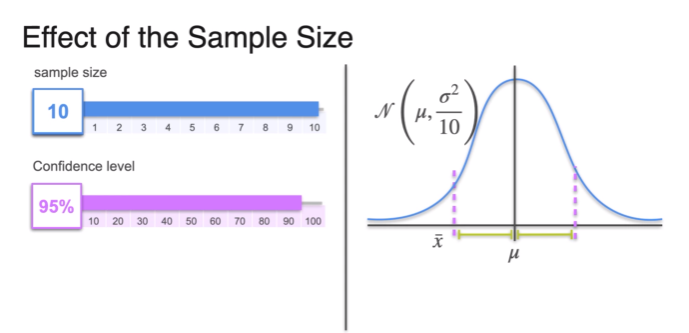
- standard deviation depends on sample size
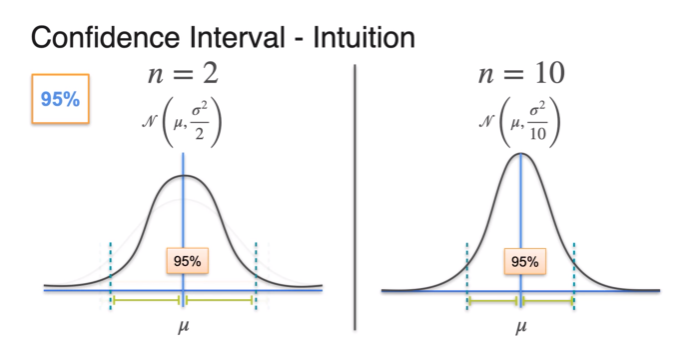
- more sample, smaller margin of error
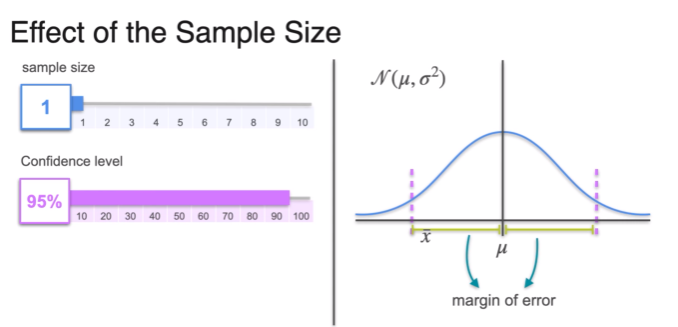
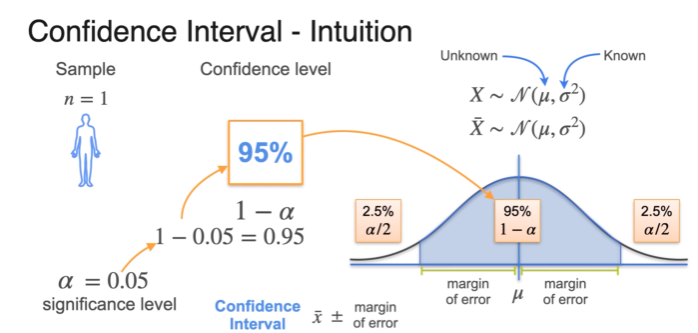
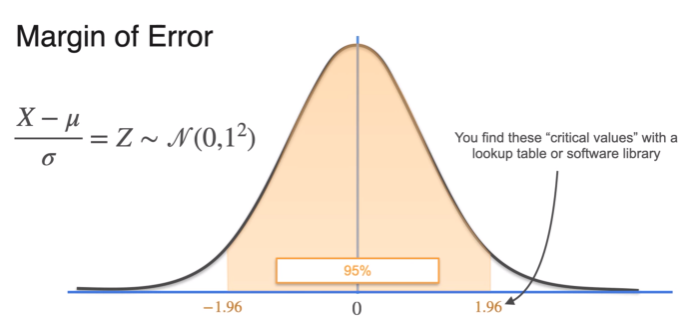
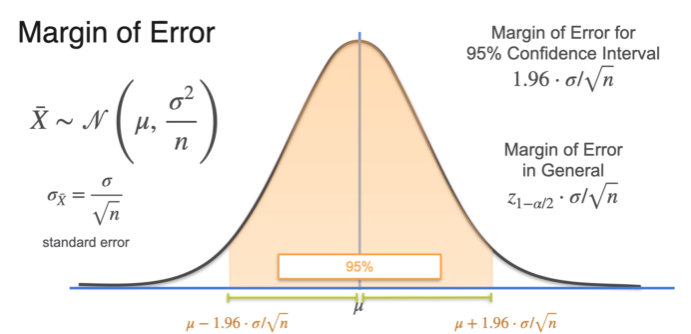
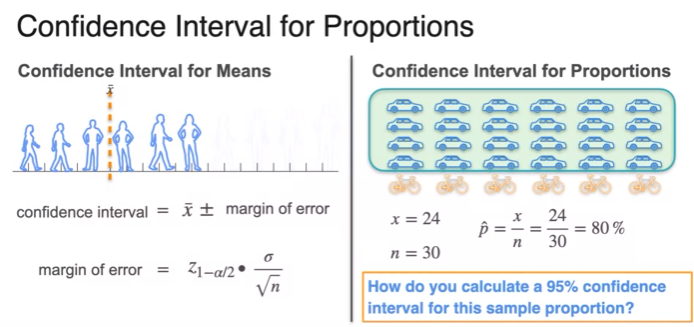
Confidence Intervals - Margin of Error
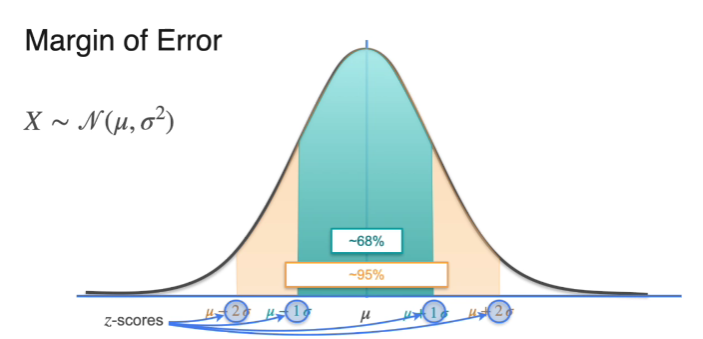
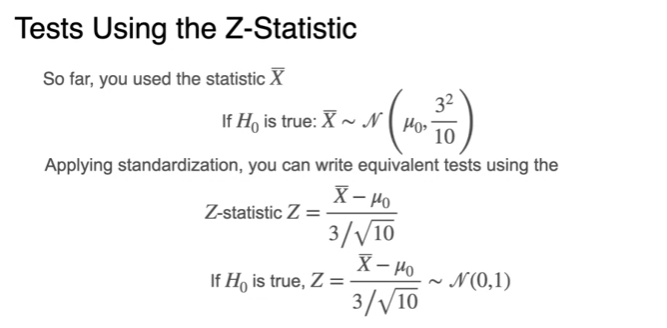
- z-score; Z distribution
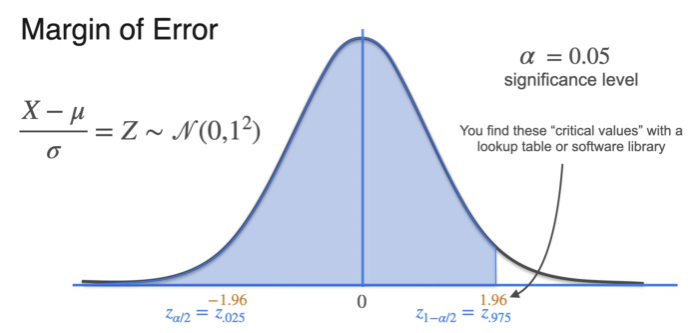
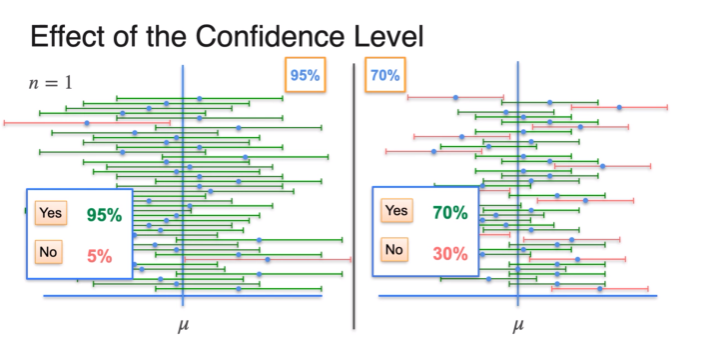
- confidence interval at 90%
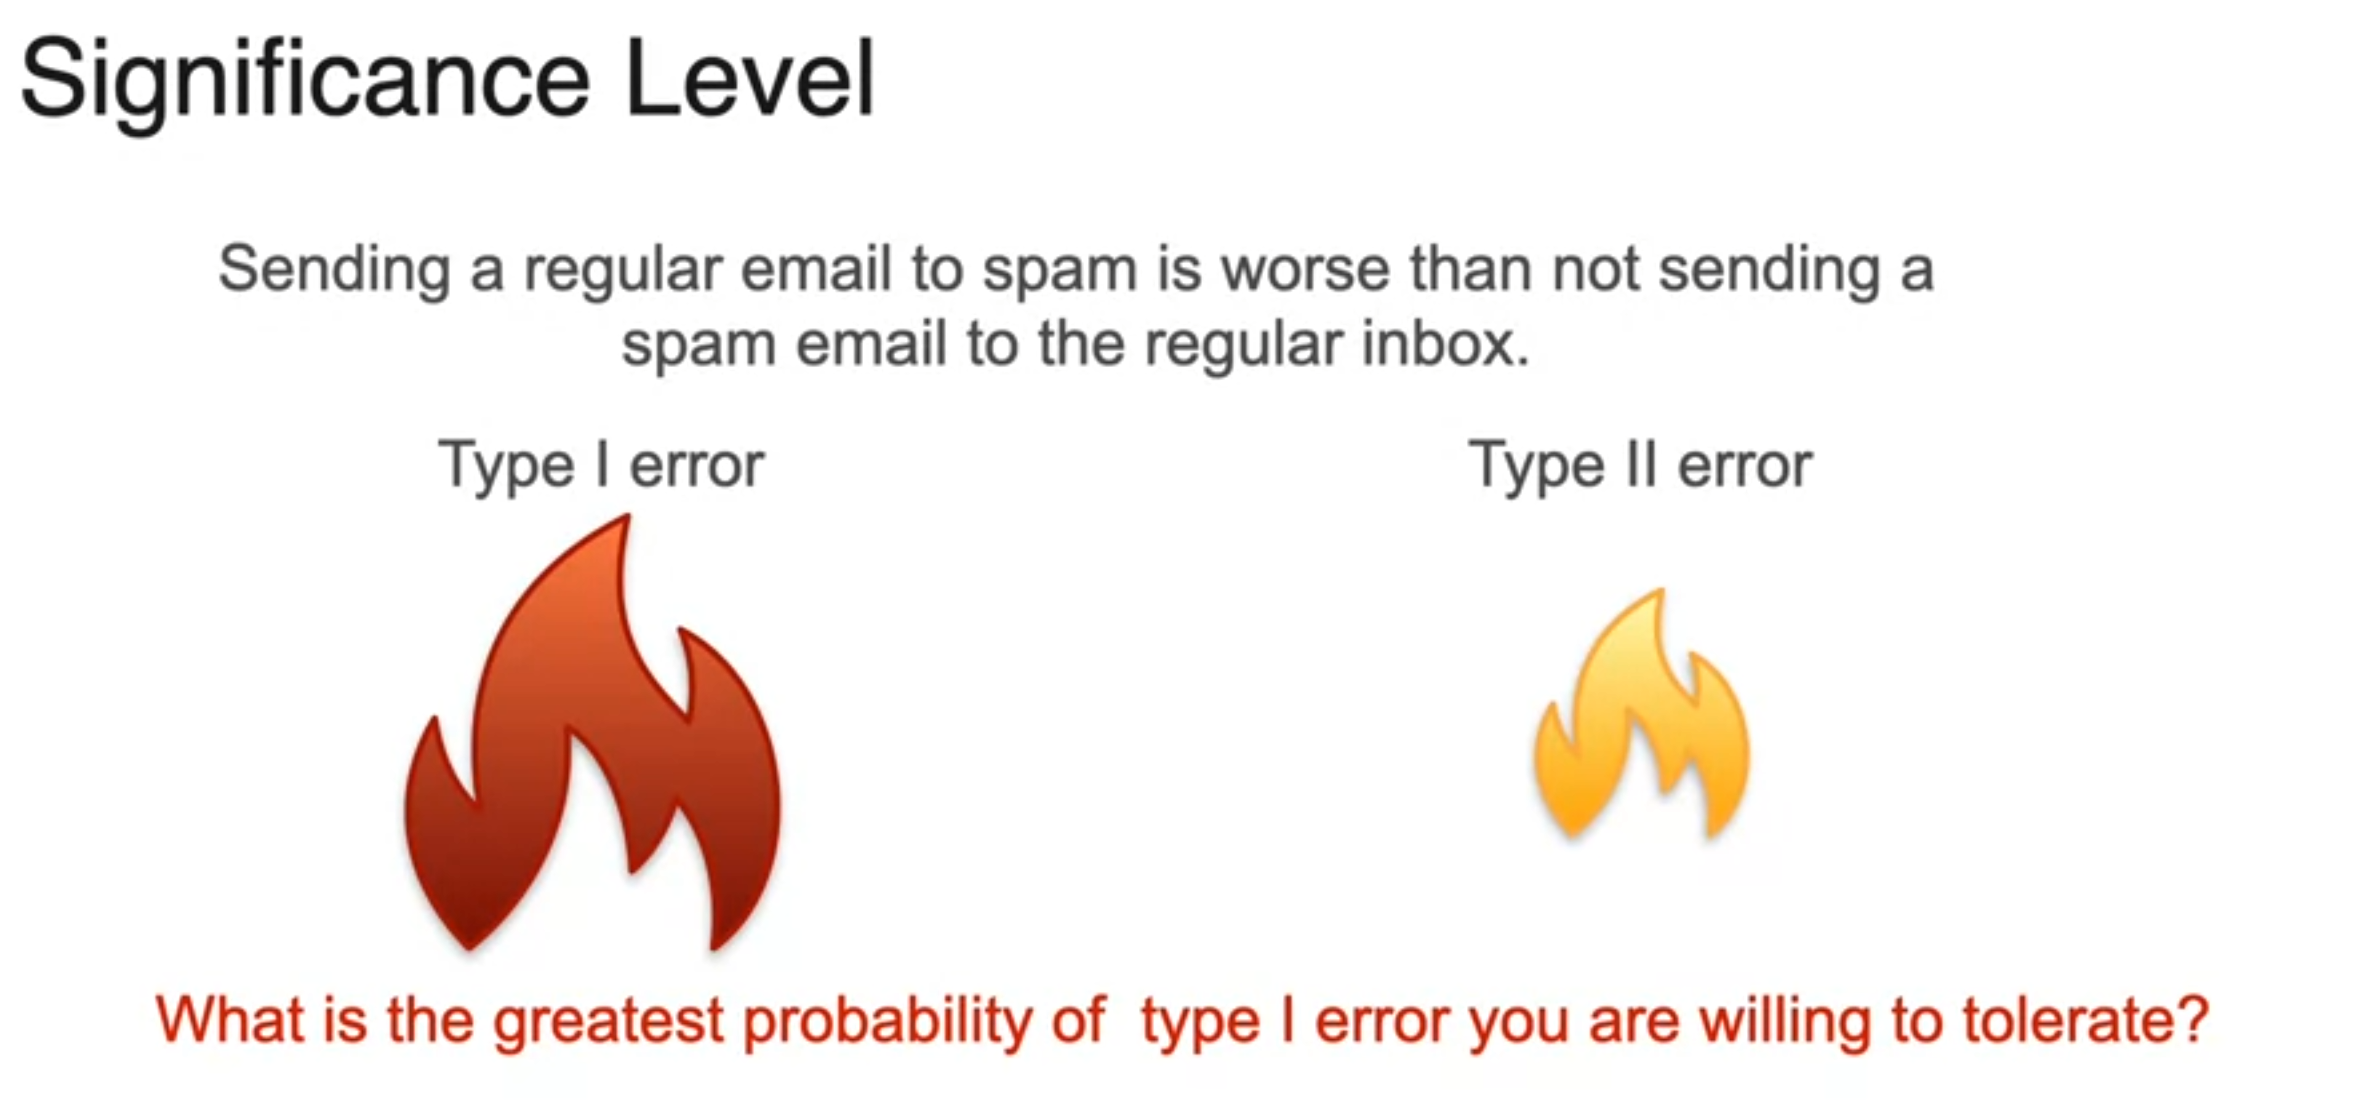
- significance level = 0.1
- between and
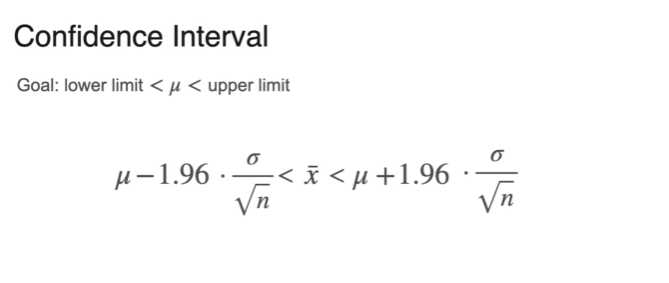
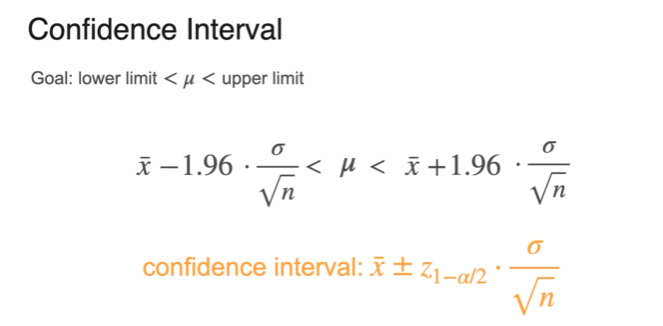
Confidence Intervals - Calculation Steps
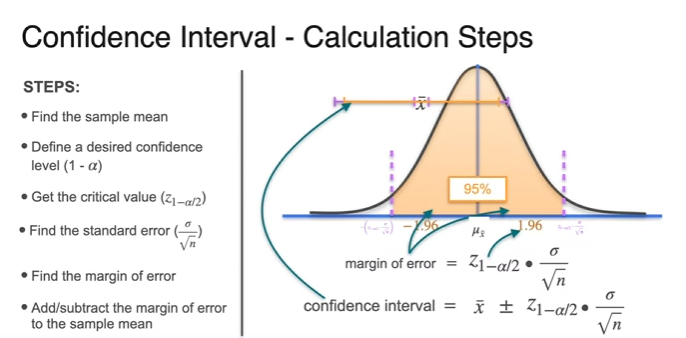
-
confidence interval =
-
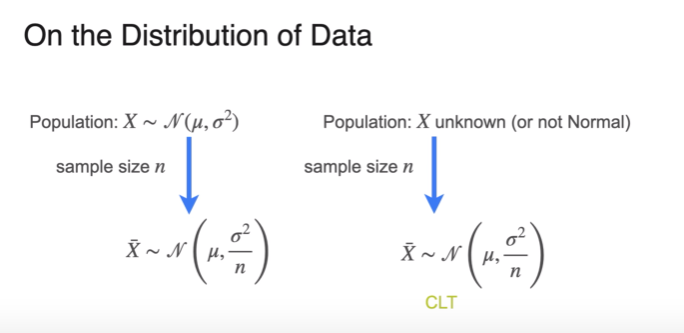
Assumptions
- simple random sample
- sample size > 30 or popuilation is approximately normal
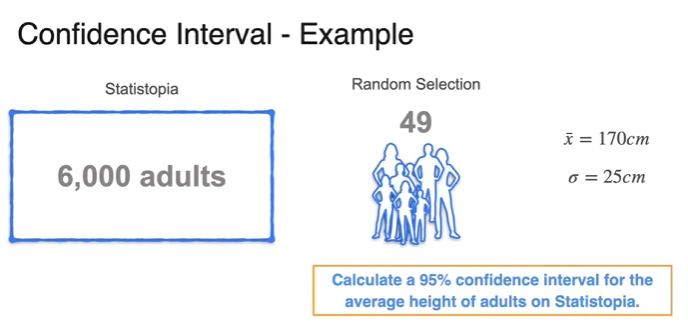
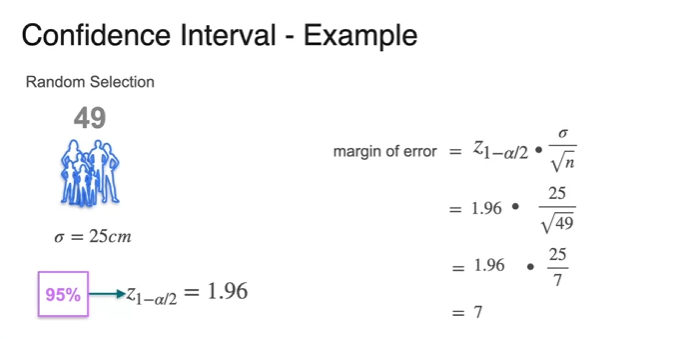
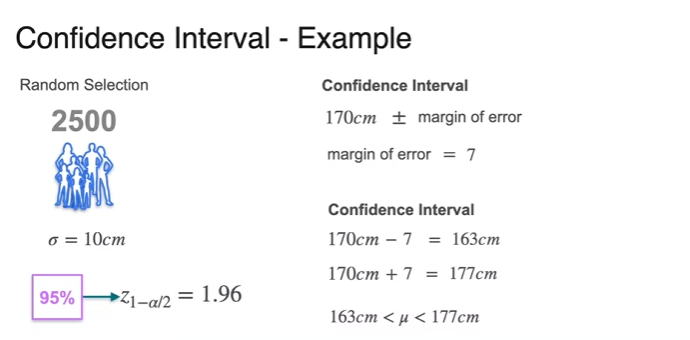
Confidence Intervals - Example
Calculating Sample Size
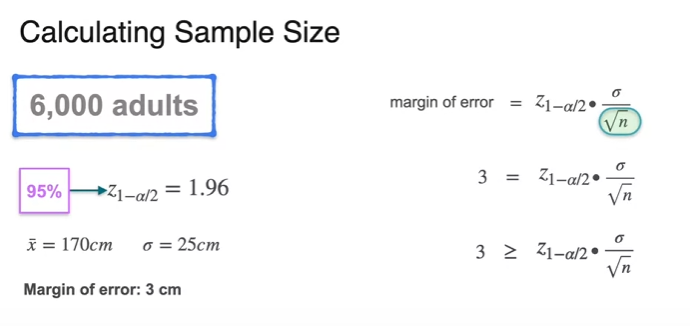
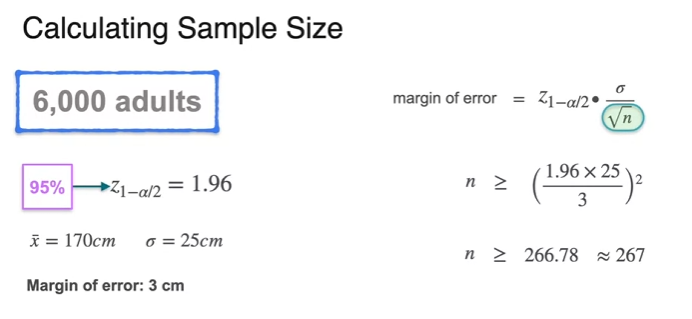
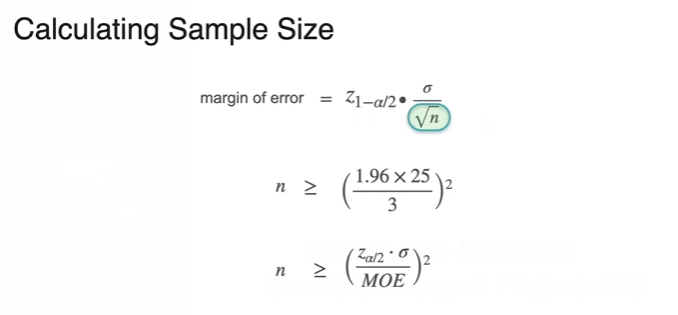
- 역산inverse operation
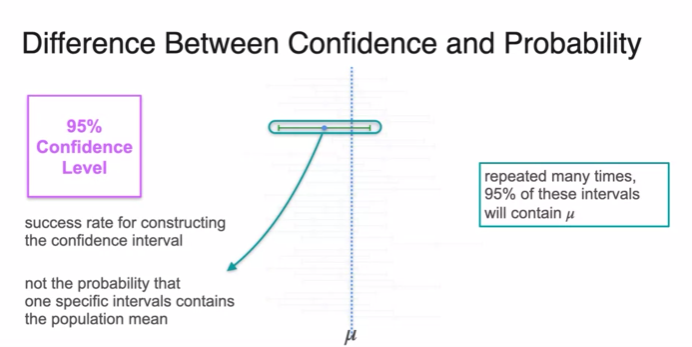
Difference Between Confidence and Probability
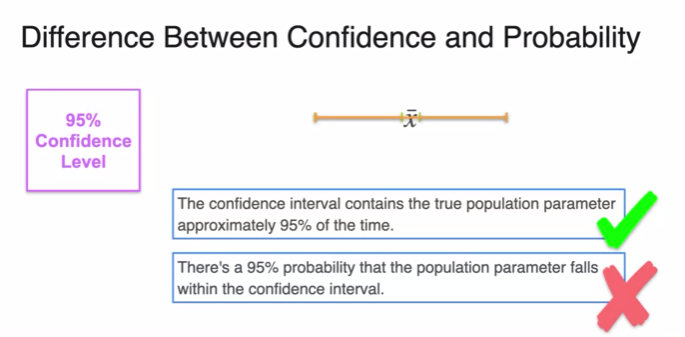
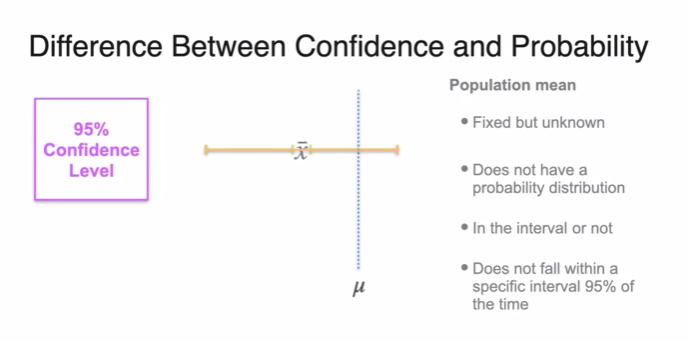
- but sample mean
Unknown Standard Deviation
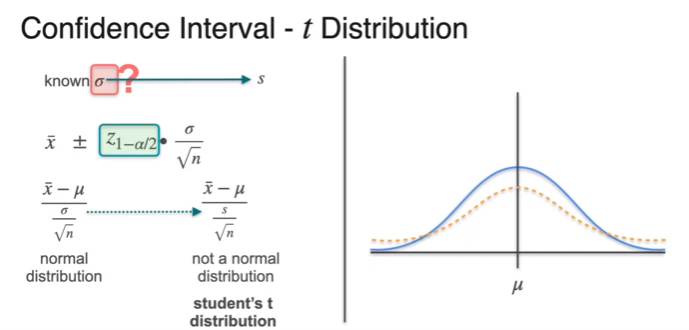
- as we don't know the real
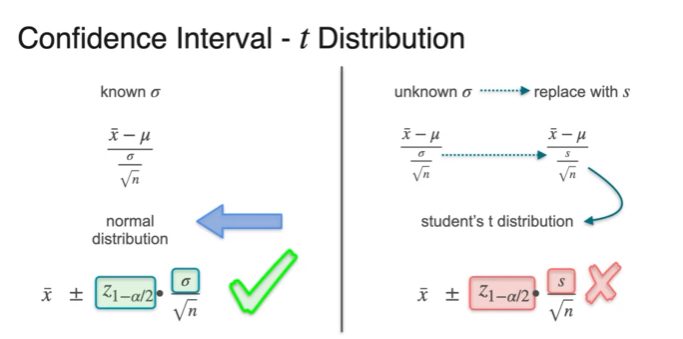
- it's wrong because it depends on normal distribution
- scaling issue
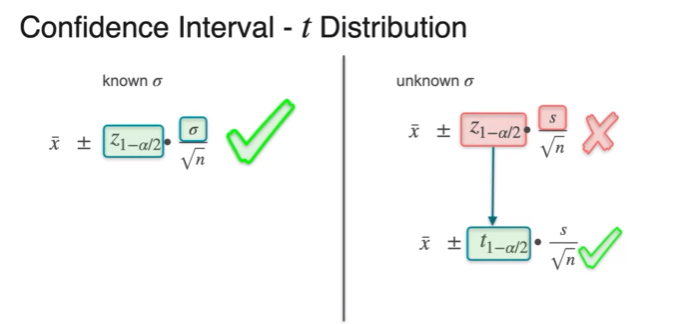
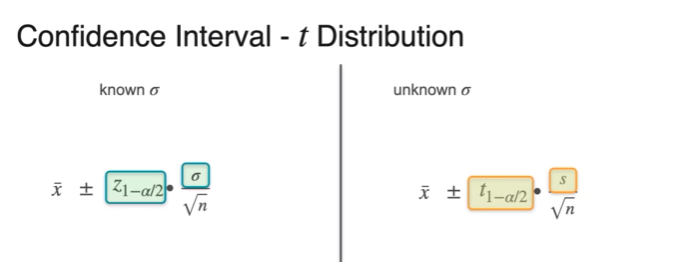
- use student instead of and instead of
- the more sample you use getting closer to also sample distribution and normal distribution is
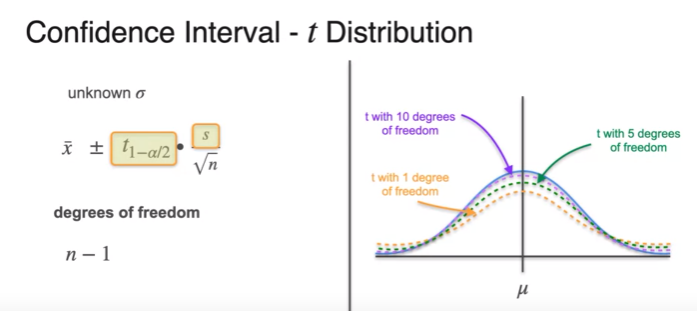
- degrees of freedom
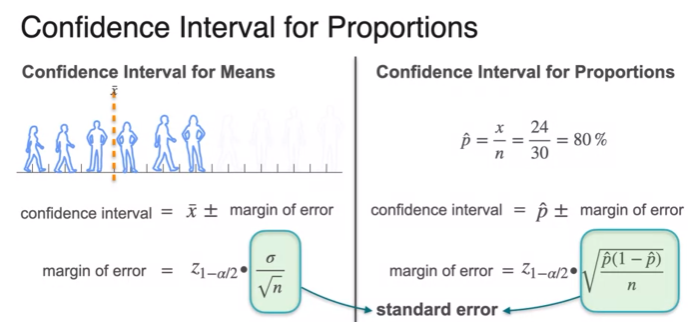
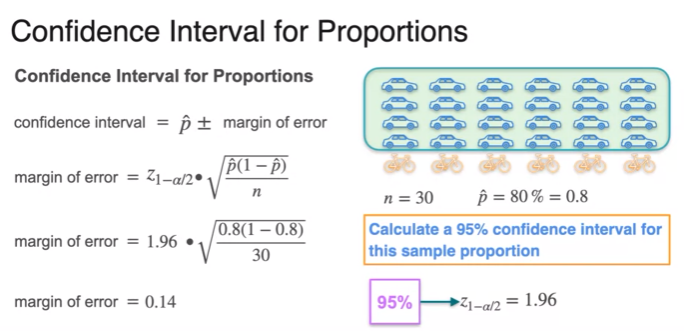
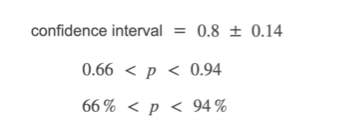
Confidence Intervals for Proportion
Lesson 2 - Hypothesis Testing
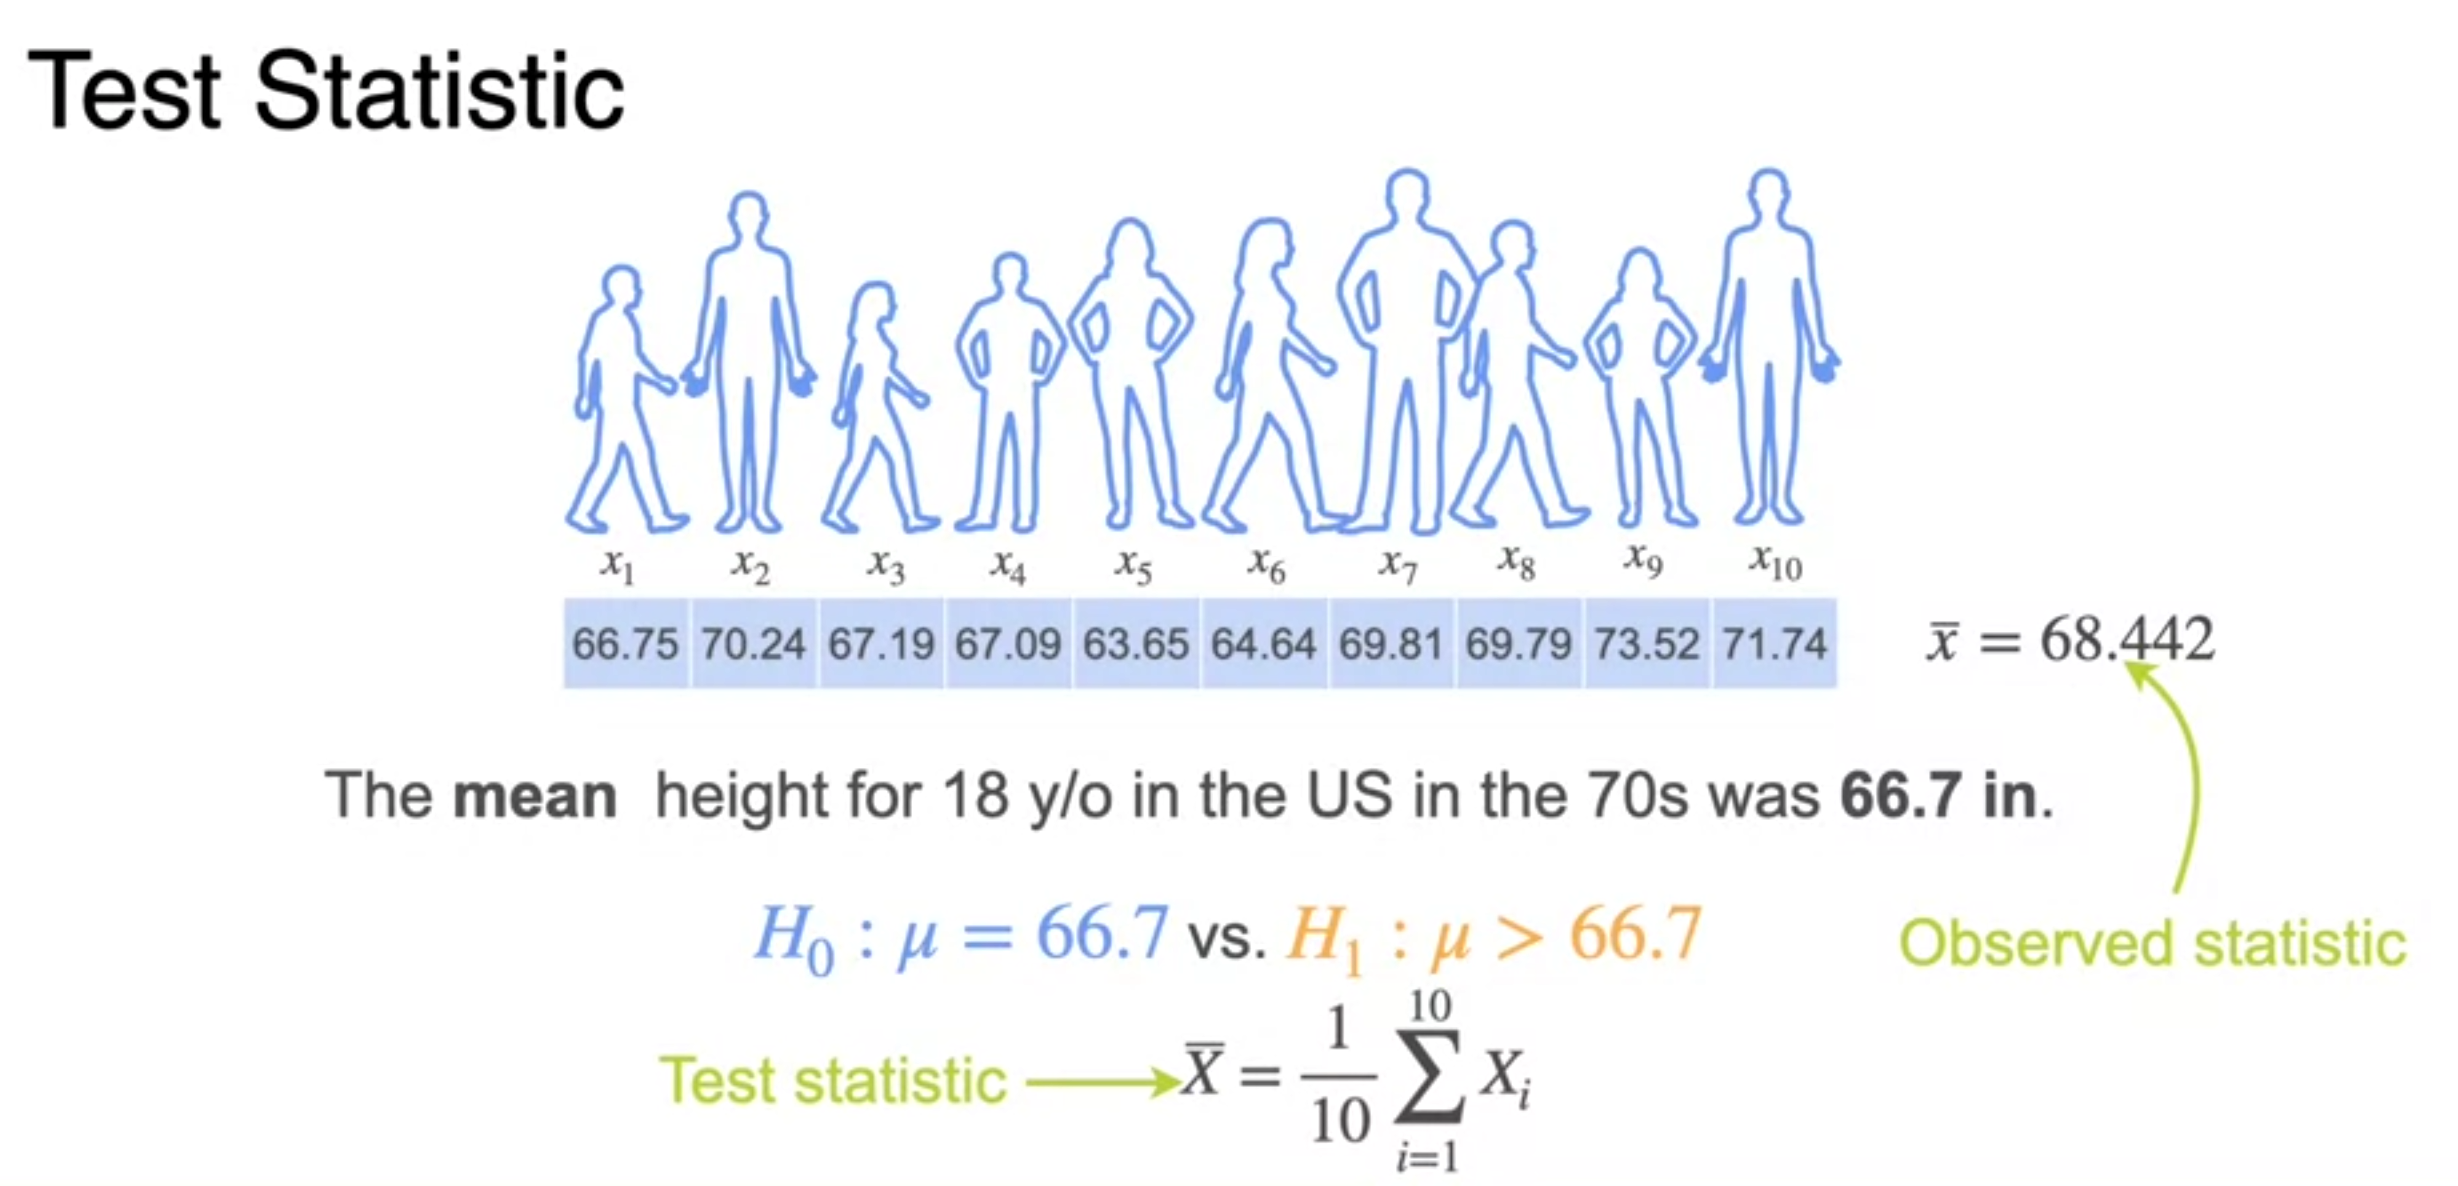
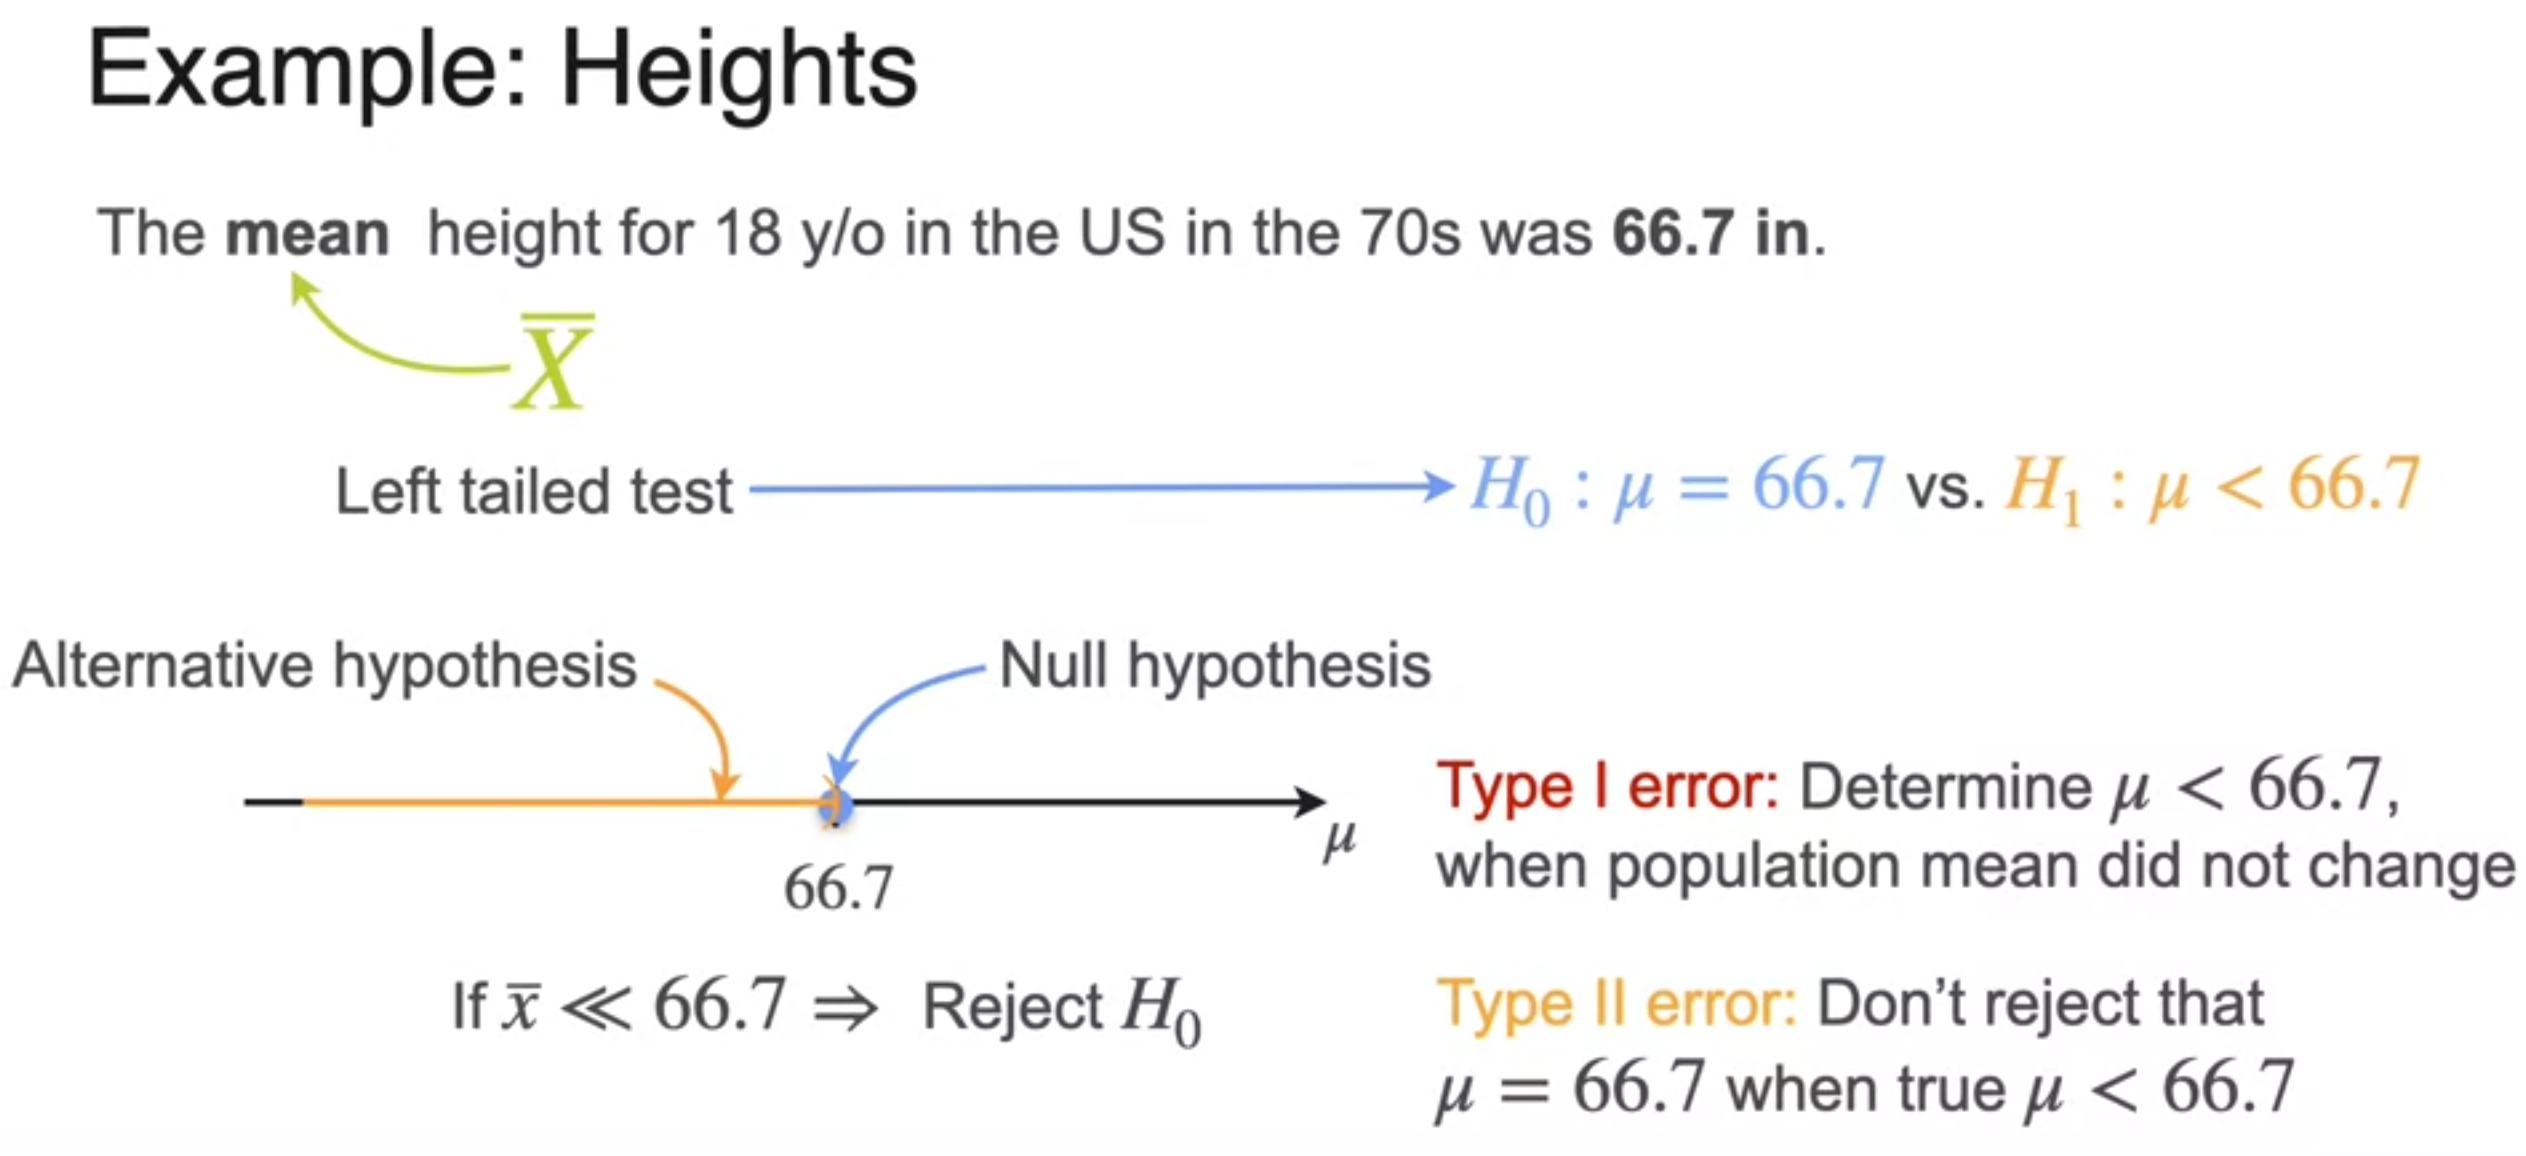
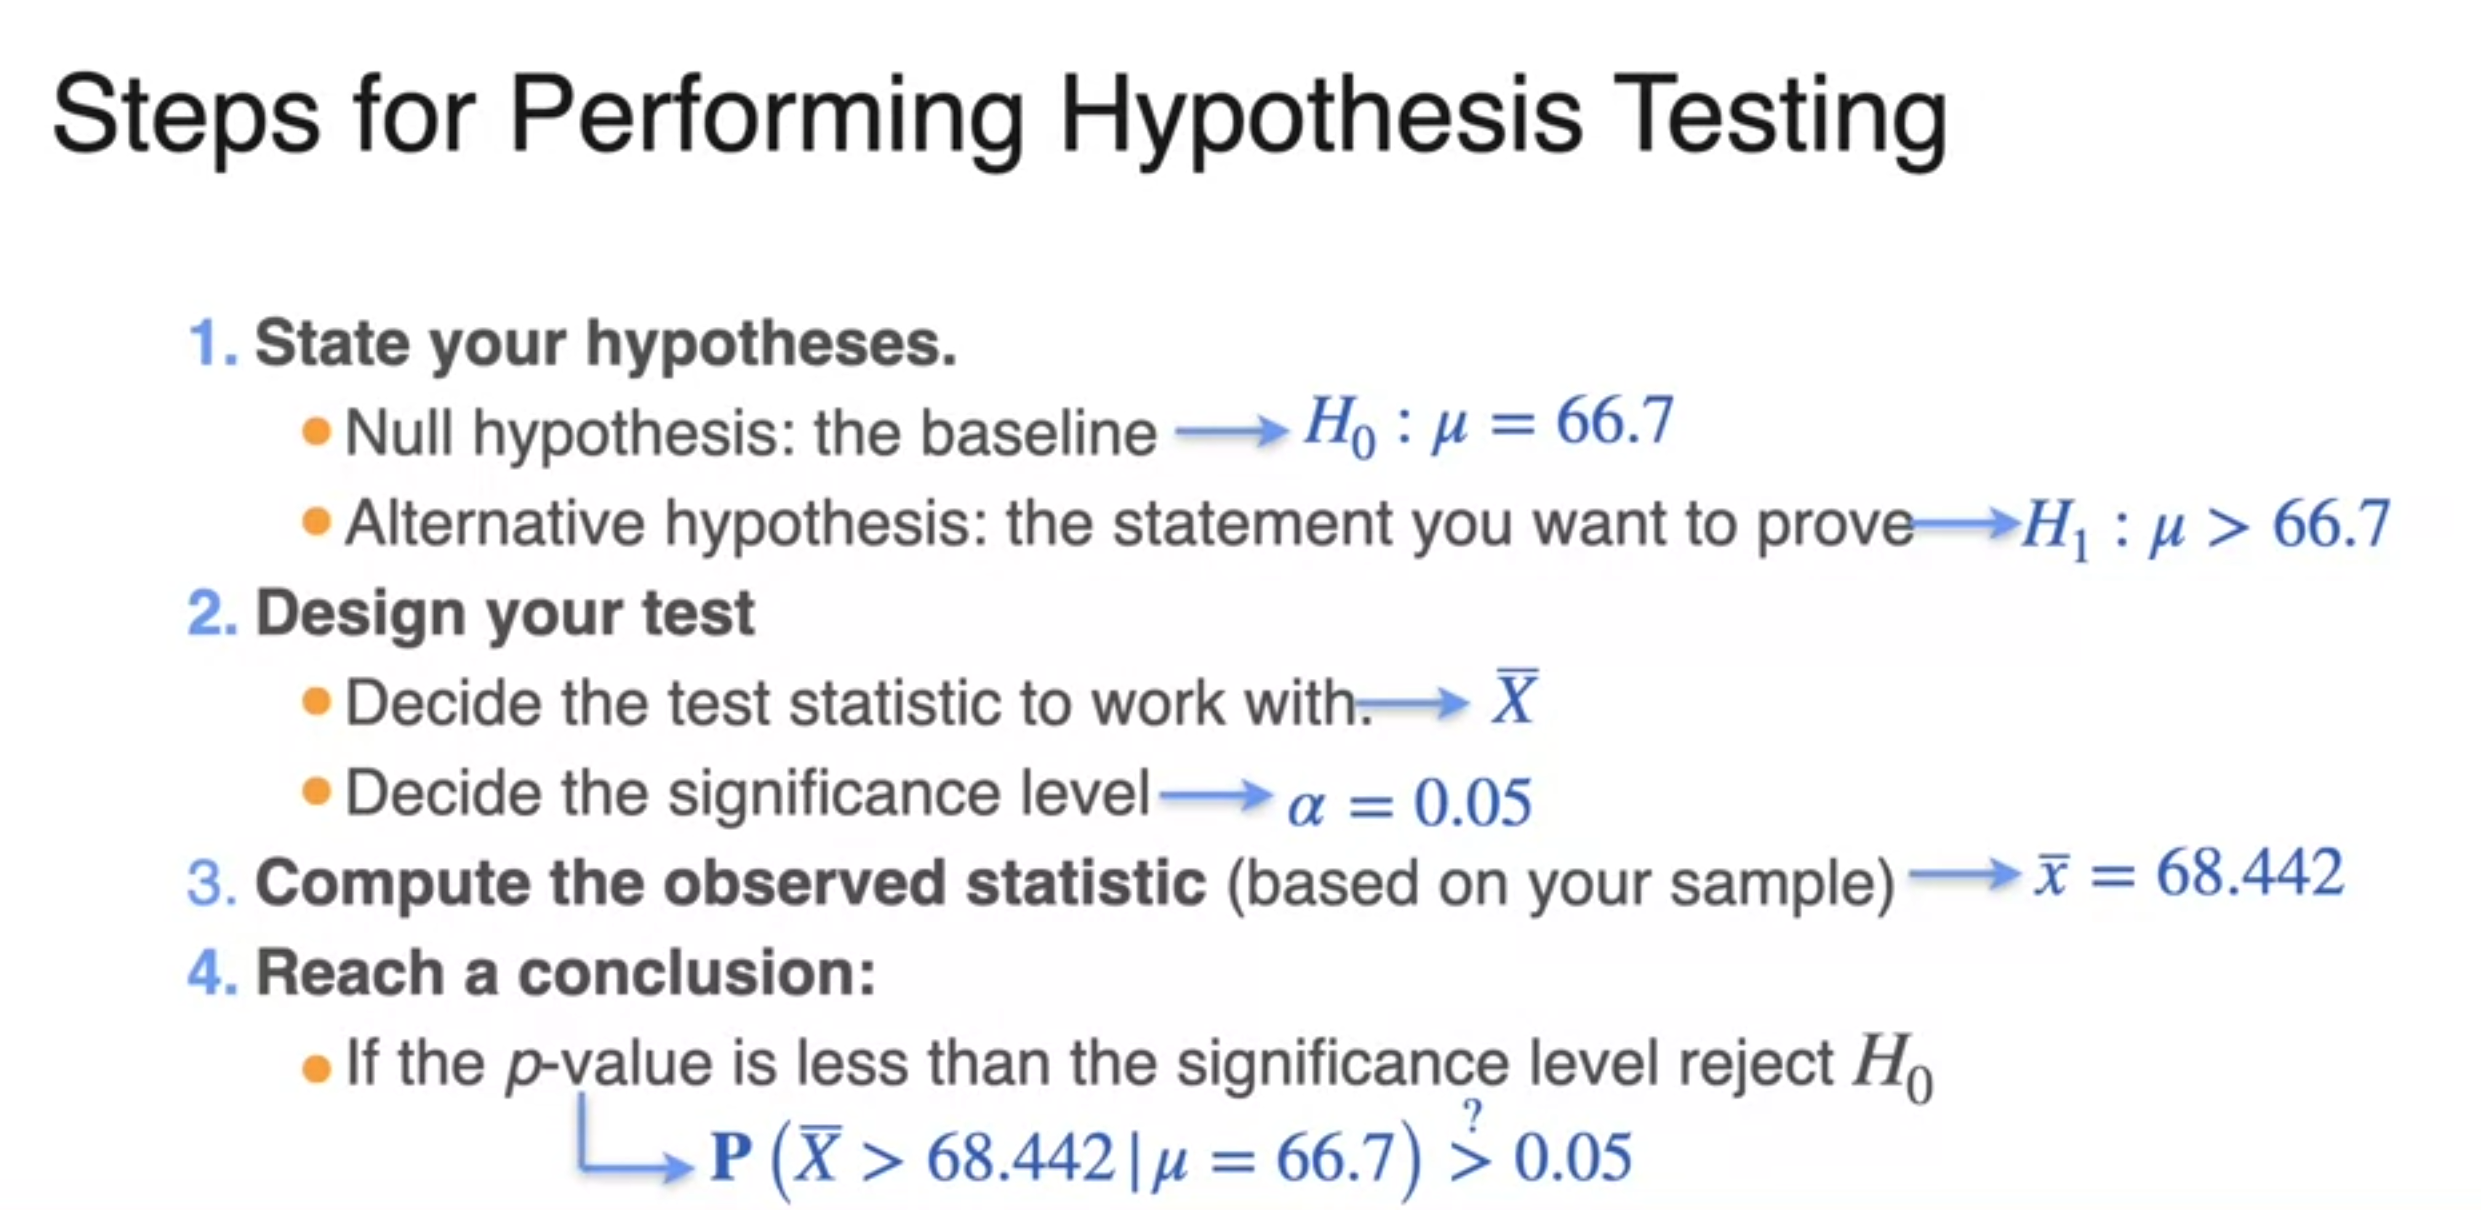
Defining Hypotheses
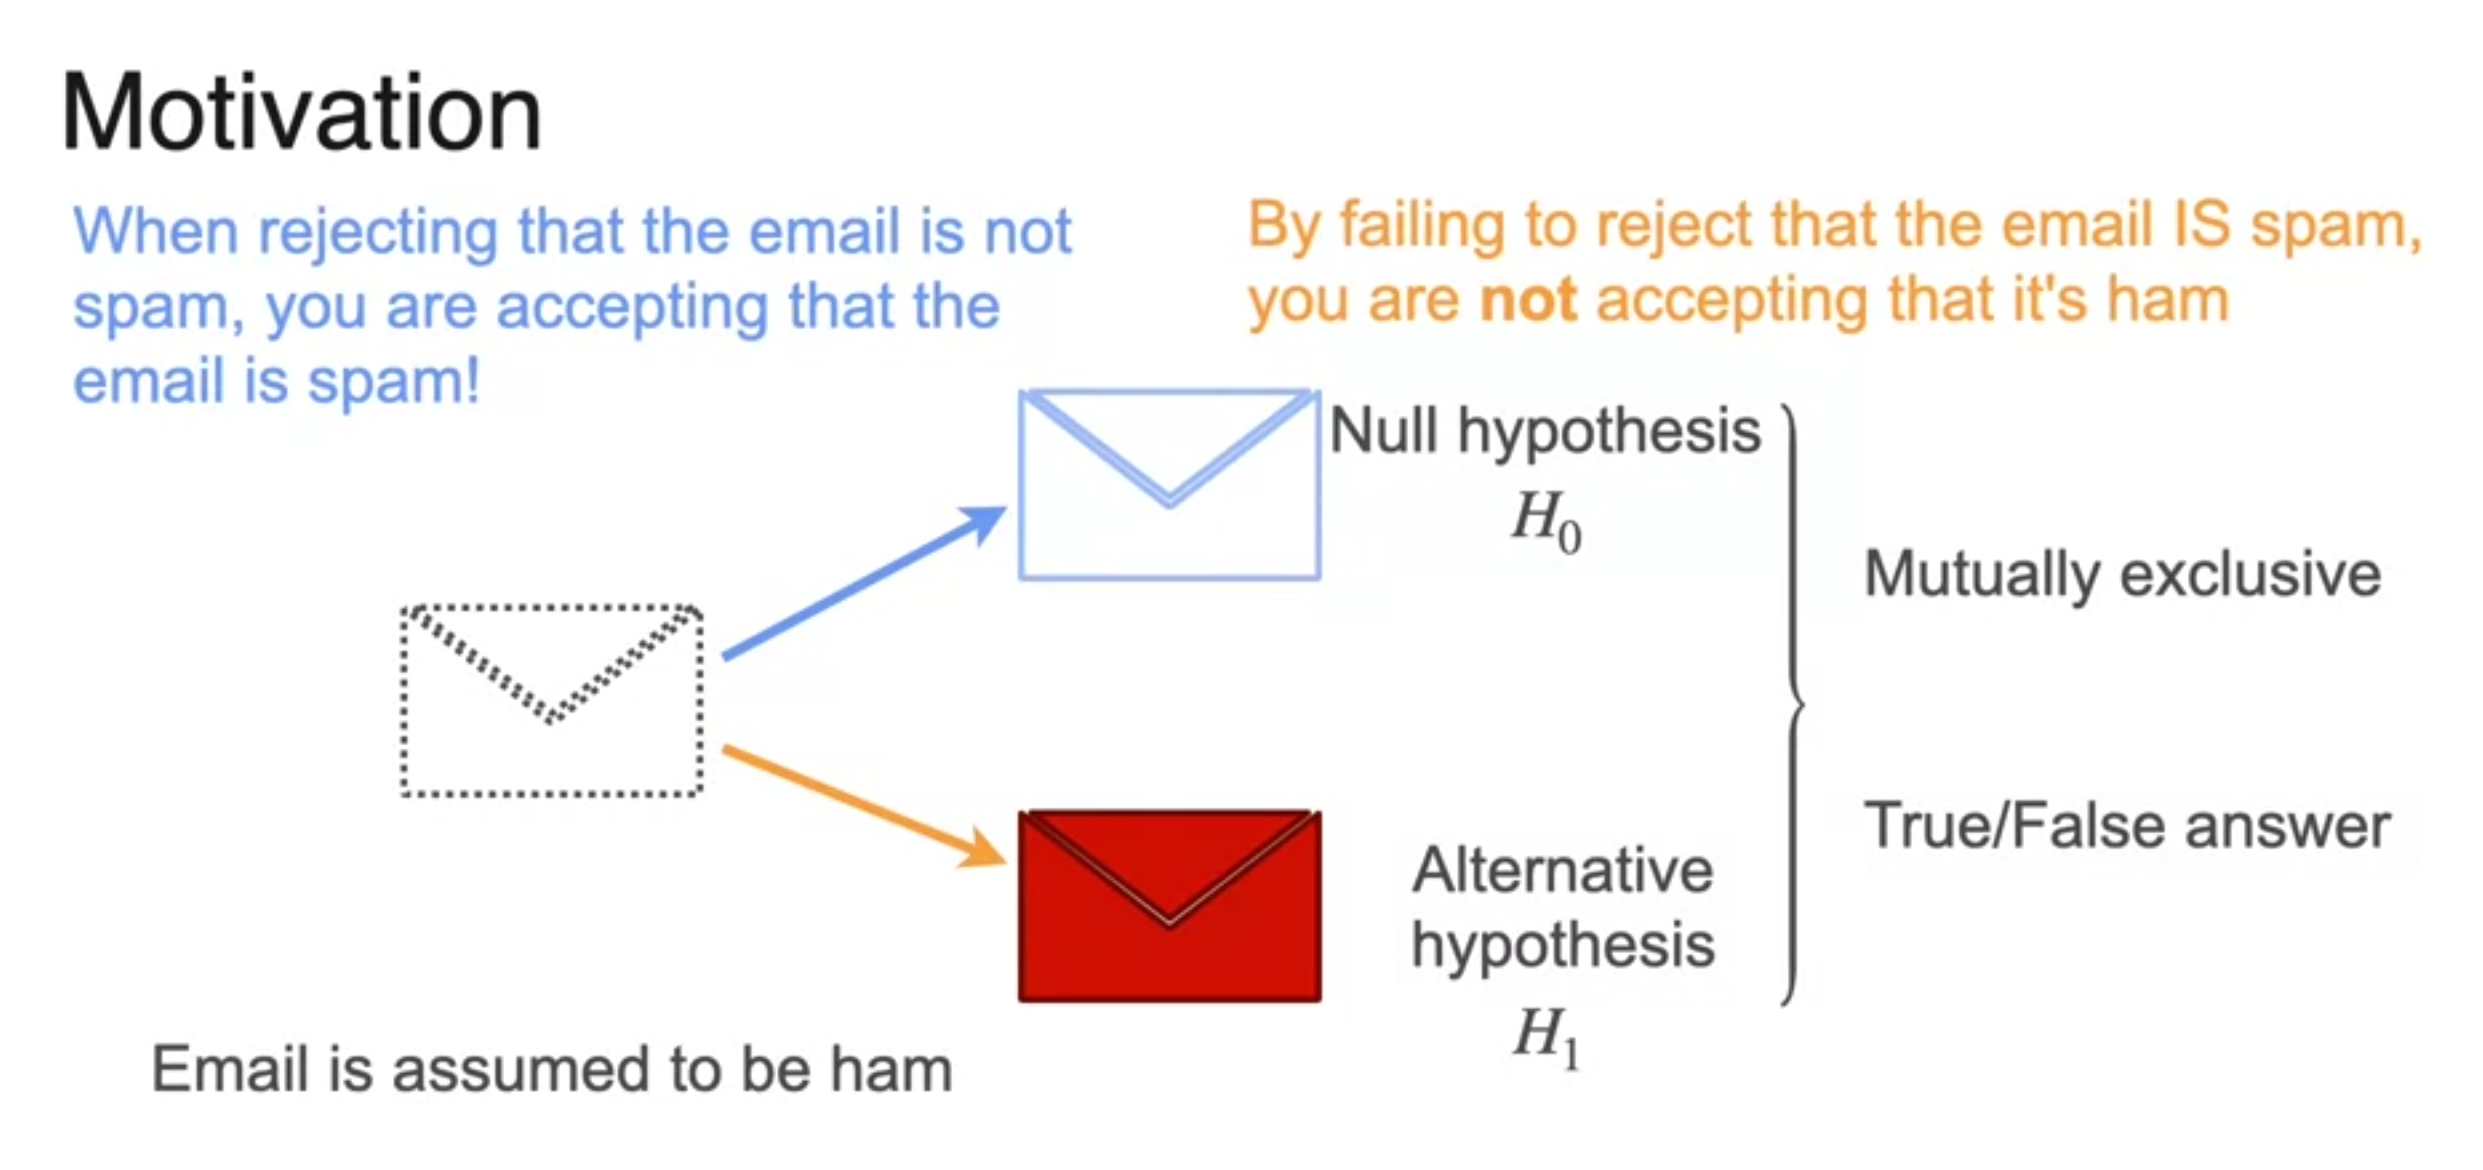
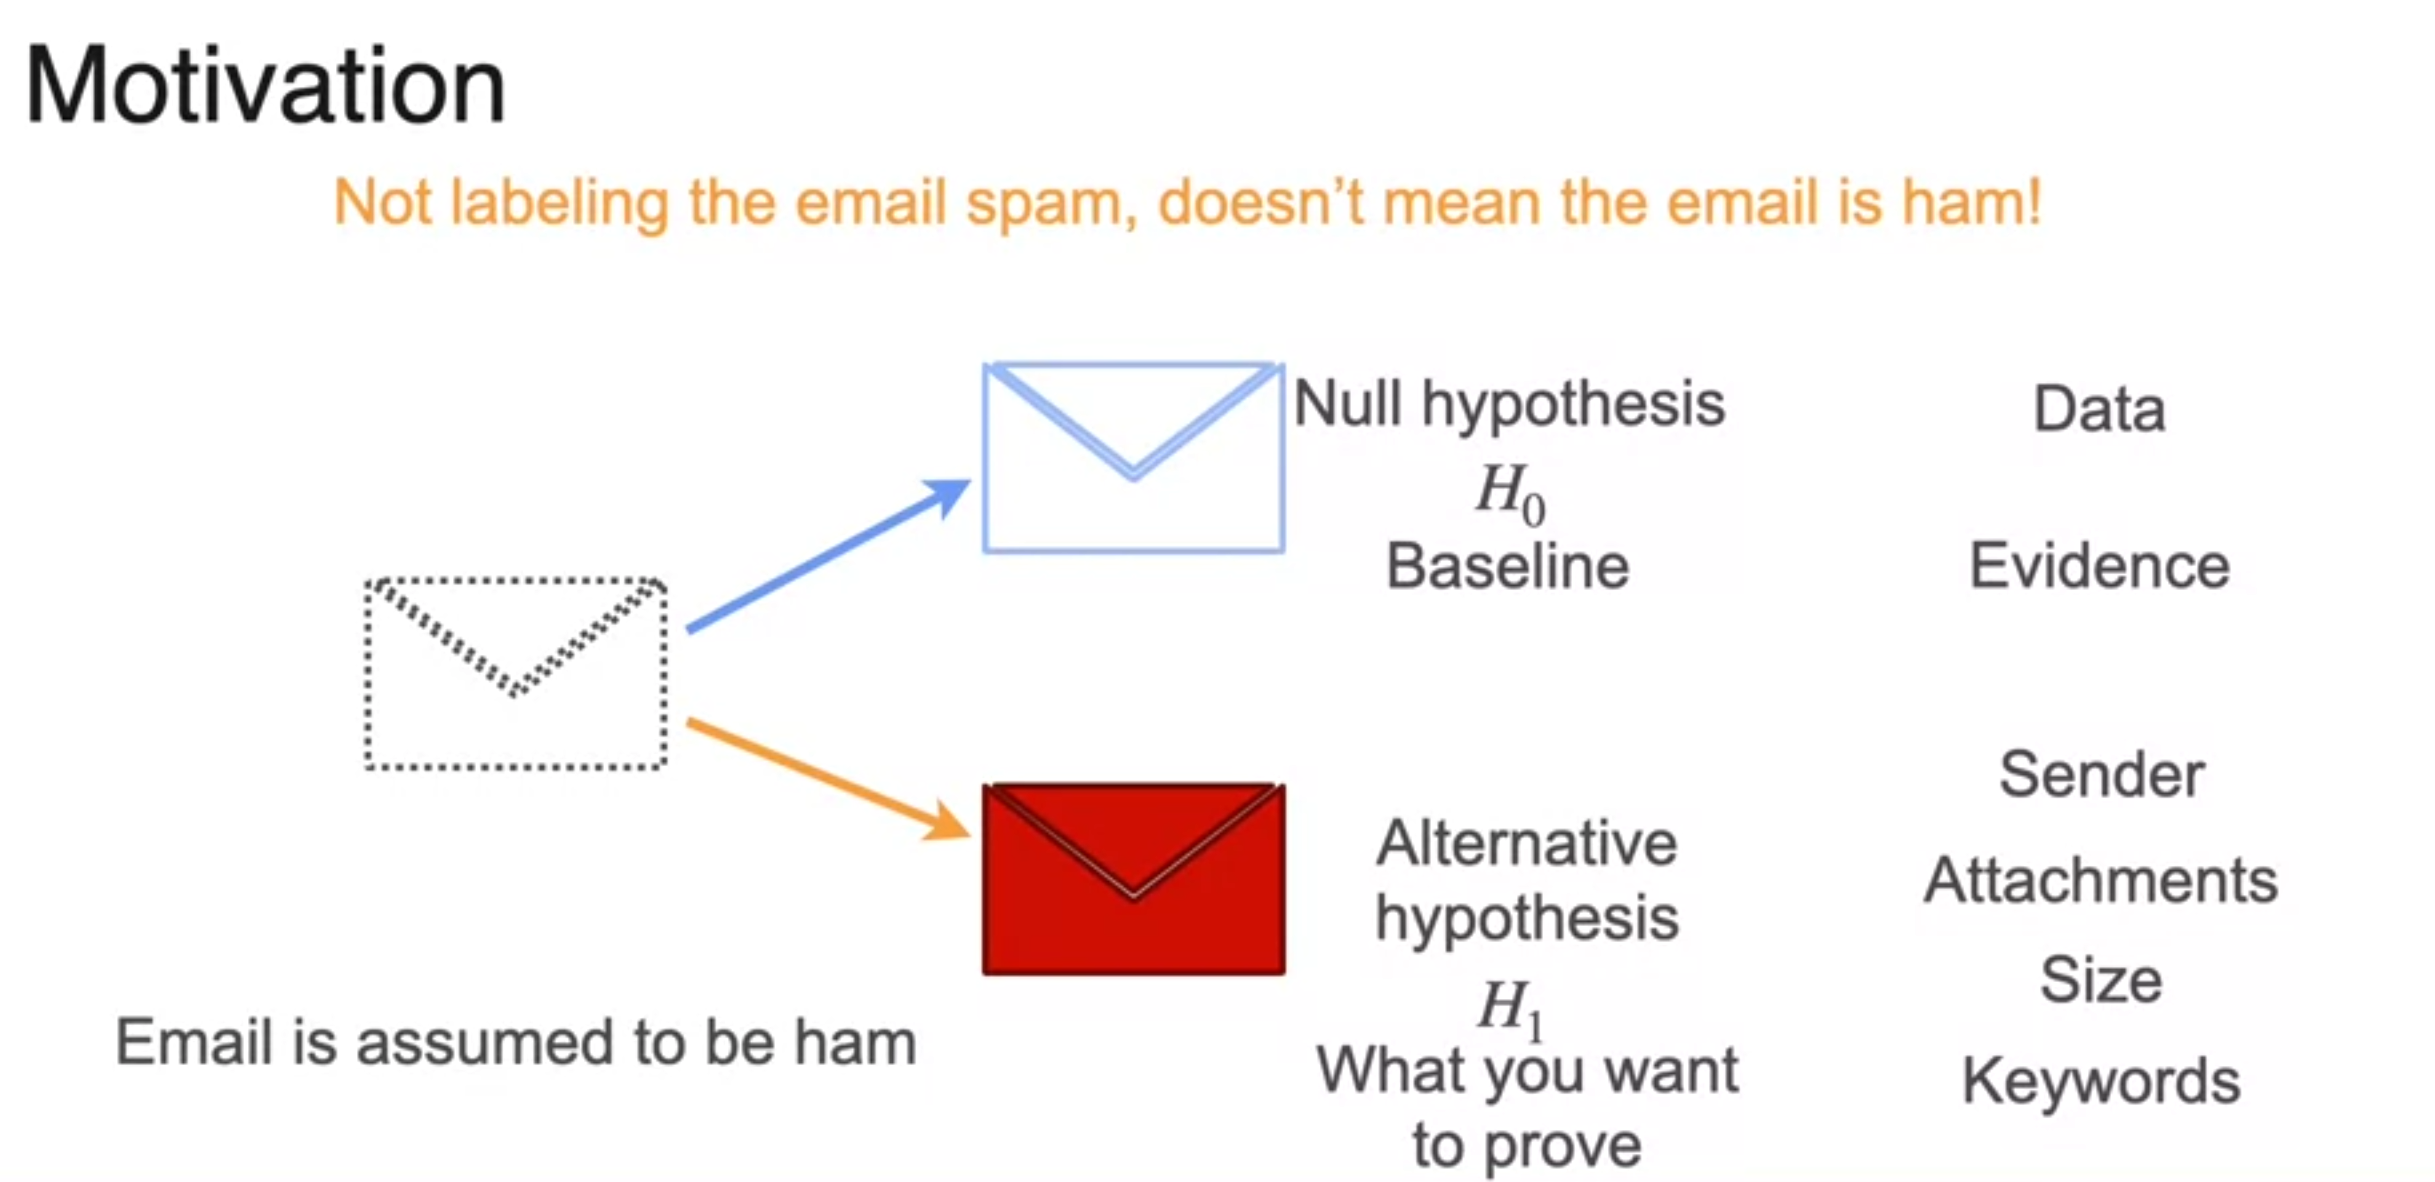
- base assumption - avoid risk
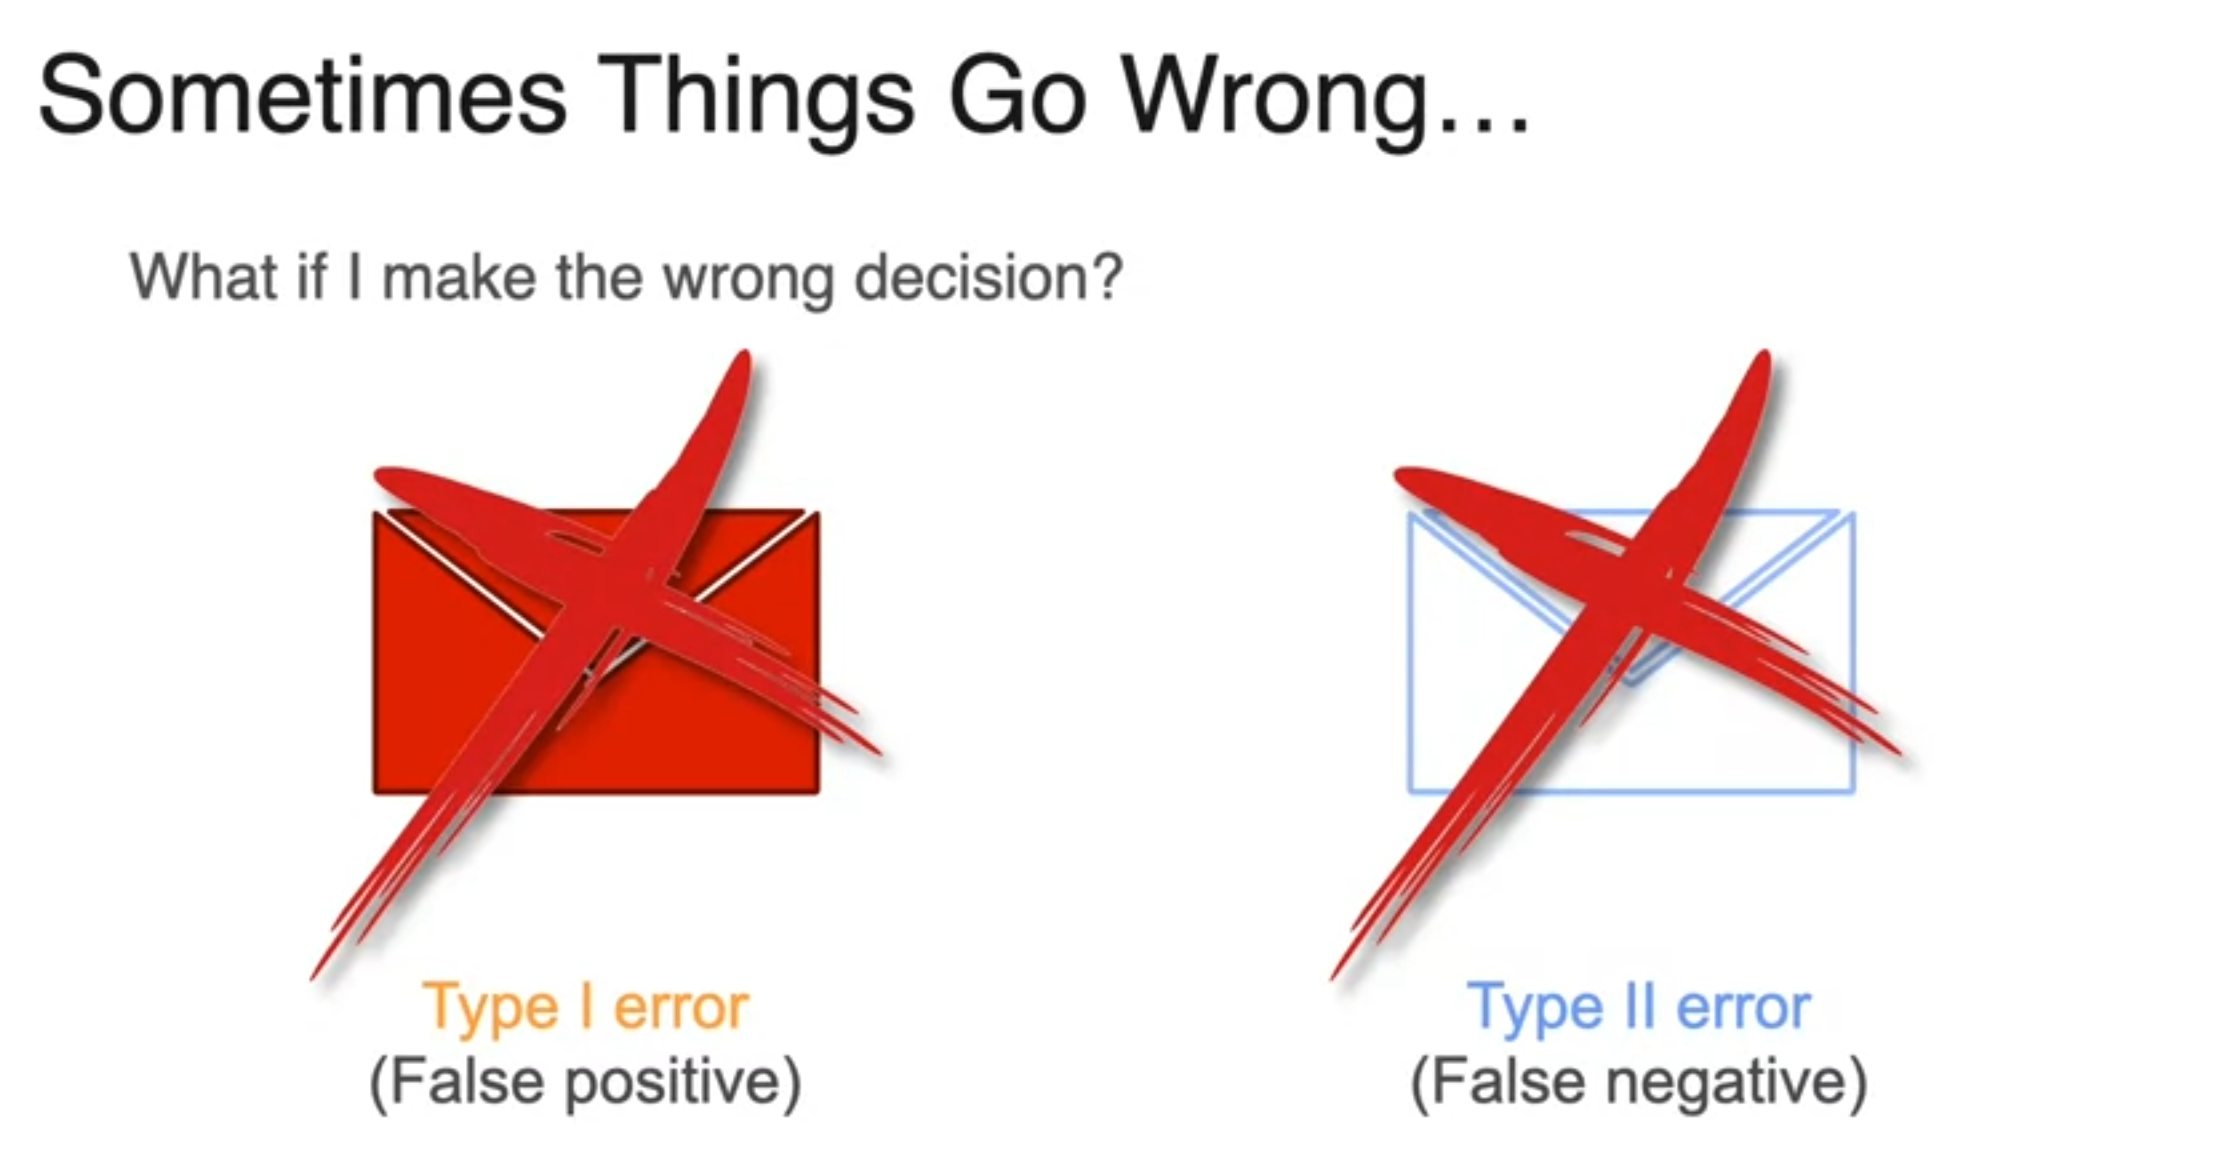
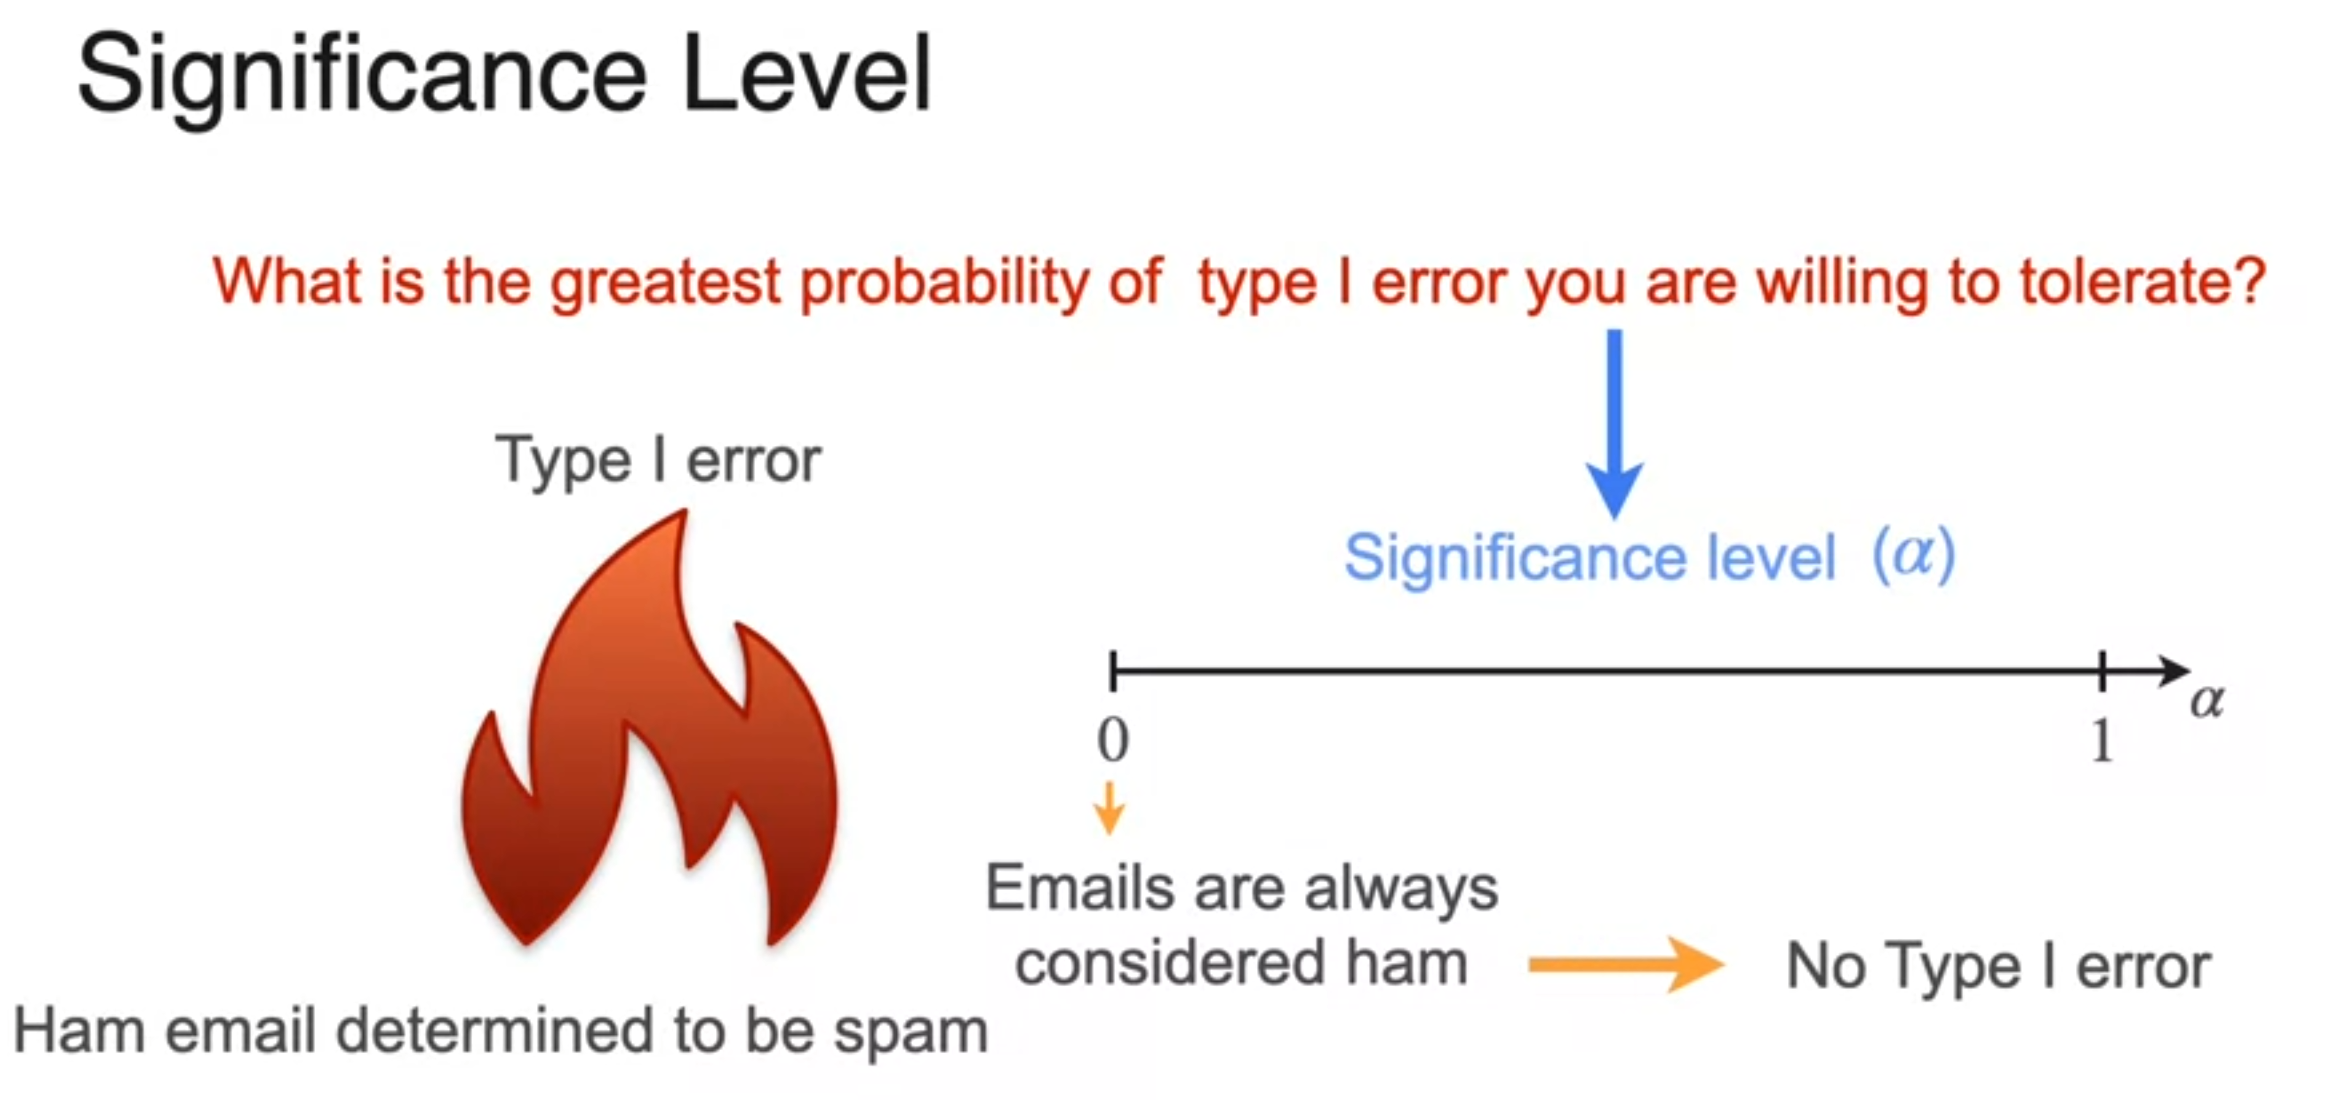
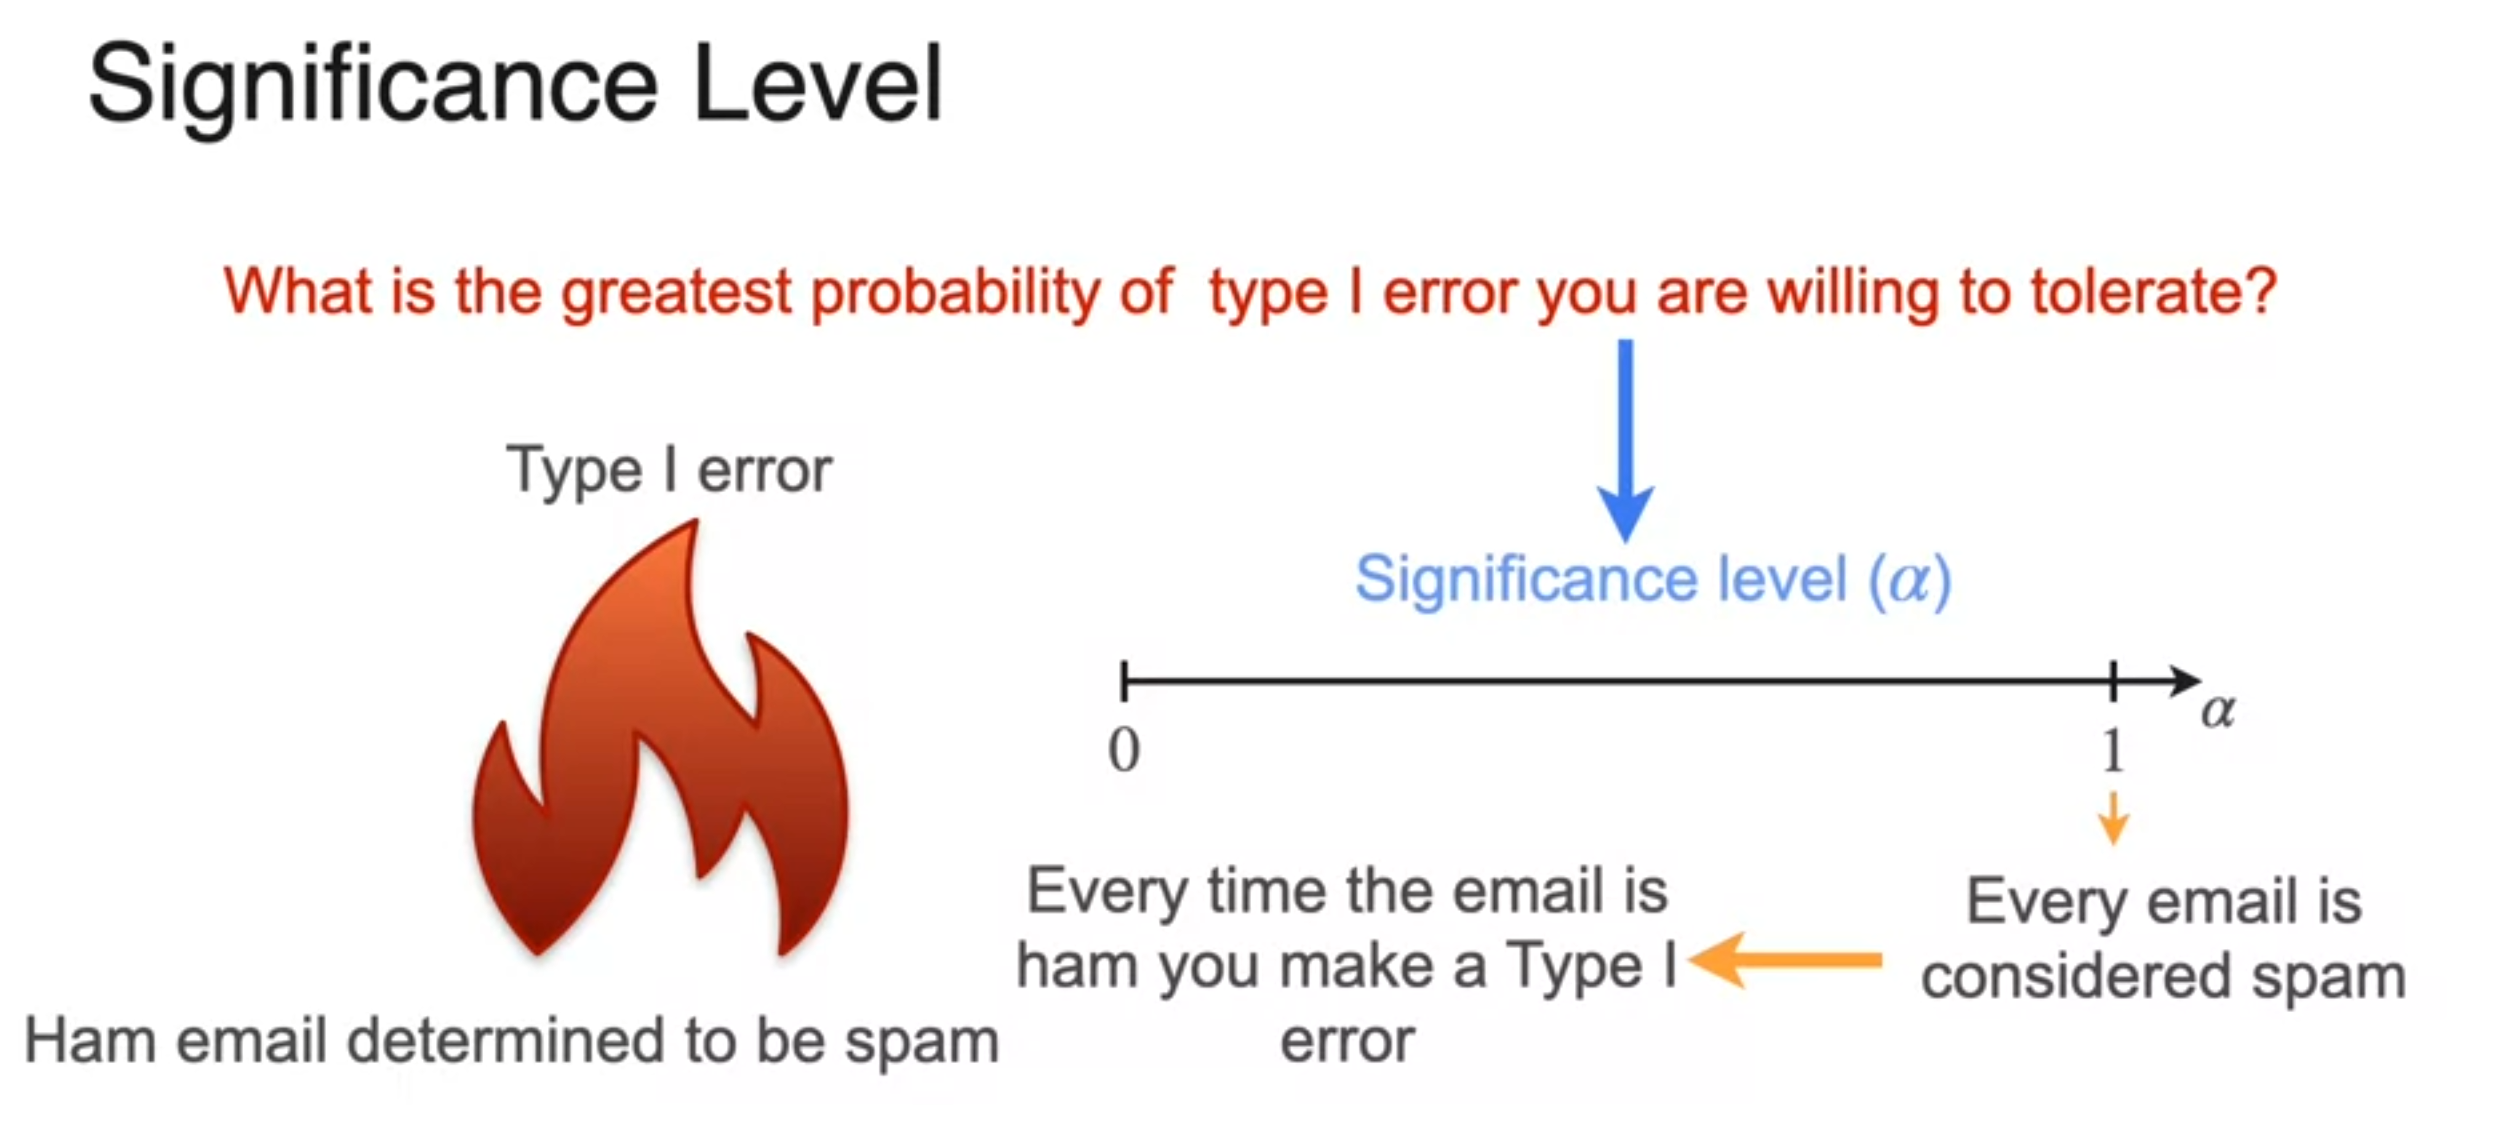
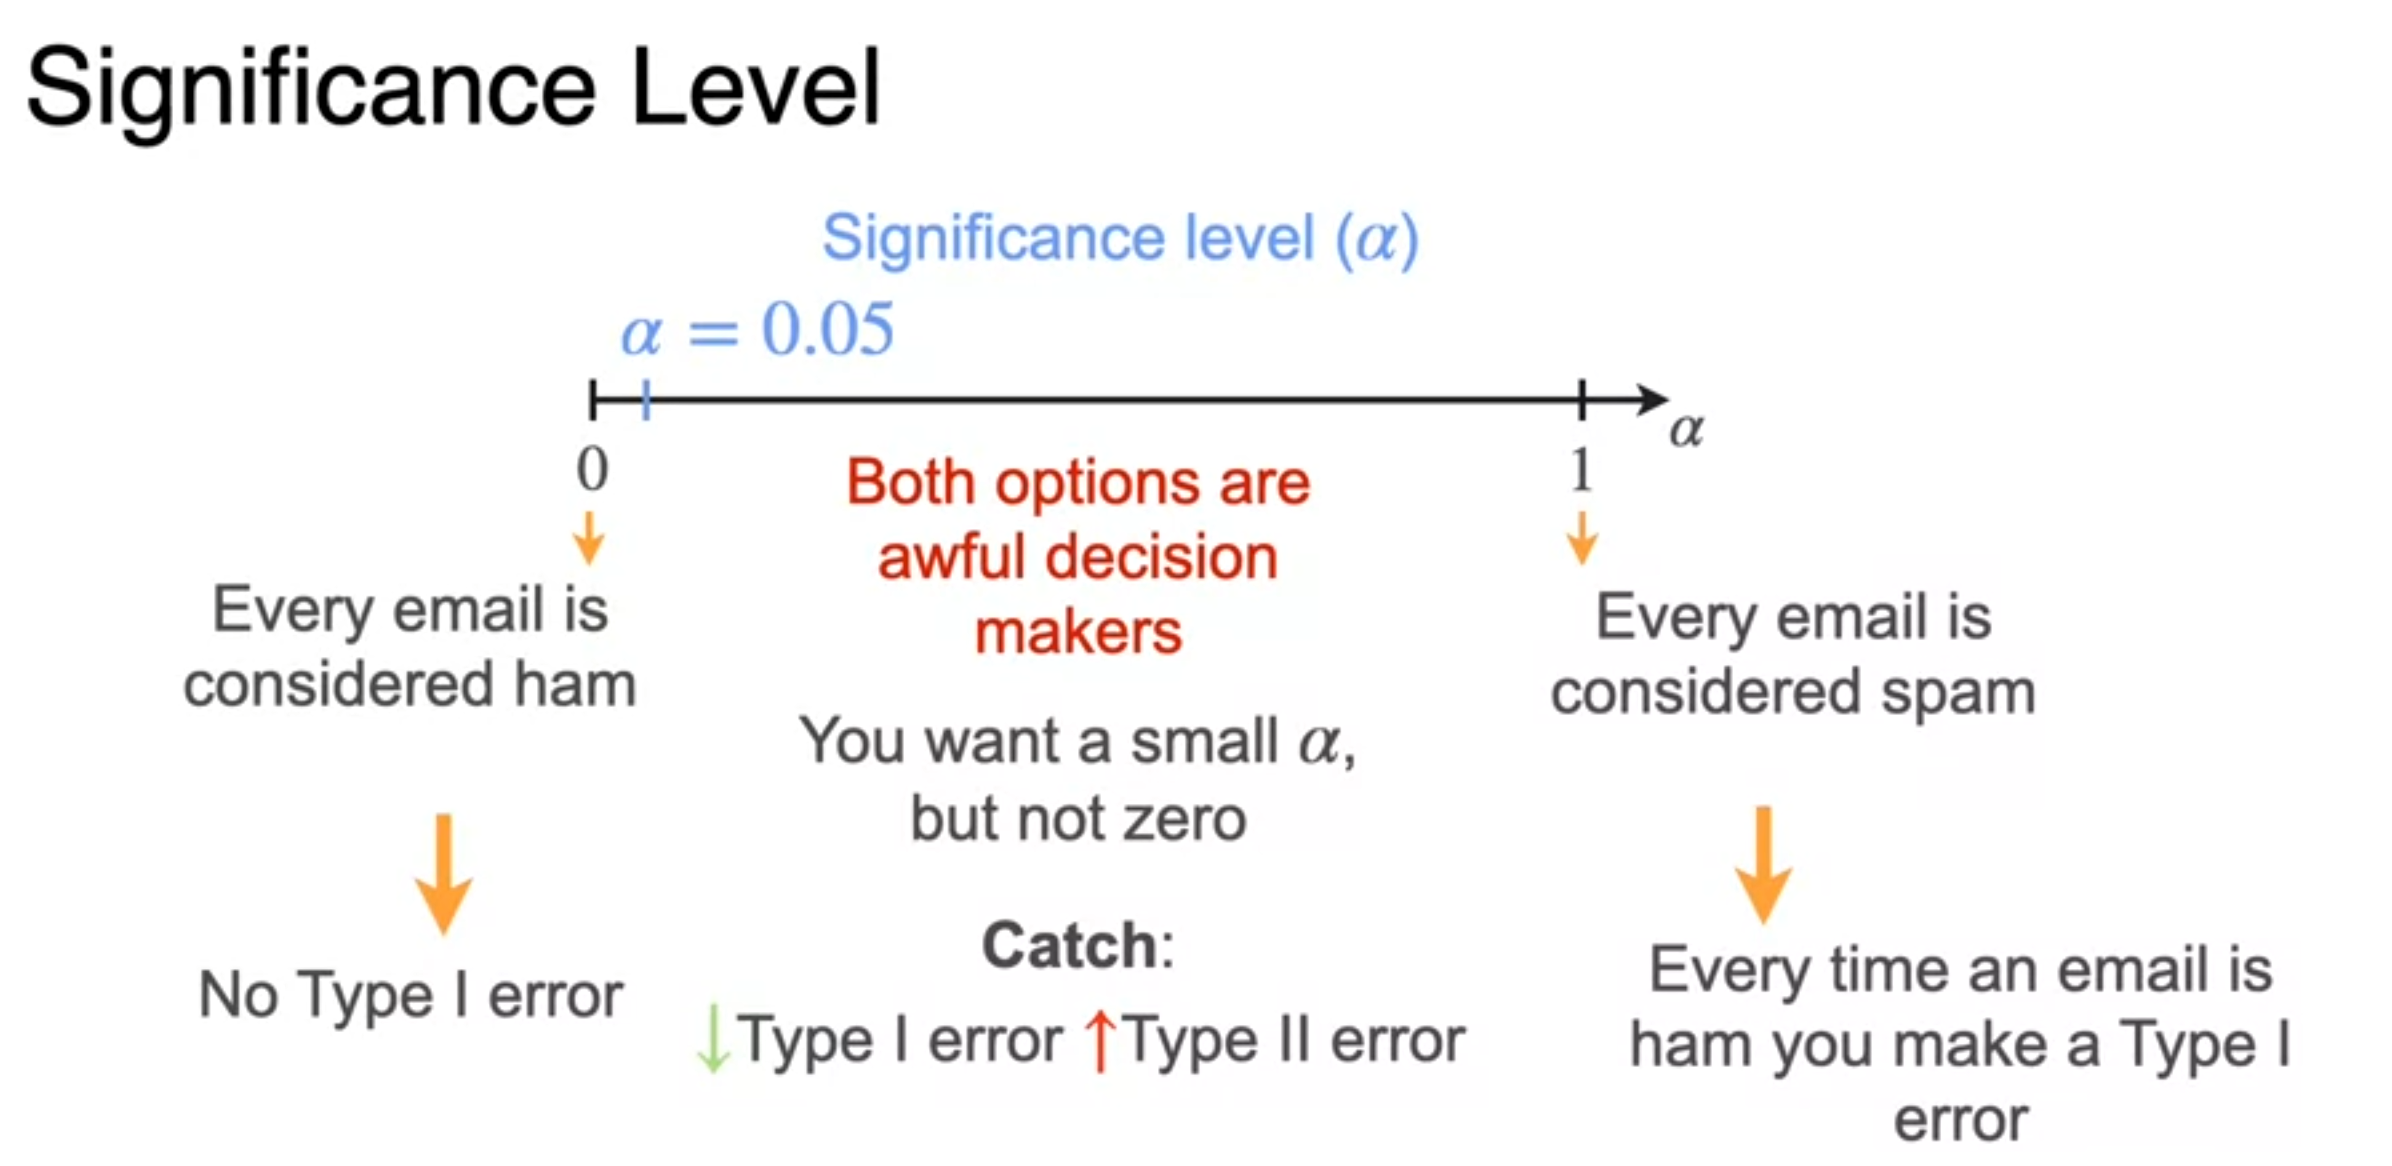
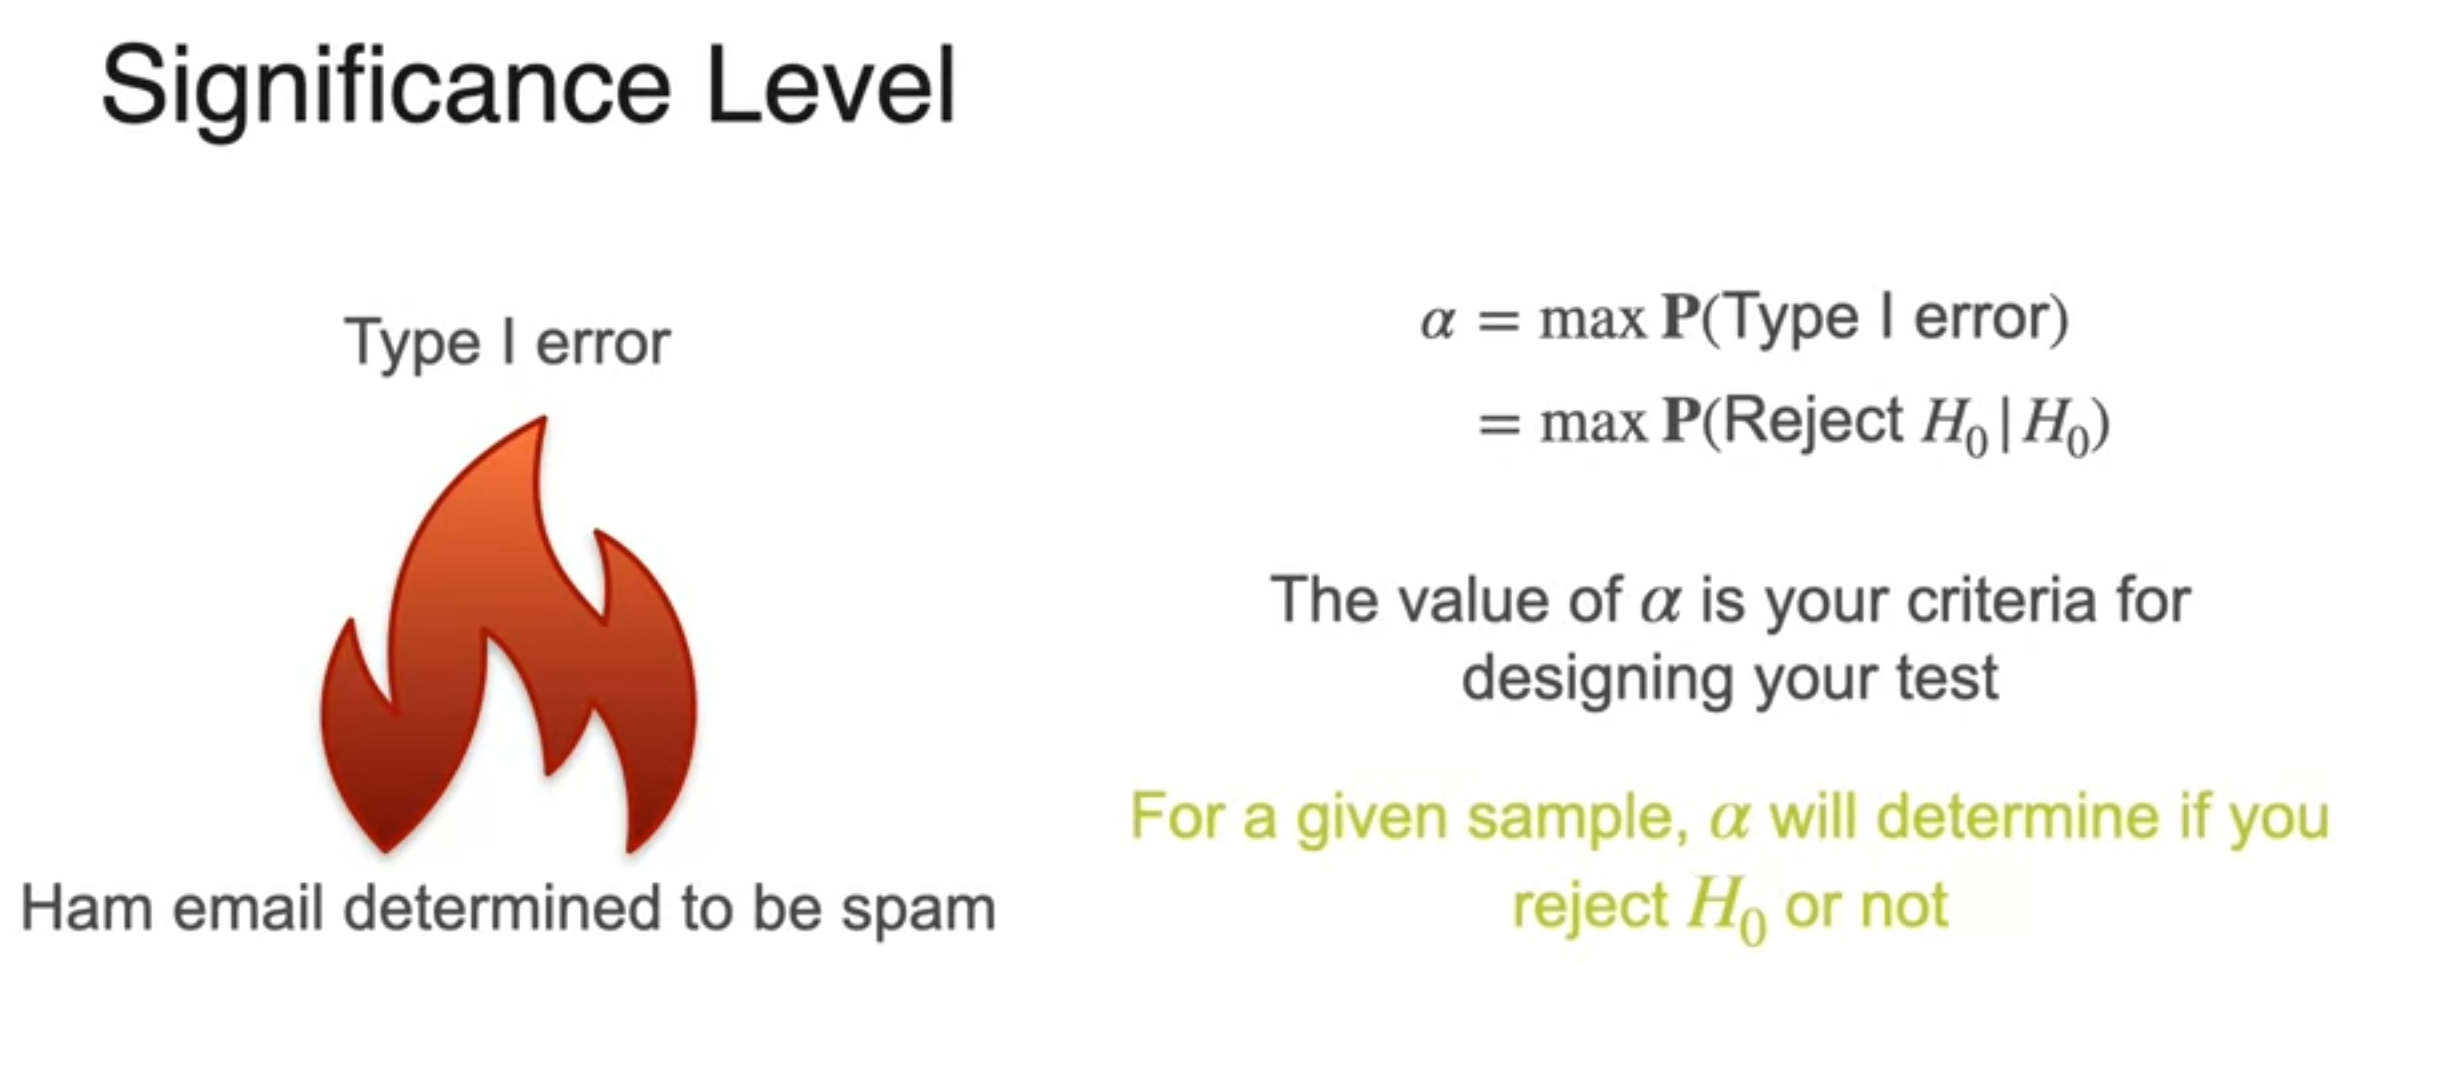
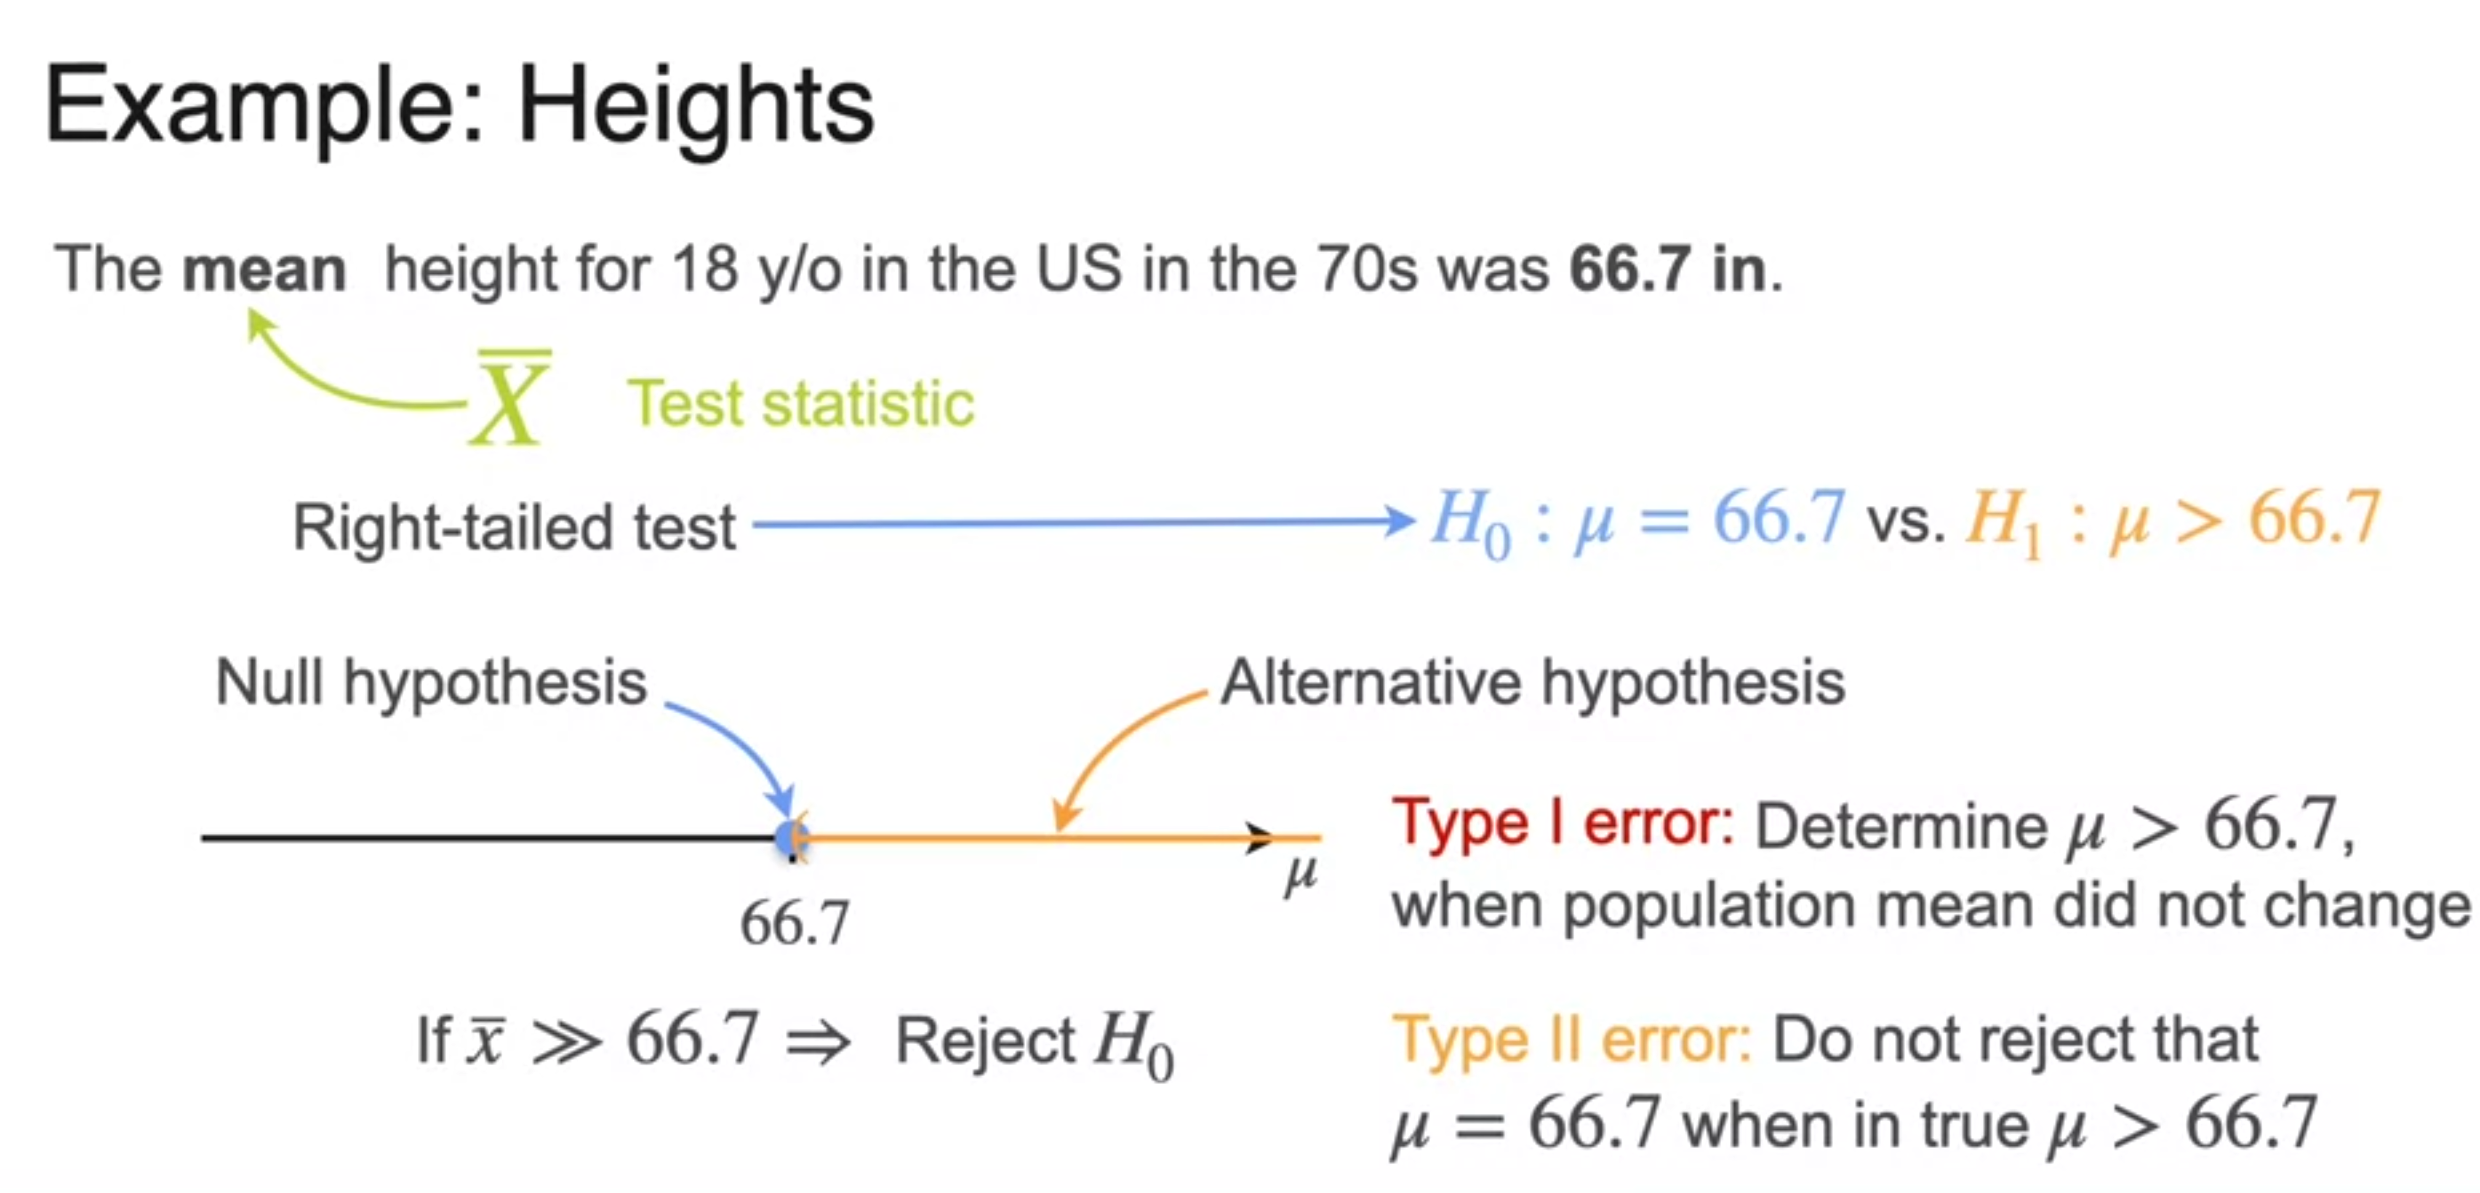
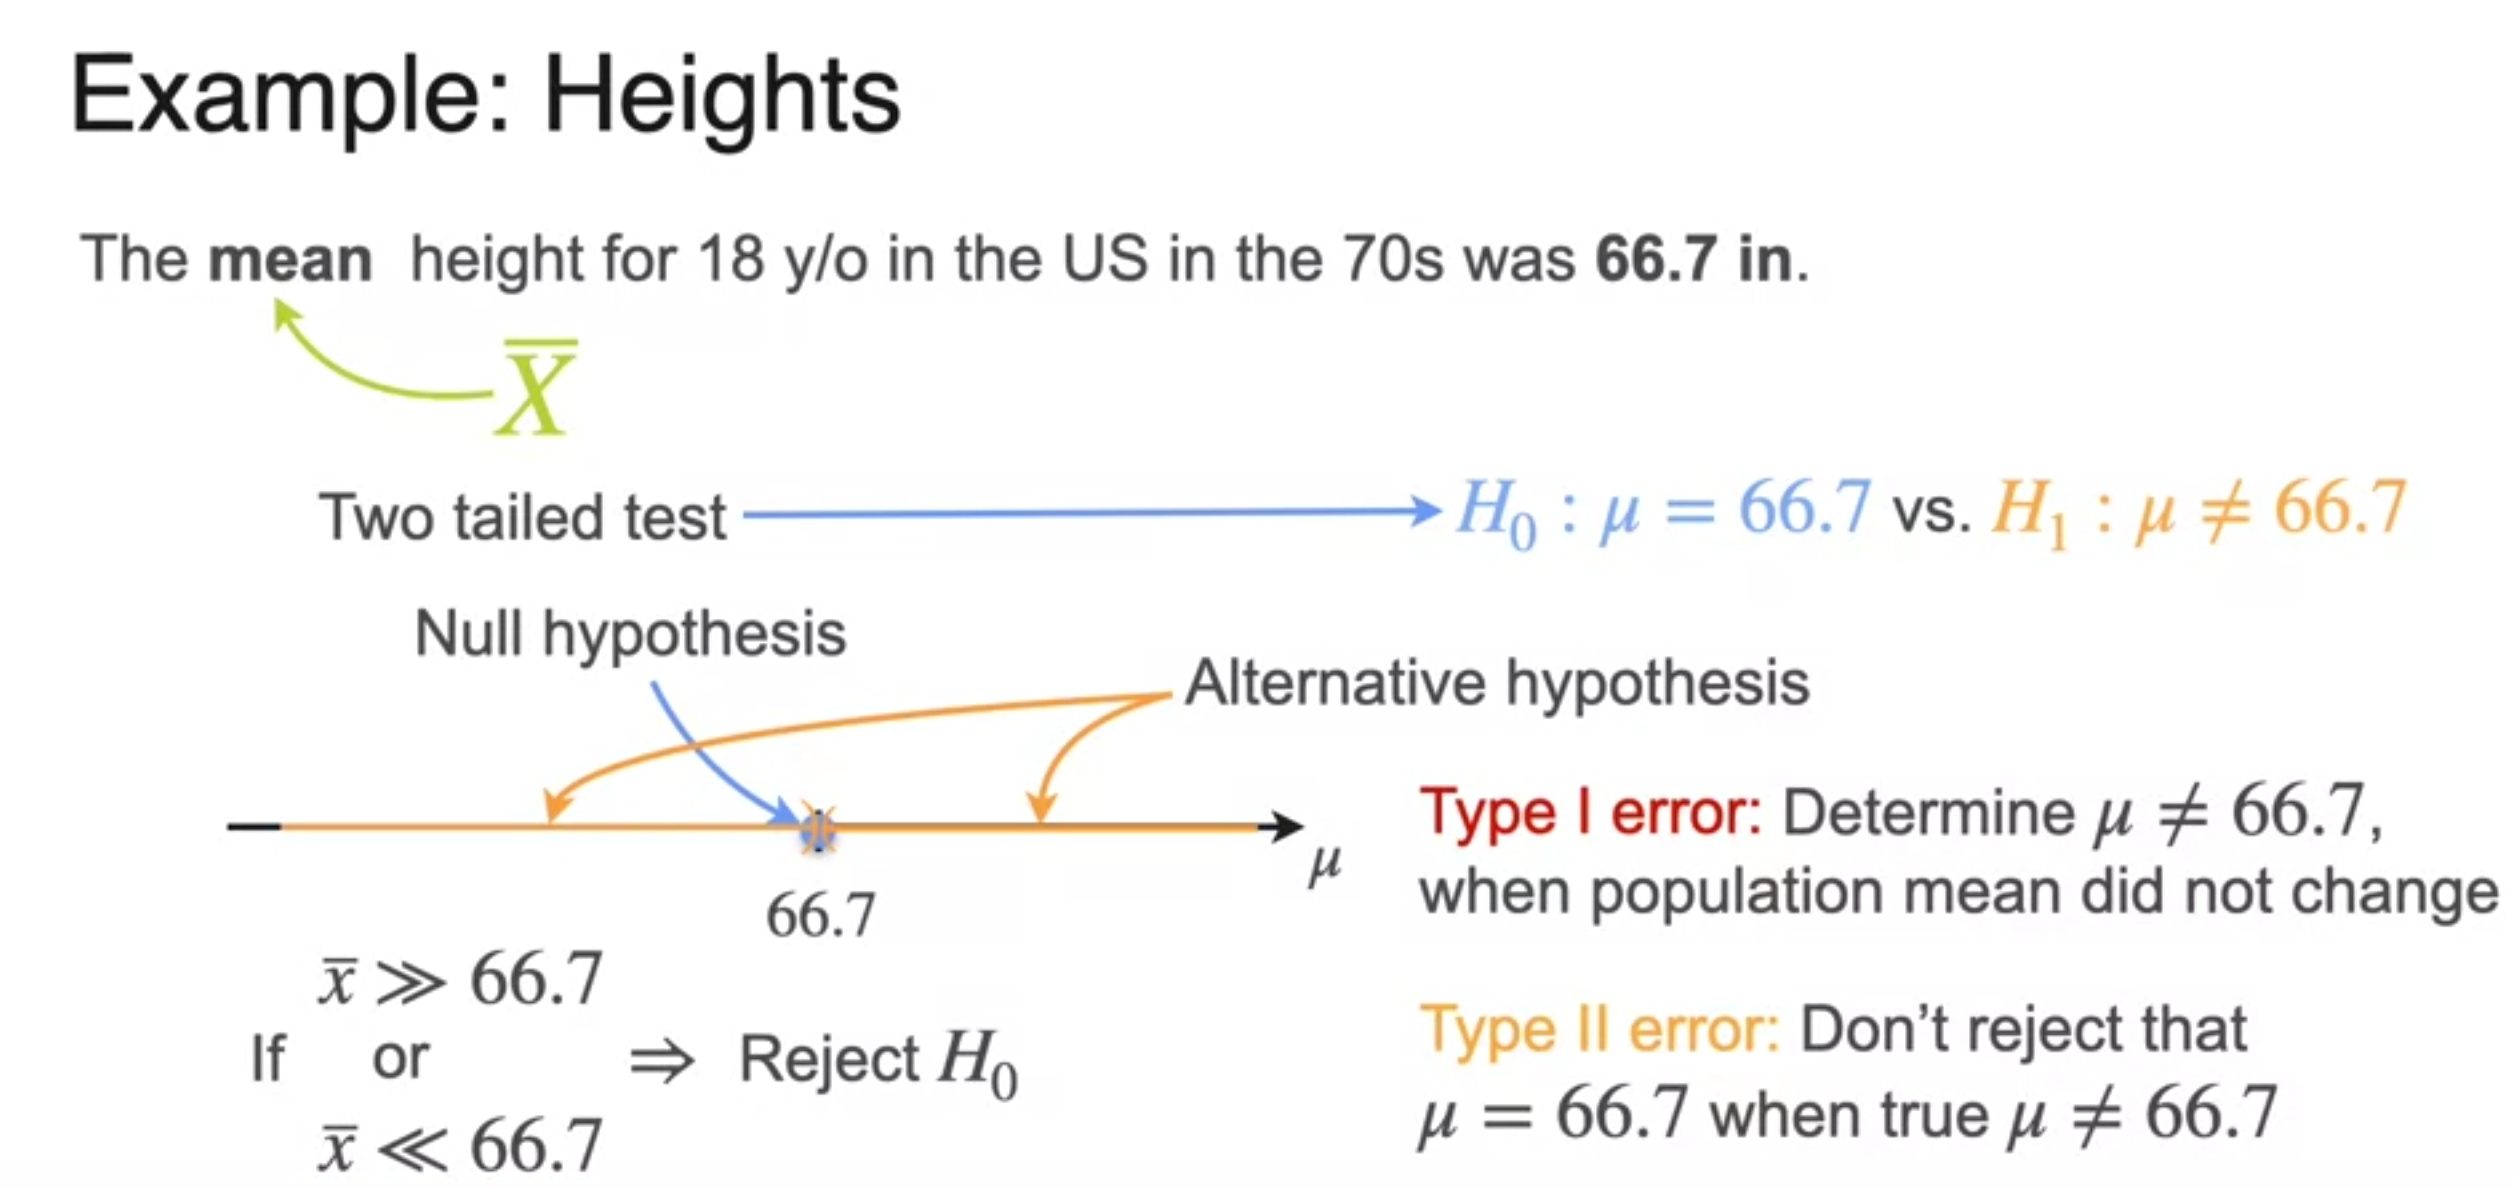
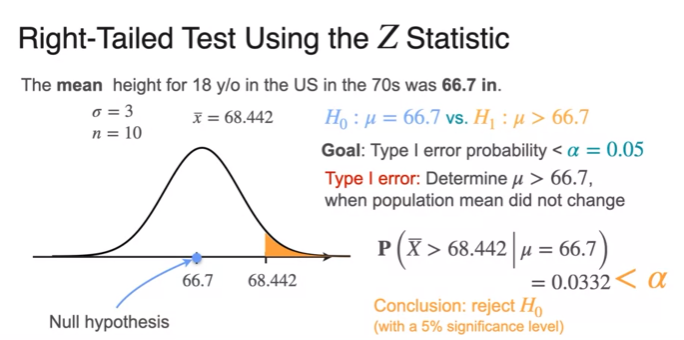
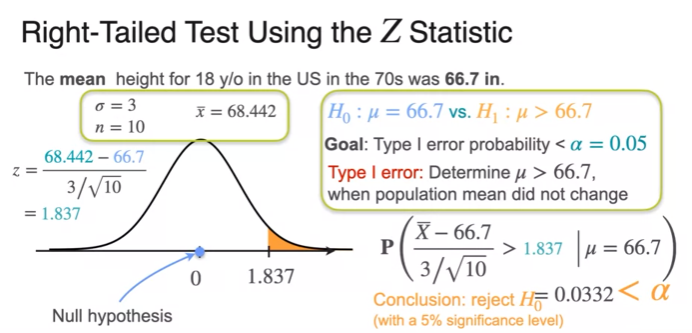
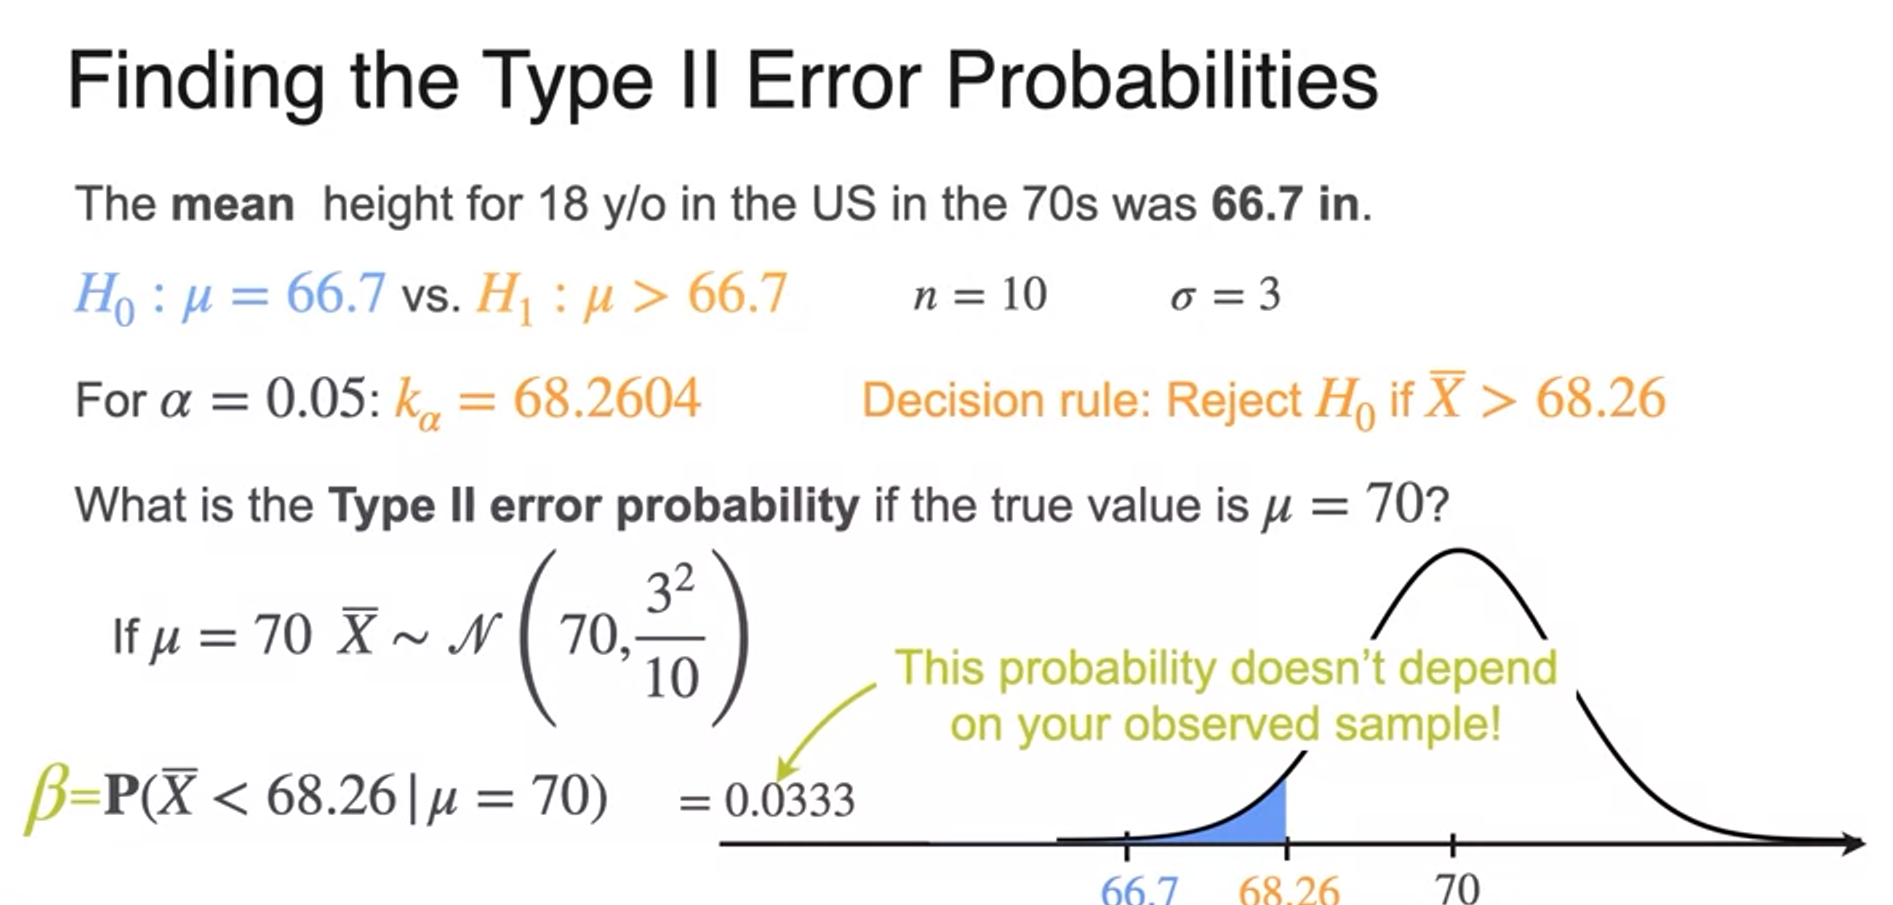
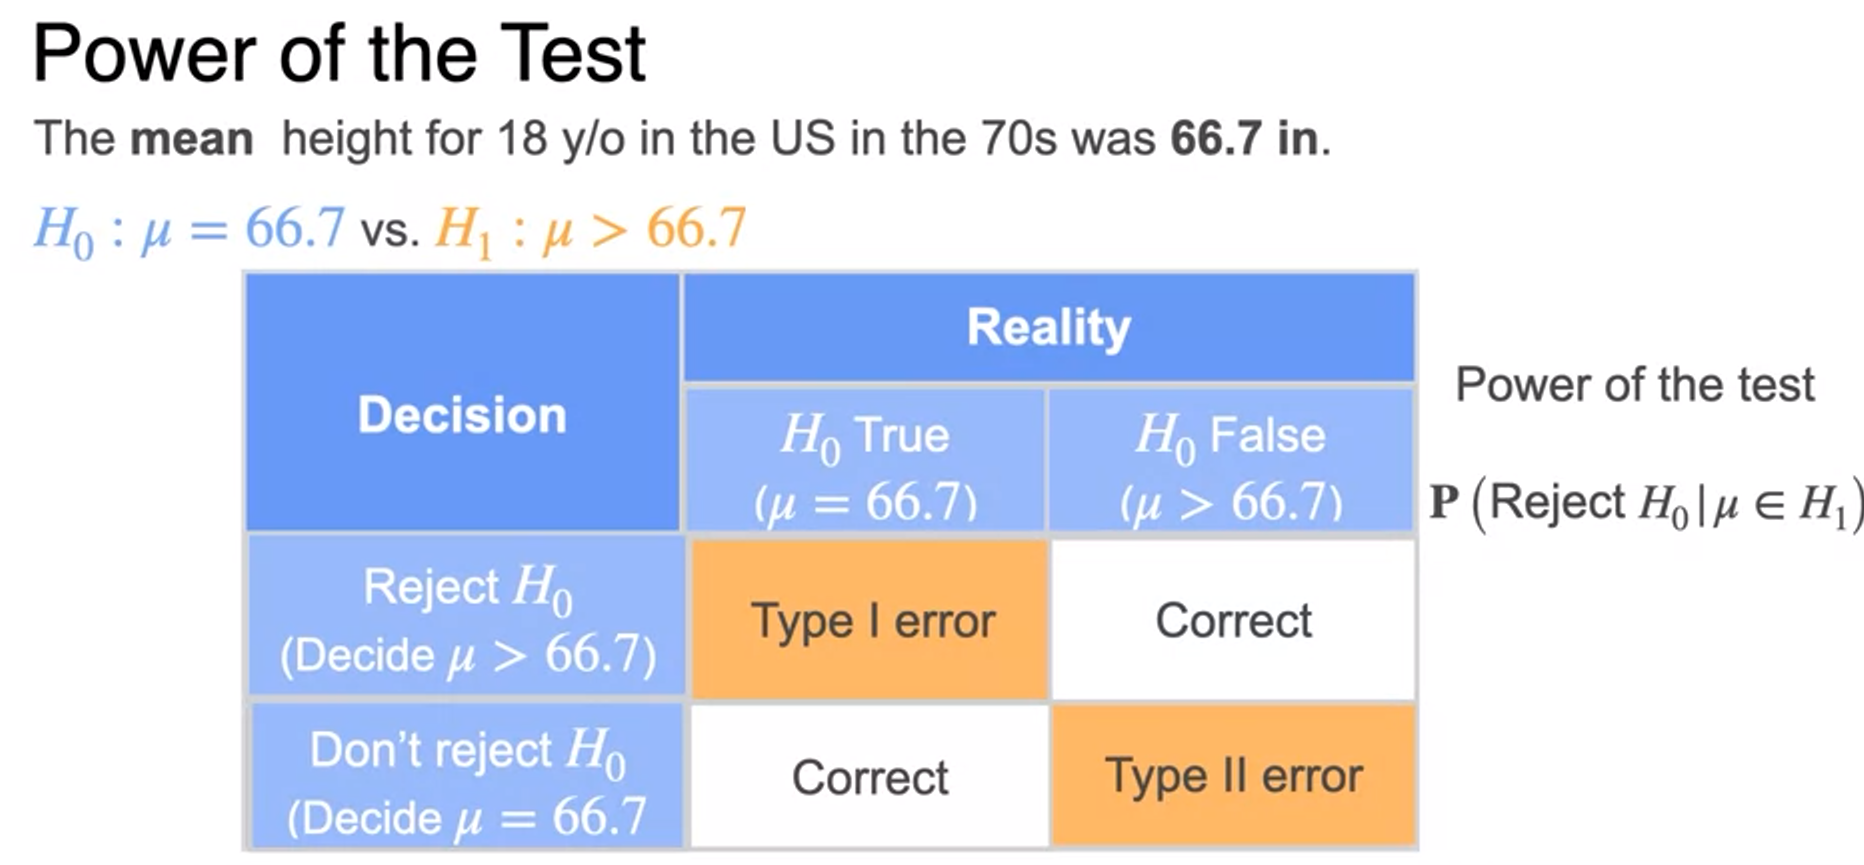
Type I and Type II errors

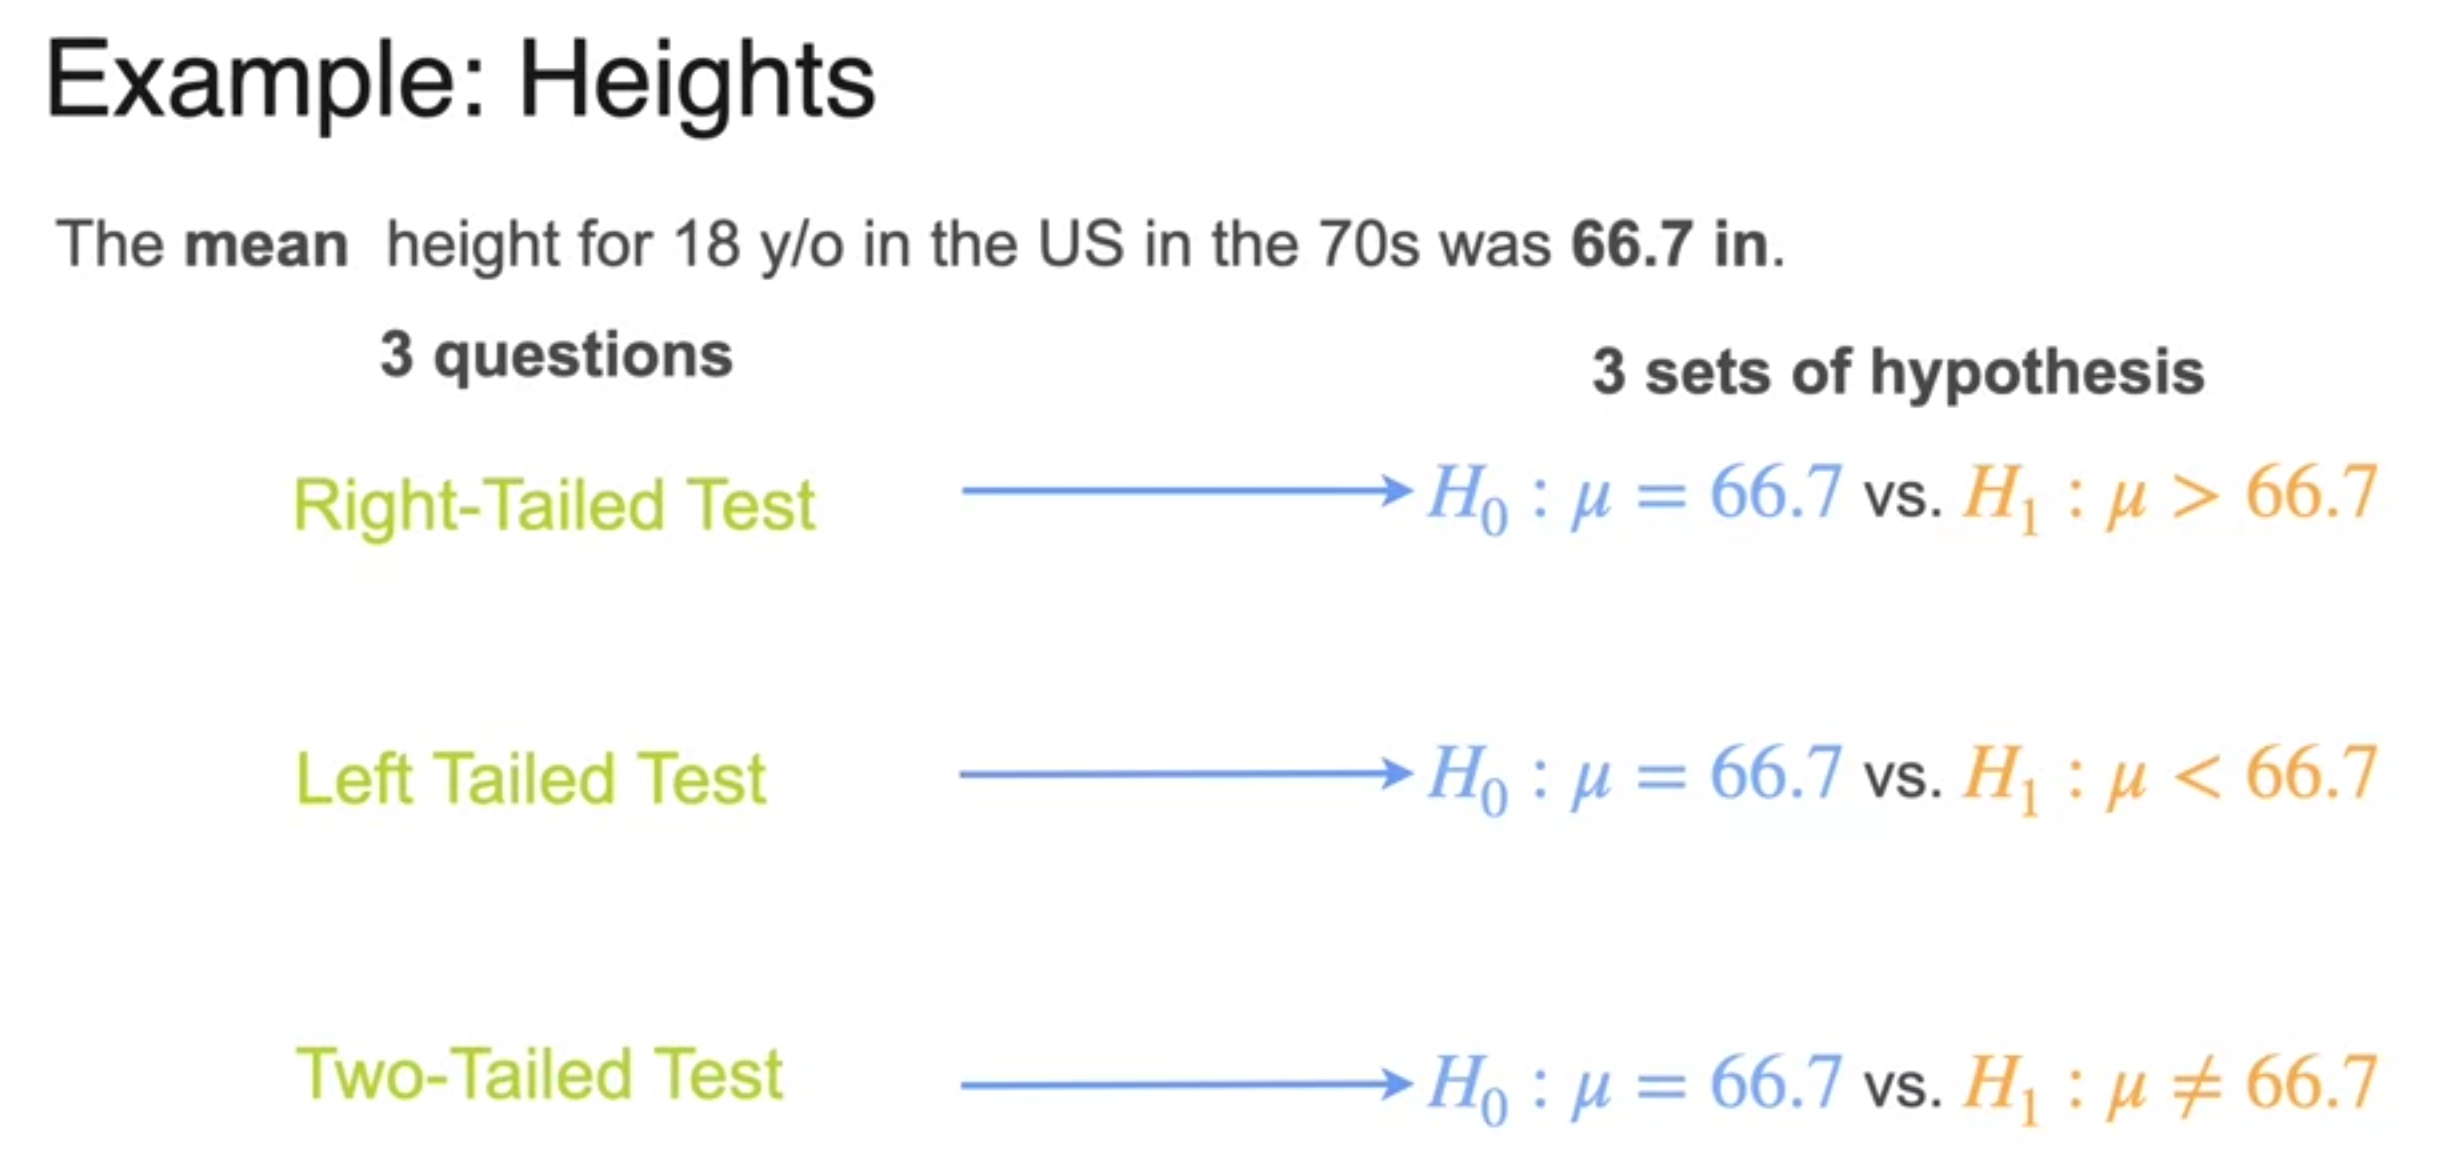
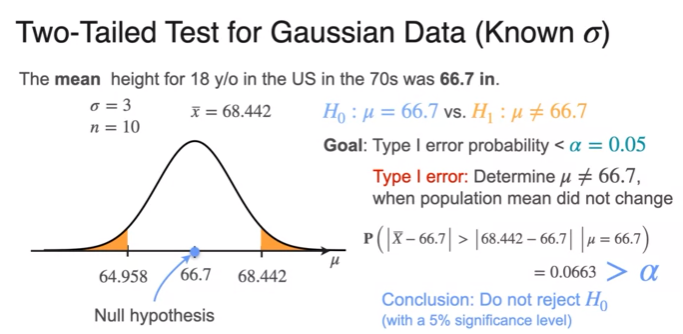
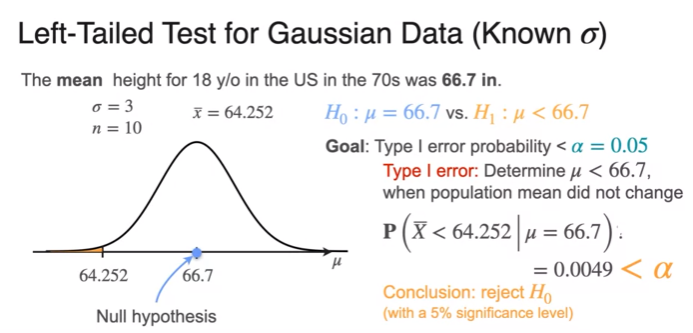
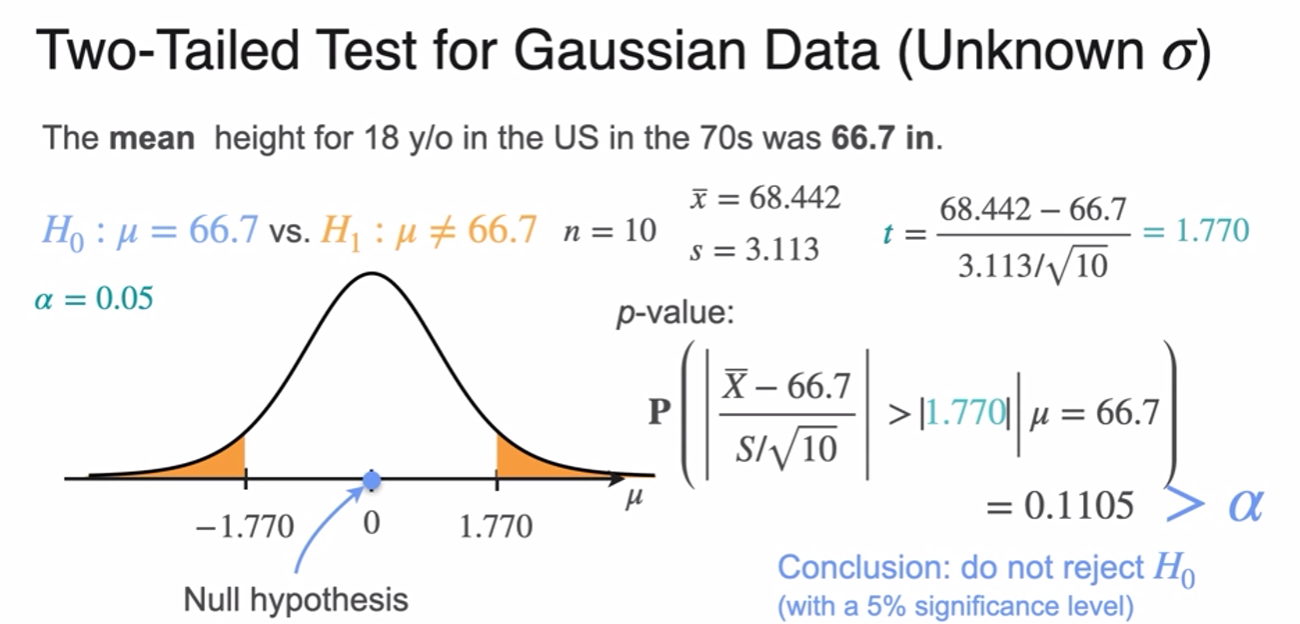
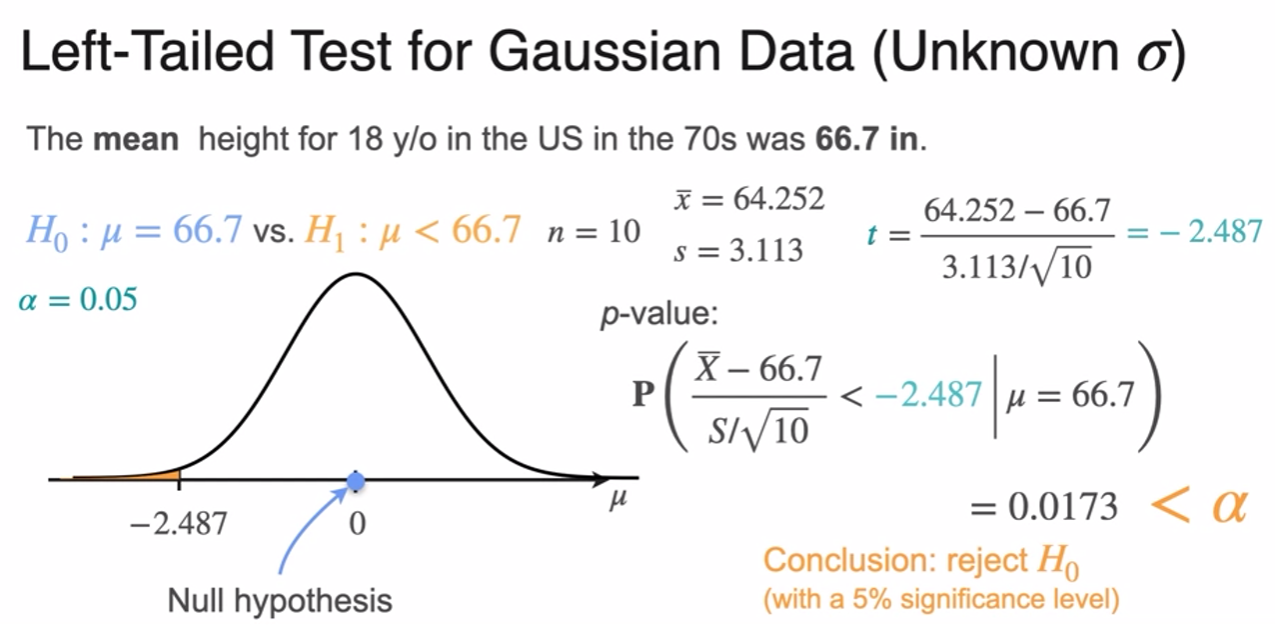
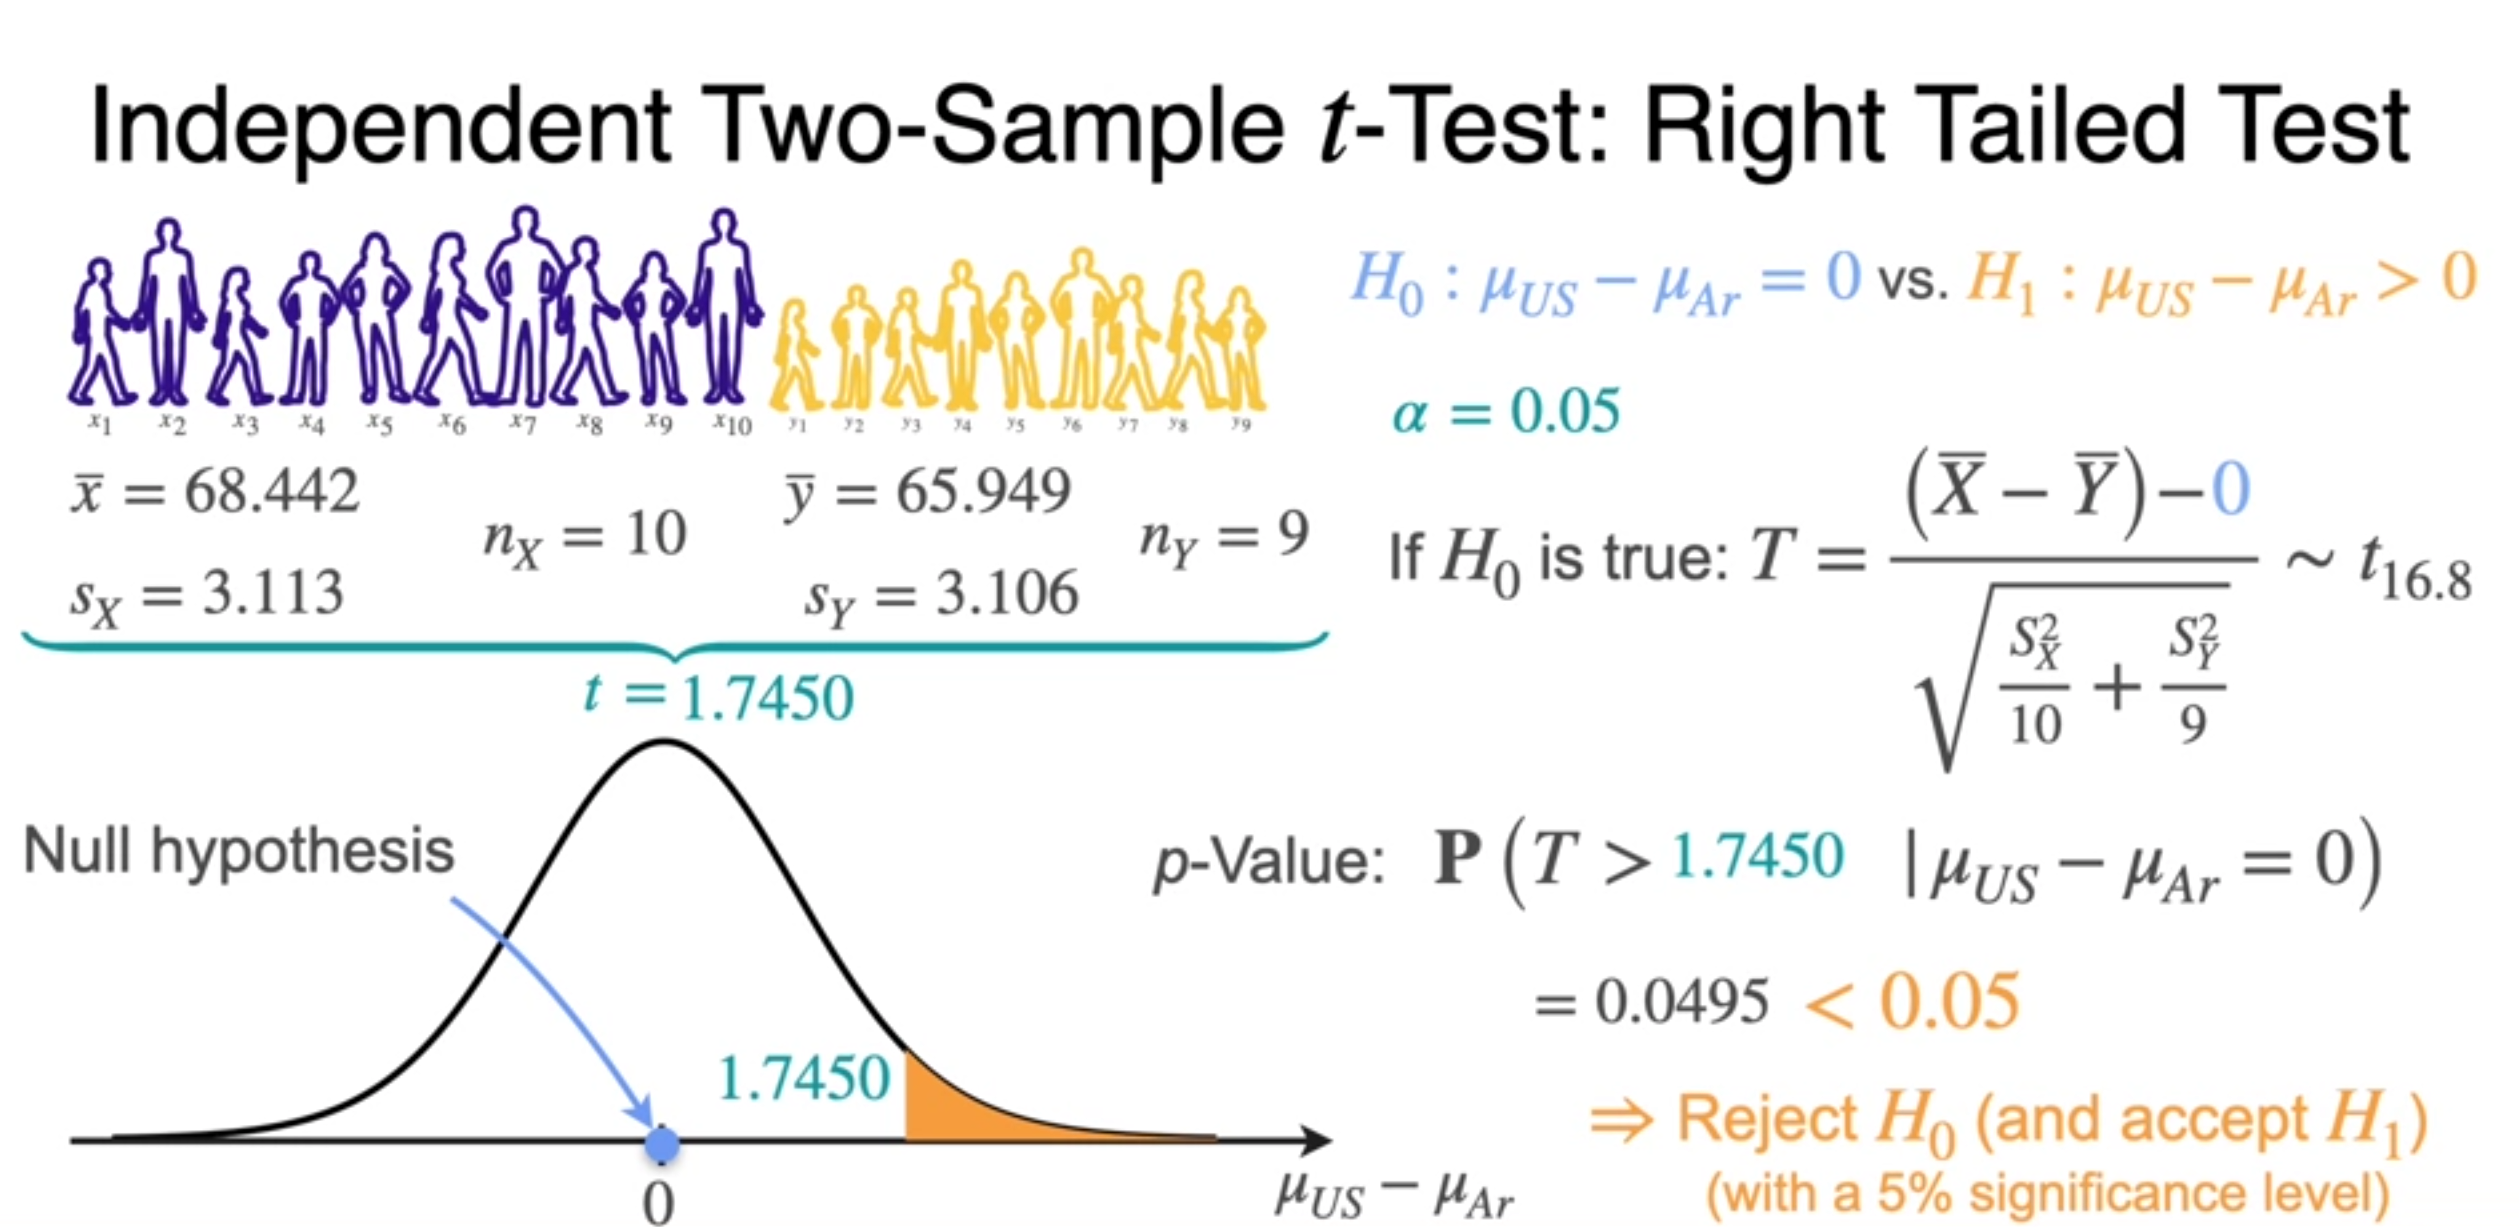
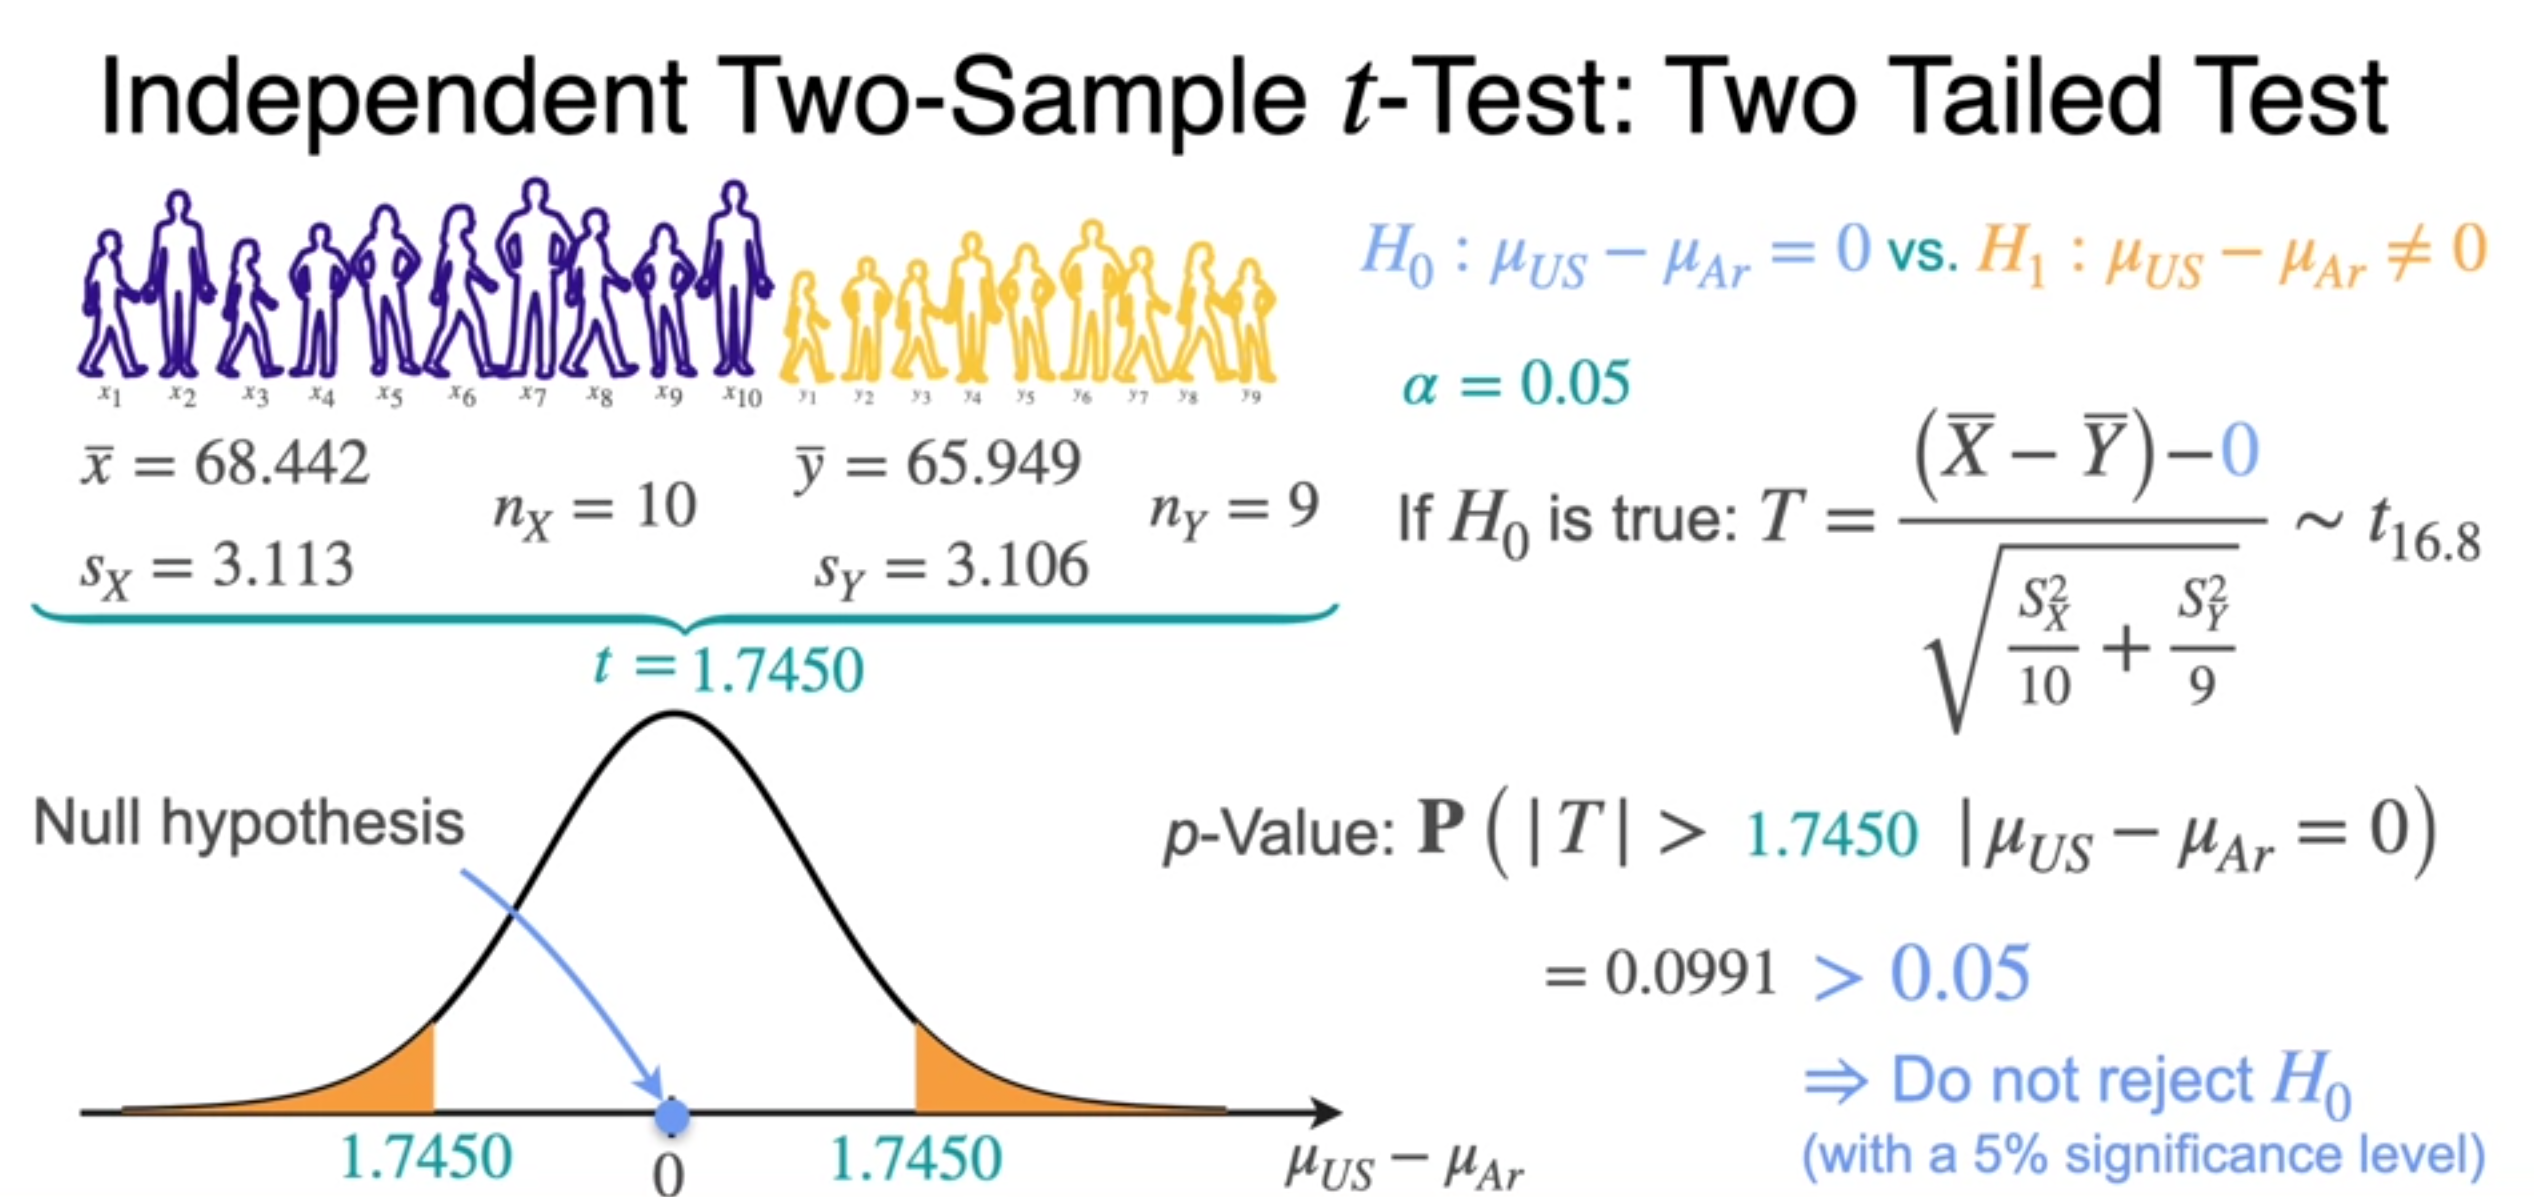
Right-Tailed, Left-Tailed, and Two-Tailed Tests
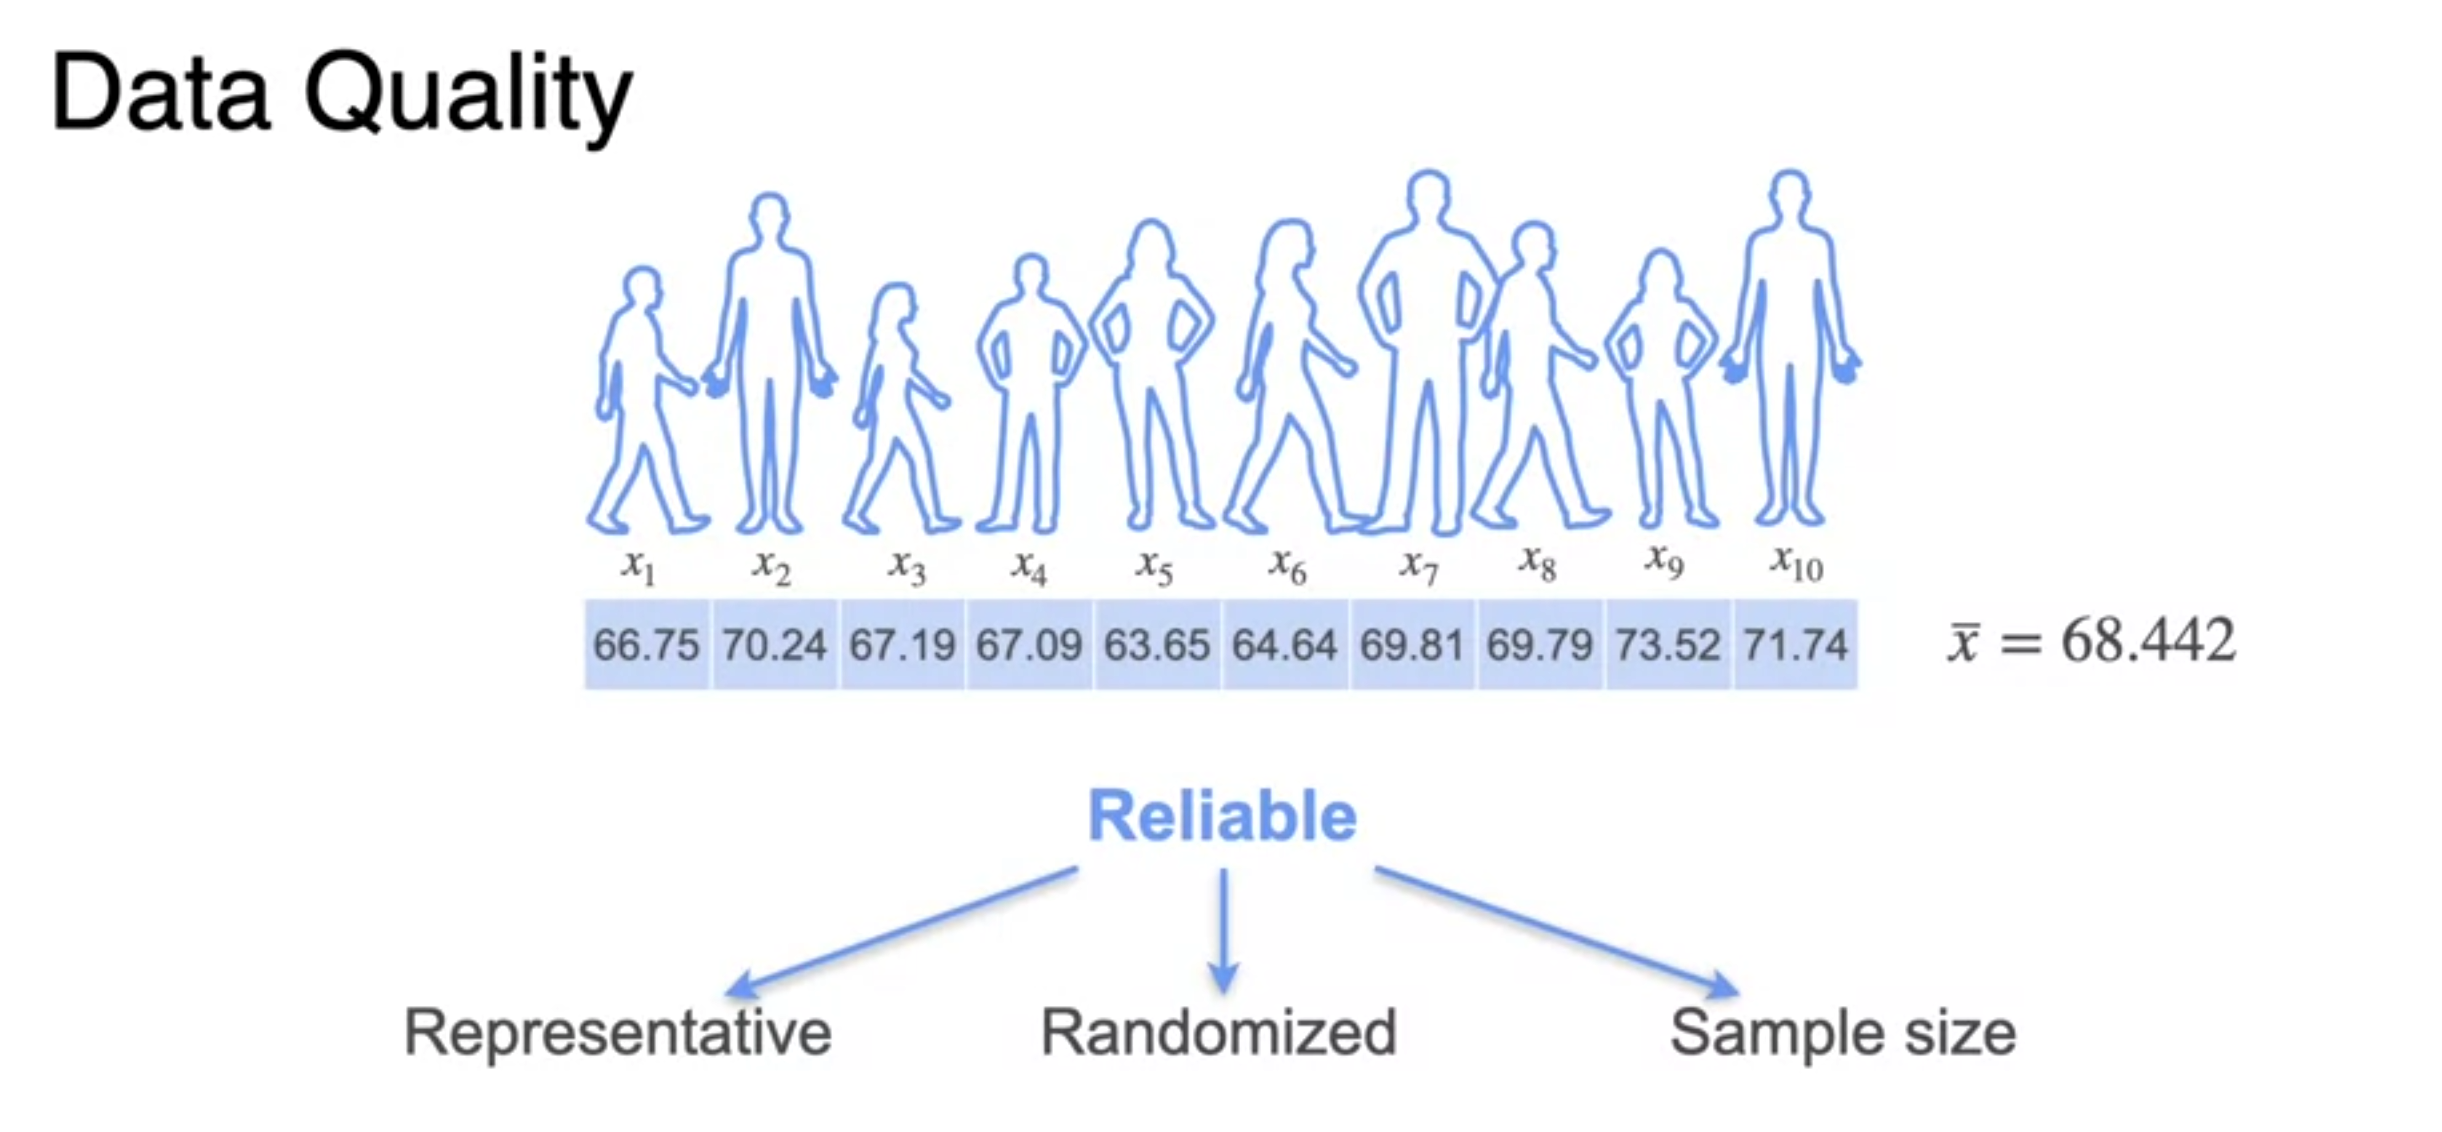
- Representative
- Random
- Sample size (normally over 30)
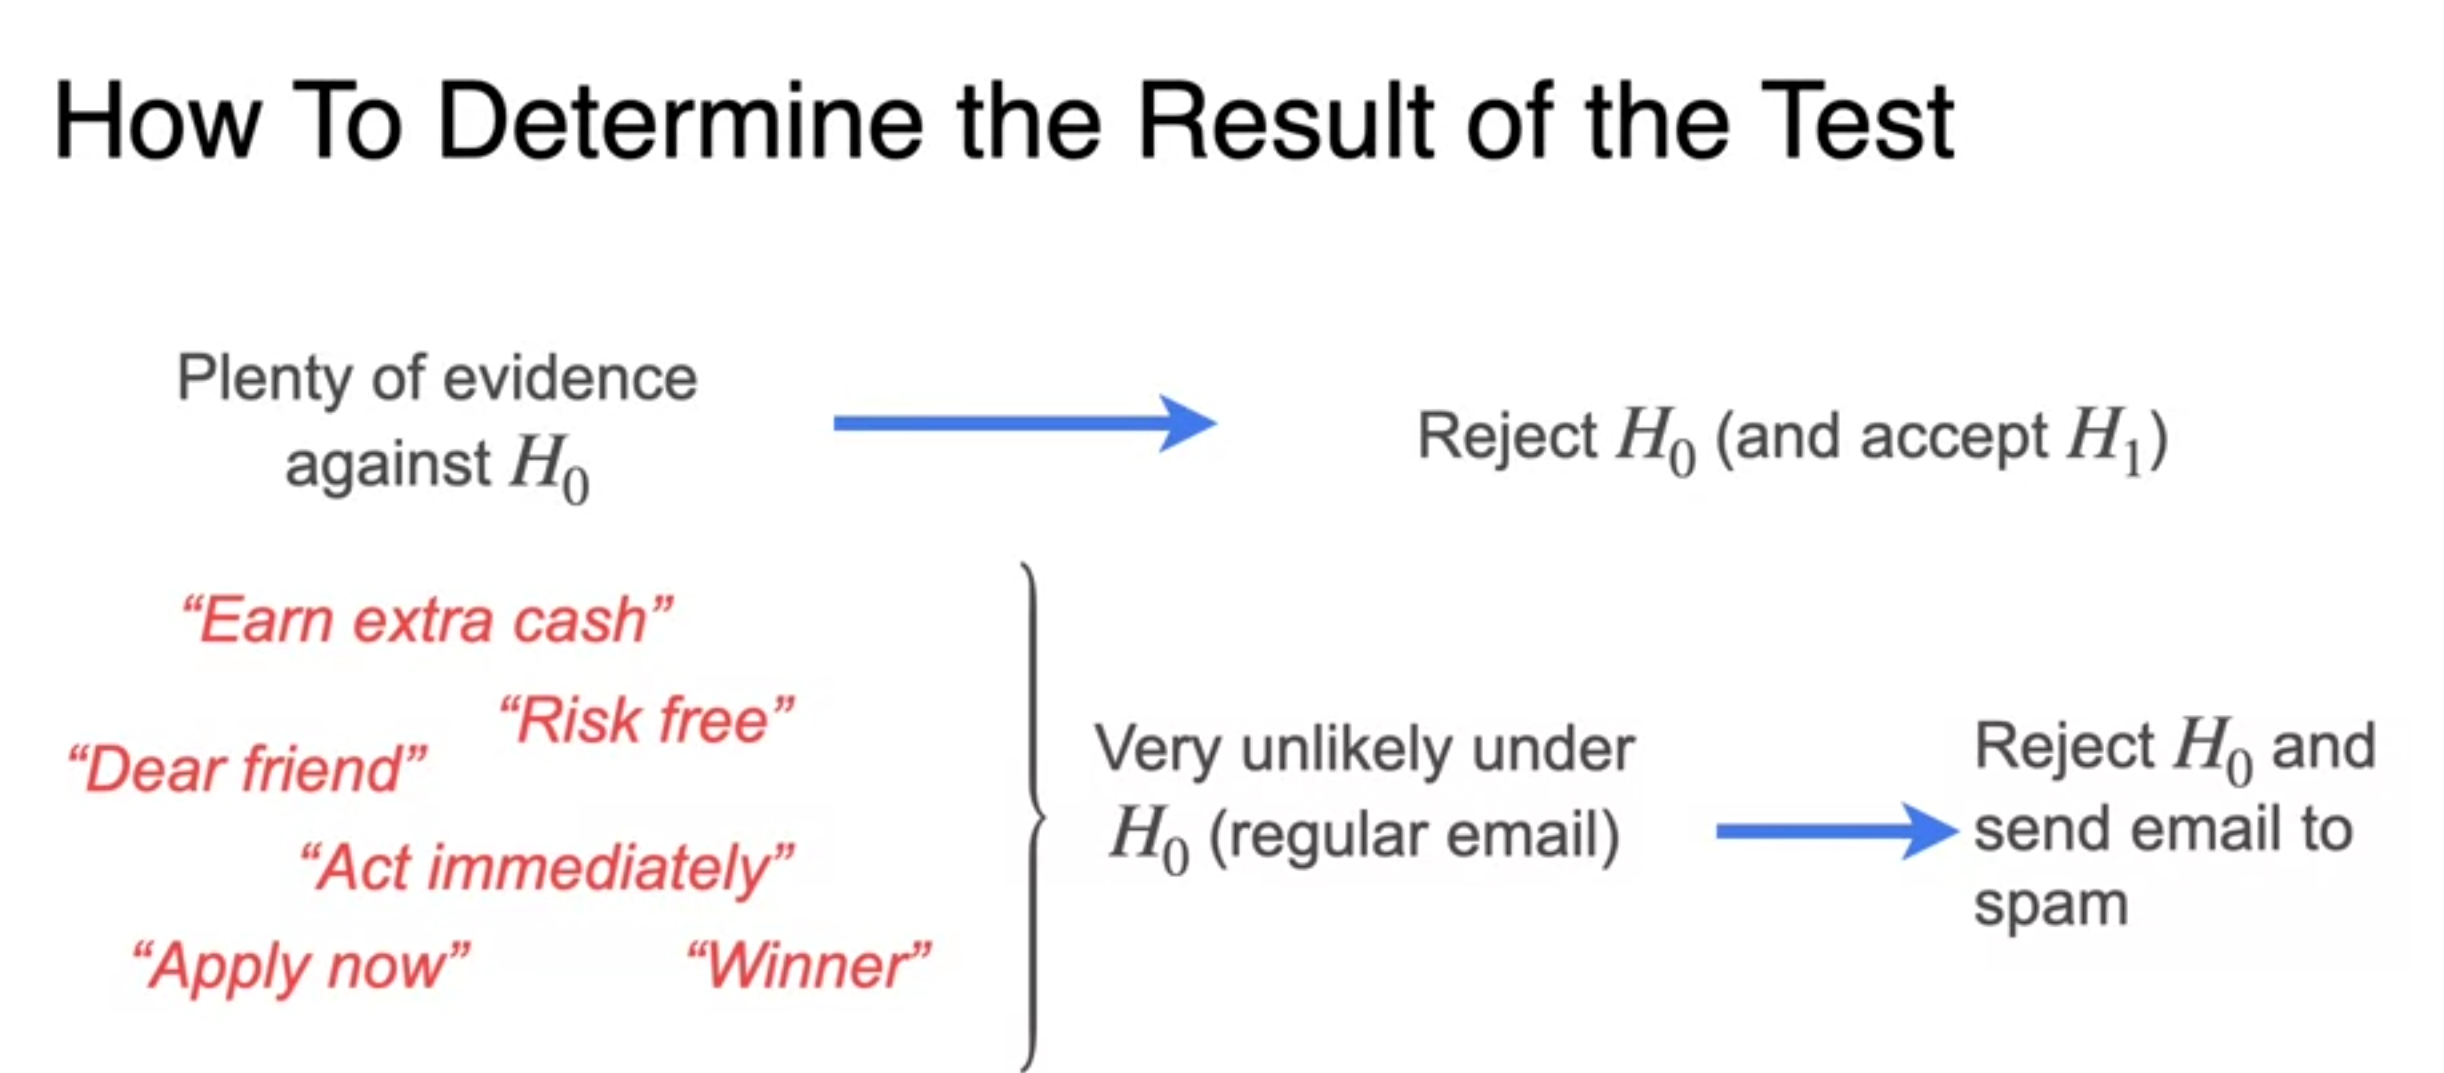
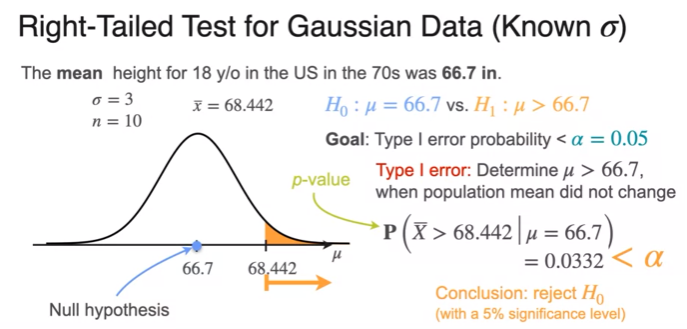
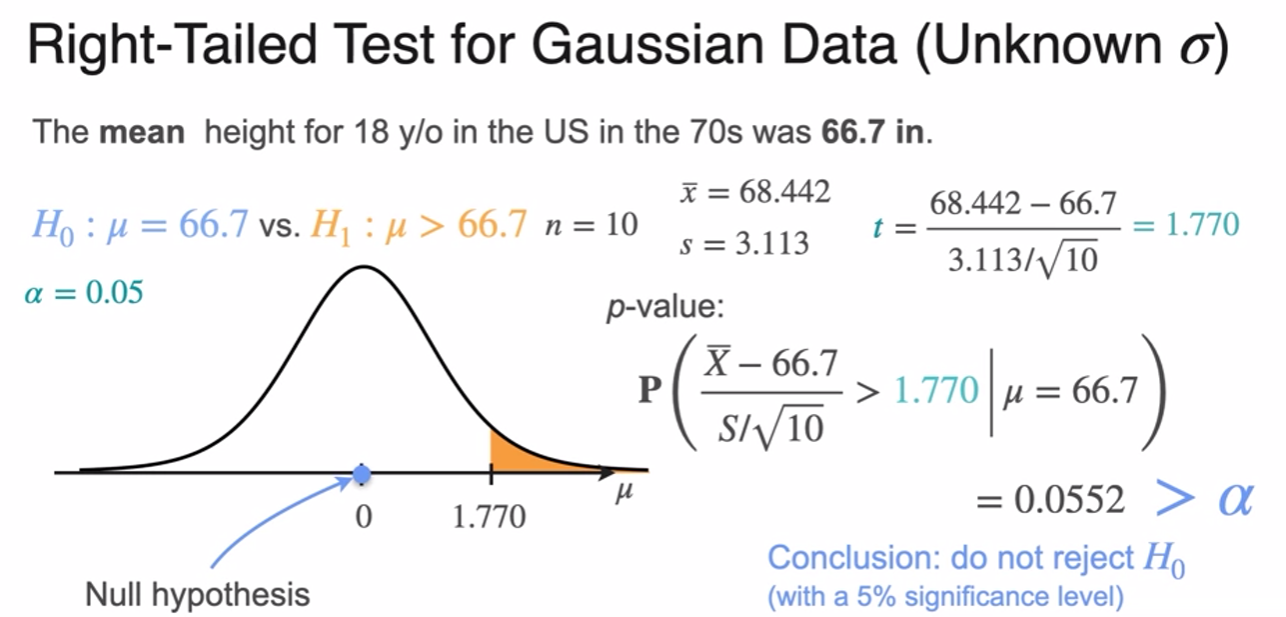
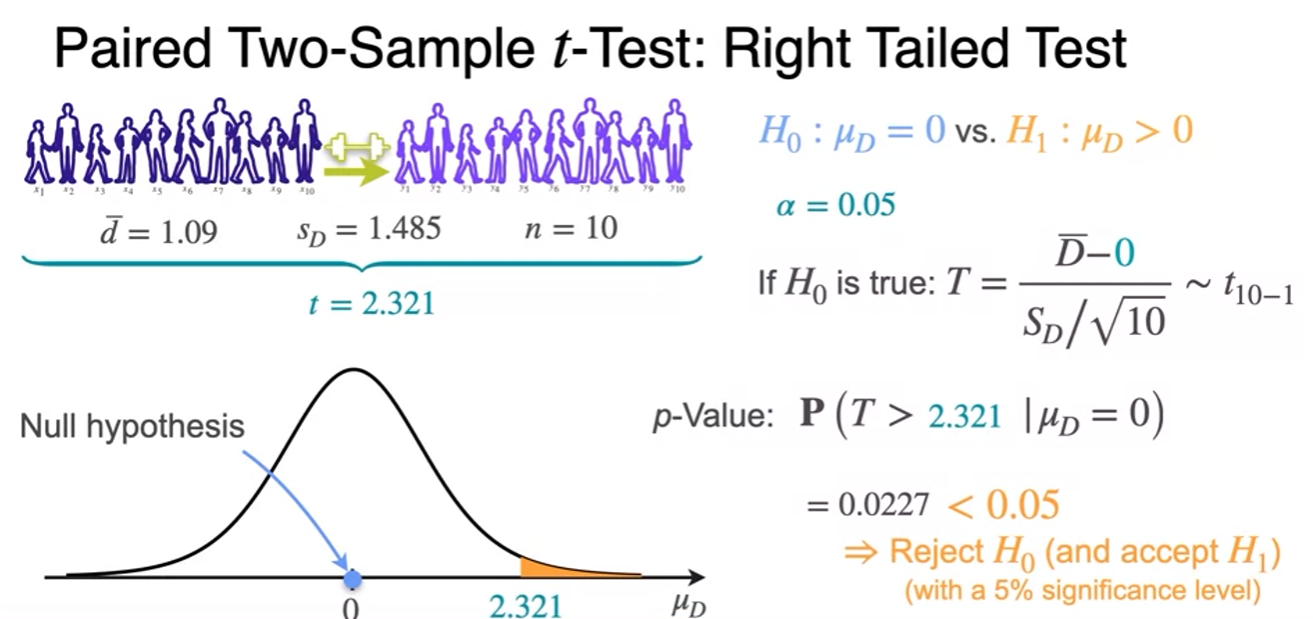
p-Value
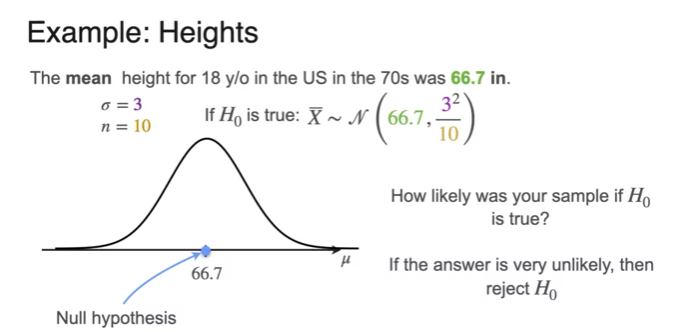
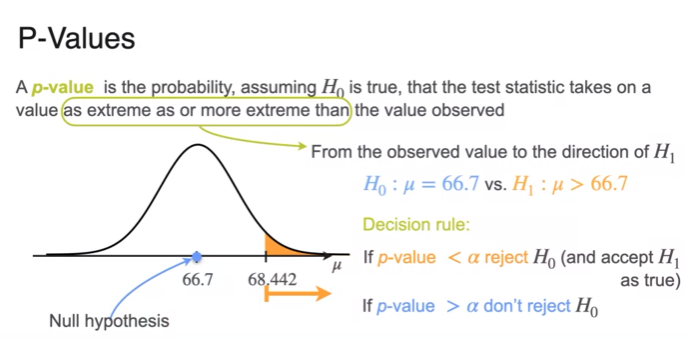
- p-value유의확률
- 너무 작으면 귀무가설 거절(0.05, 근래에는 0.005로 조정 권고)
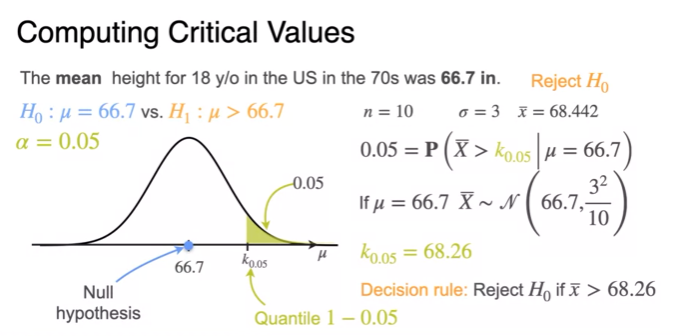
Critical Values
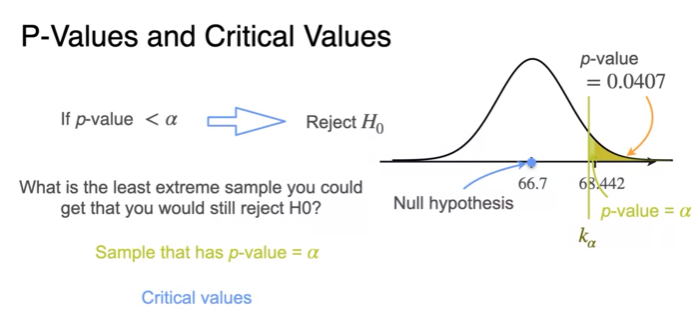
- p-value is smaller than significant level
- reject
- p-value =
- Critical value
- can reject
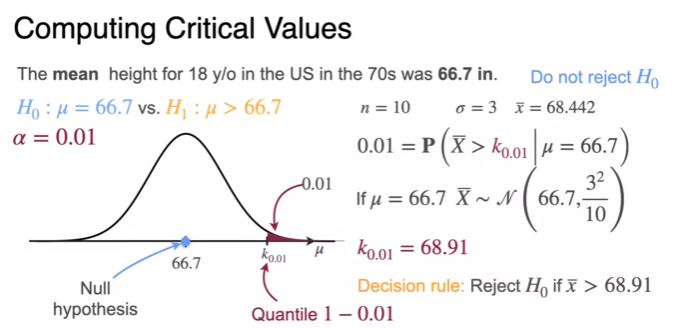
- can not reject
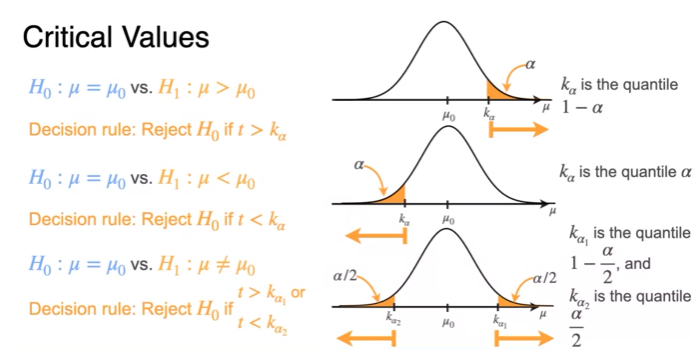
- quantile분위수(절단점)
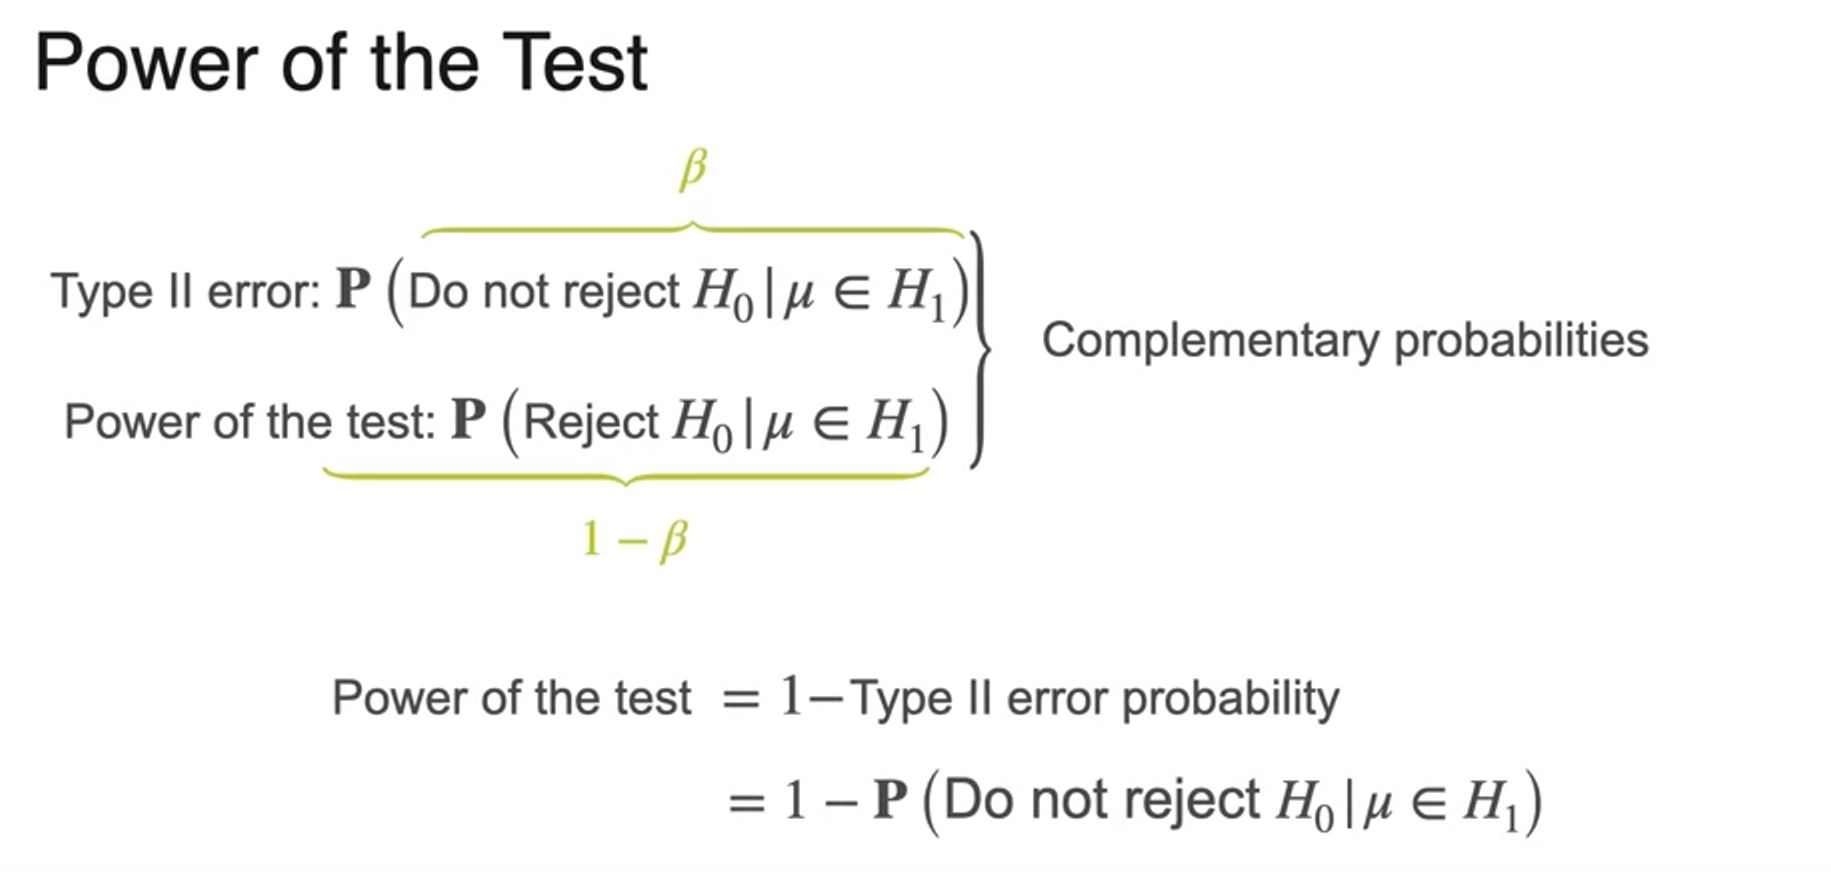
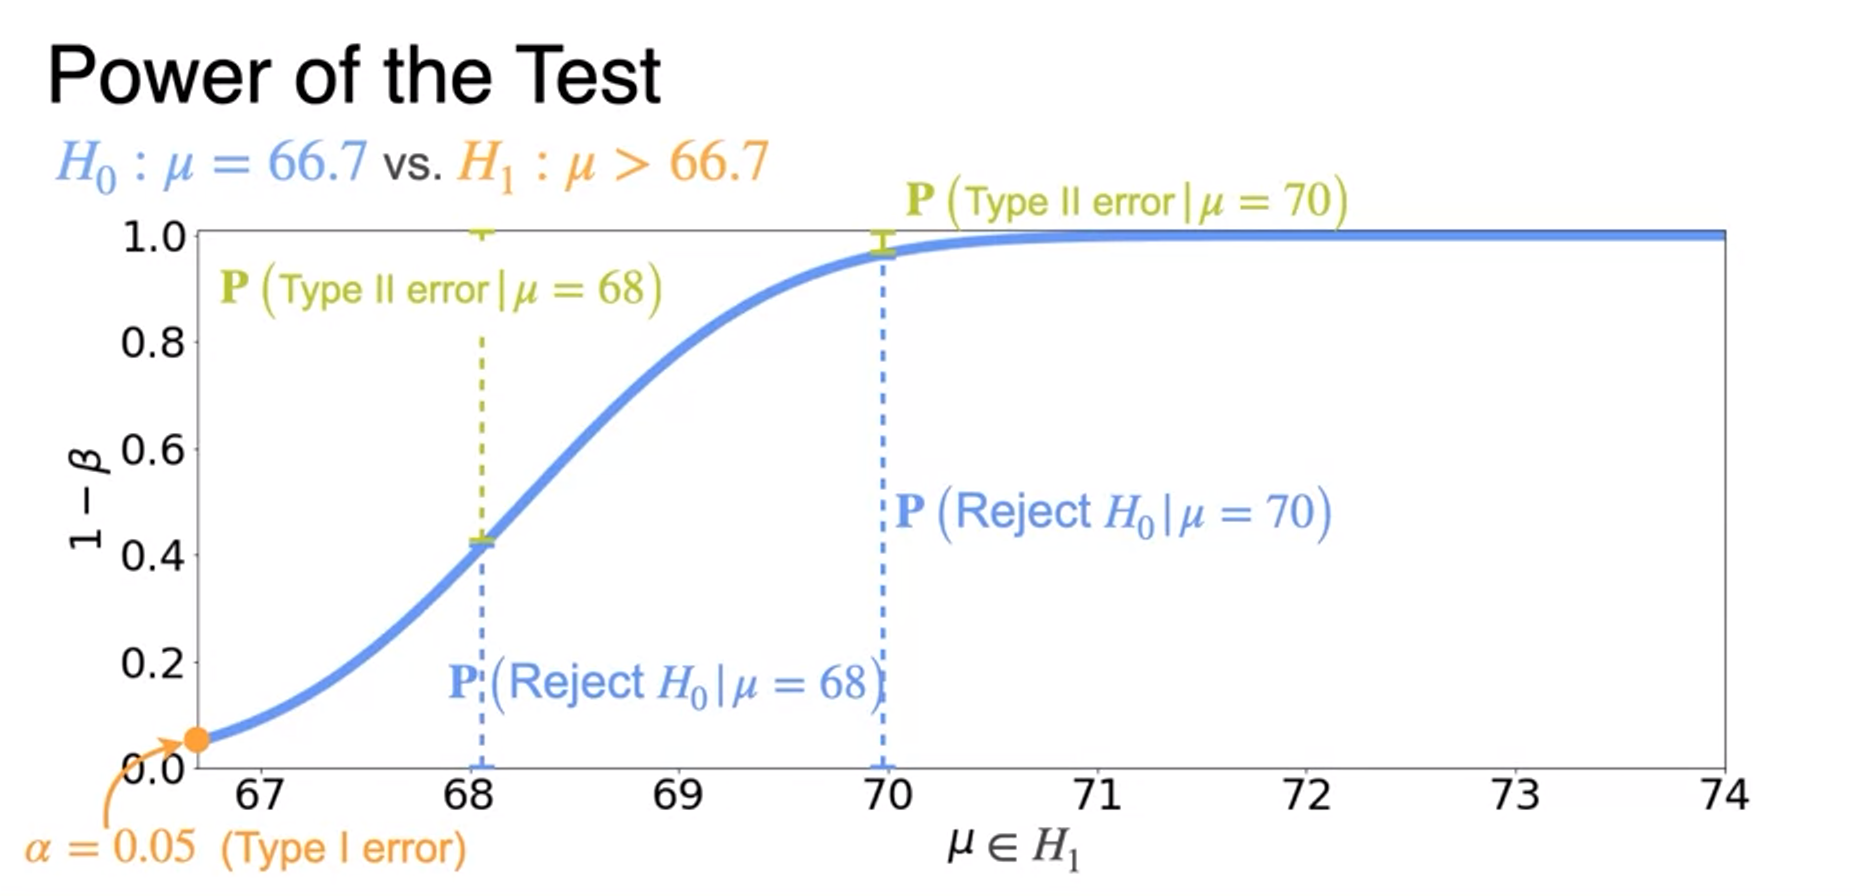
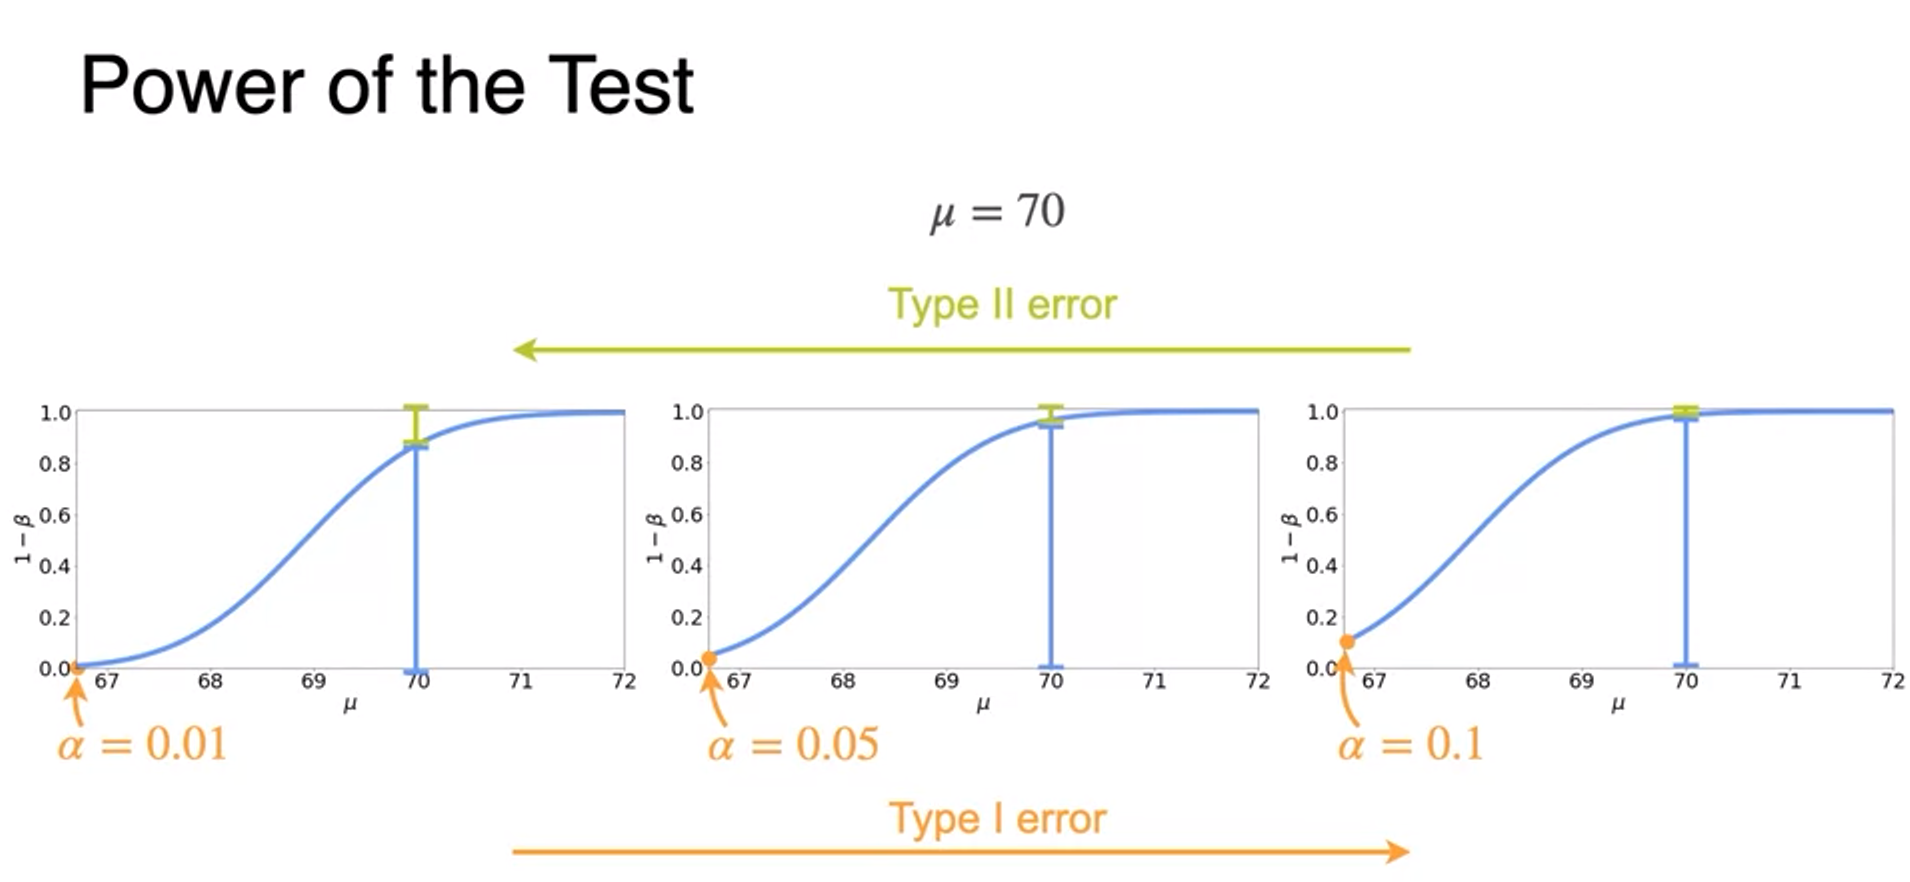
Power of a Test
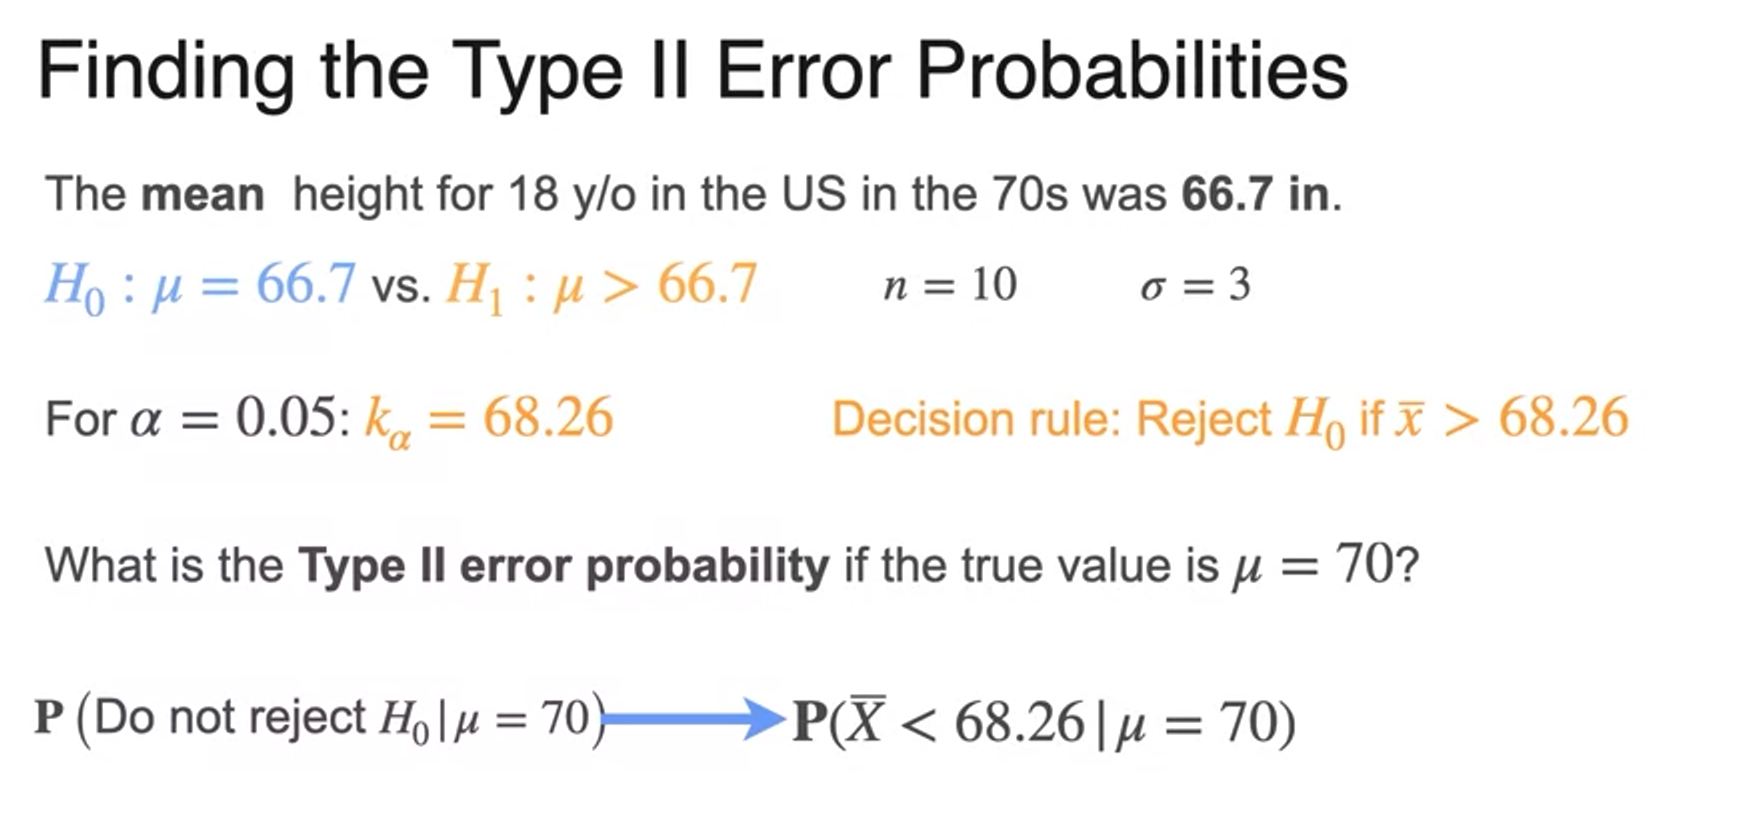
- recall재현율
TP / TP + FN(type2 error)
실제로 사실인 것 중에 모델이 사실이라고 한 비율
모델 정확도가 높을수록 상승 - precision정밀도
TP / TP + FP(type1 error)
모델이 사실이라고 한 것 중에 실제로 사실인 비율
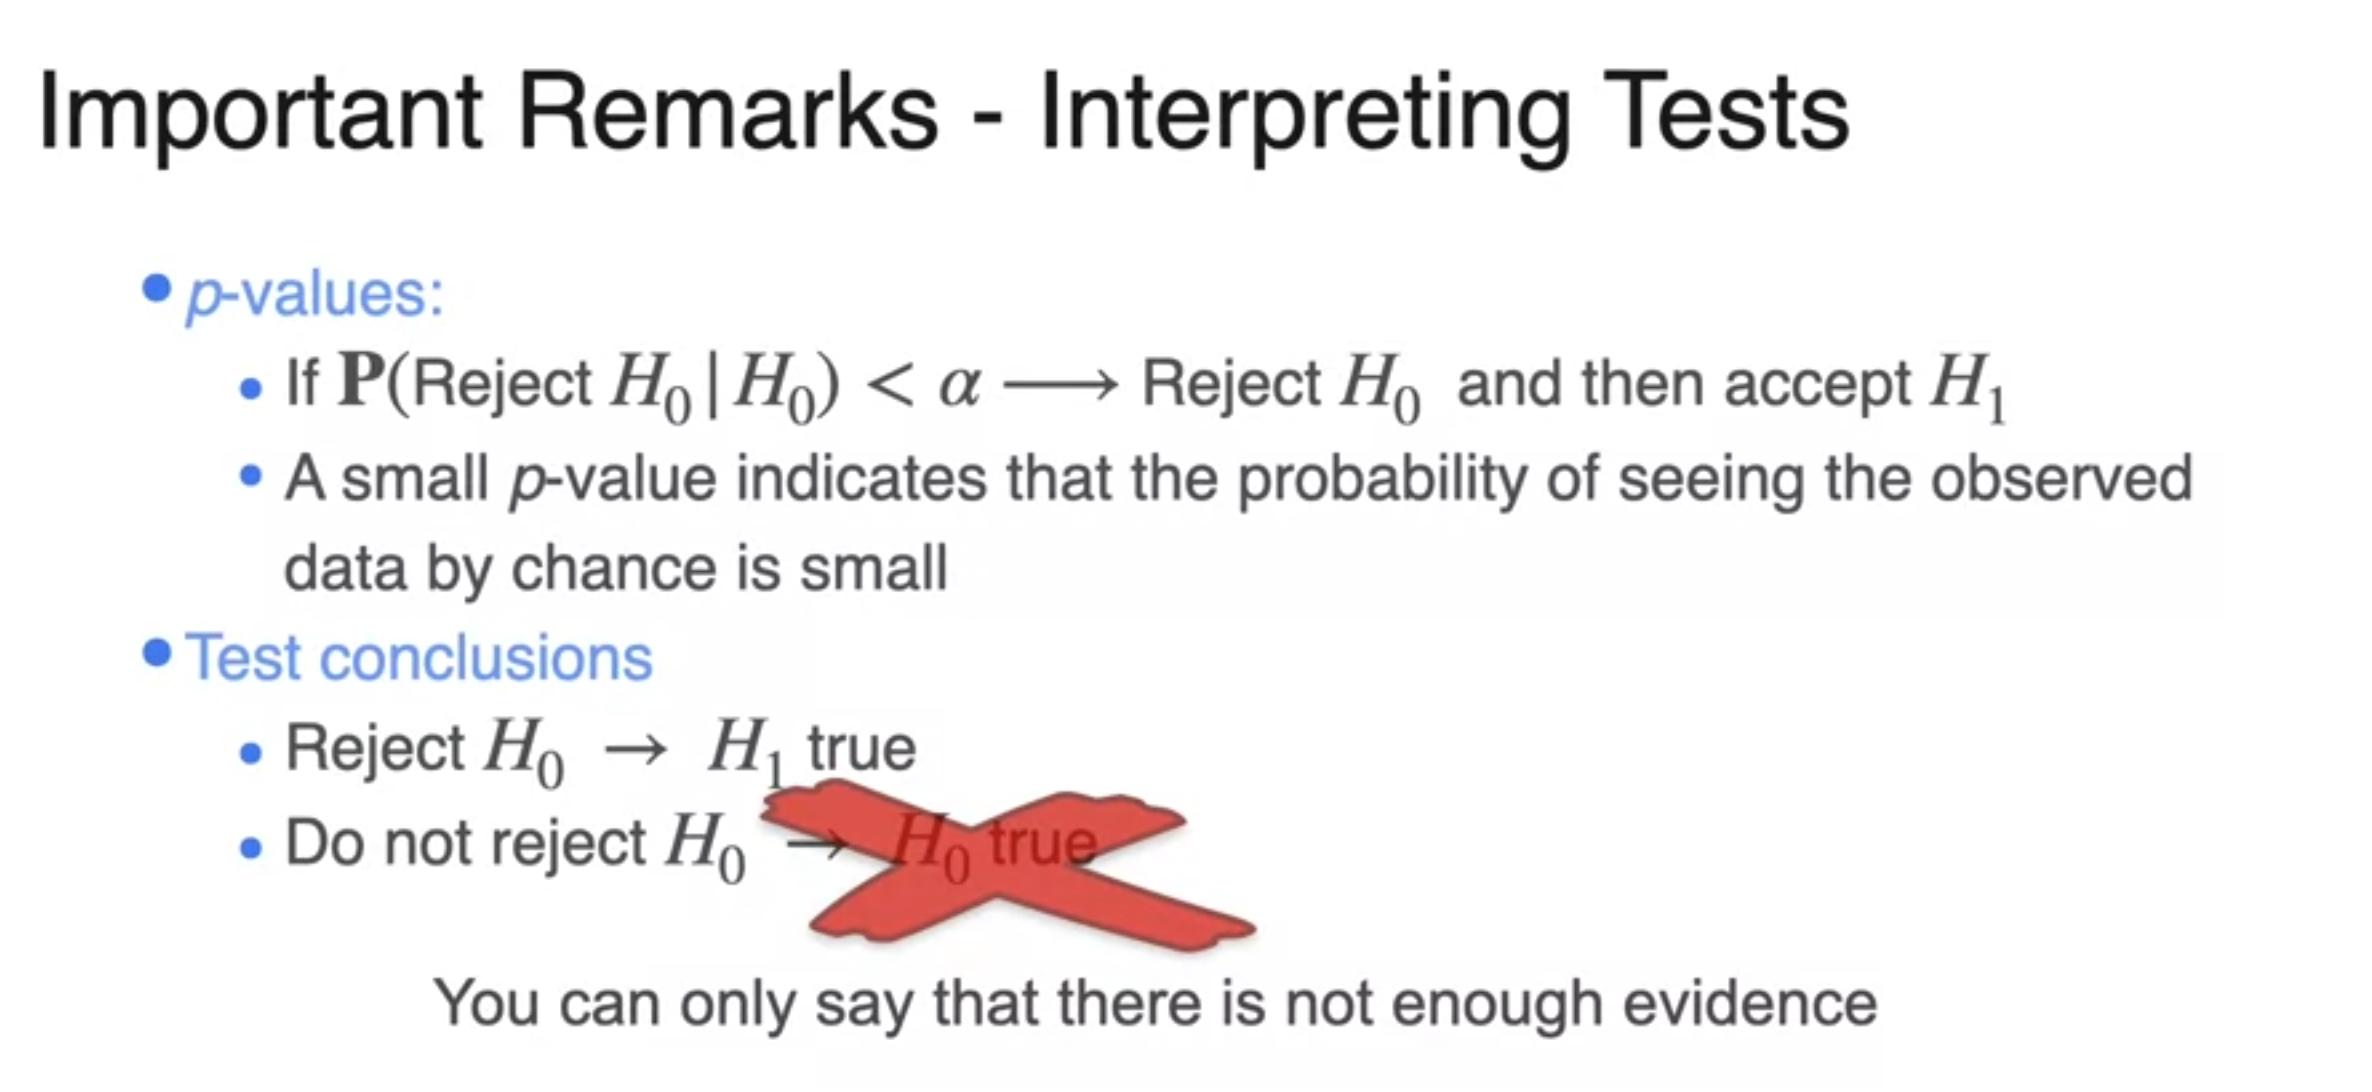
Interpreting Results
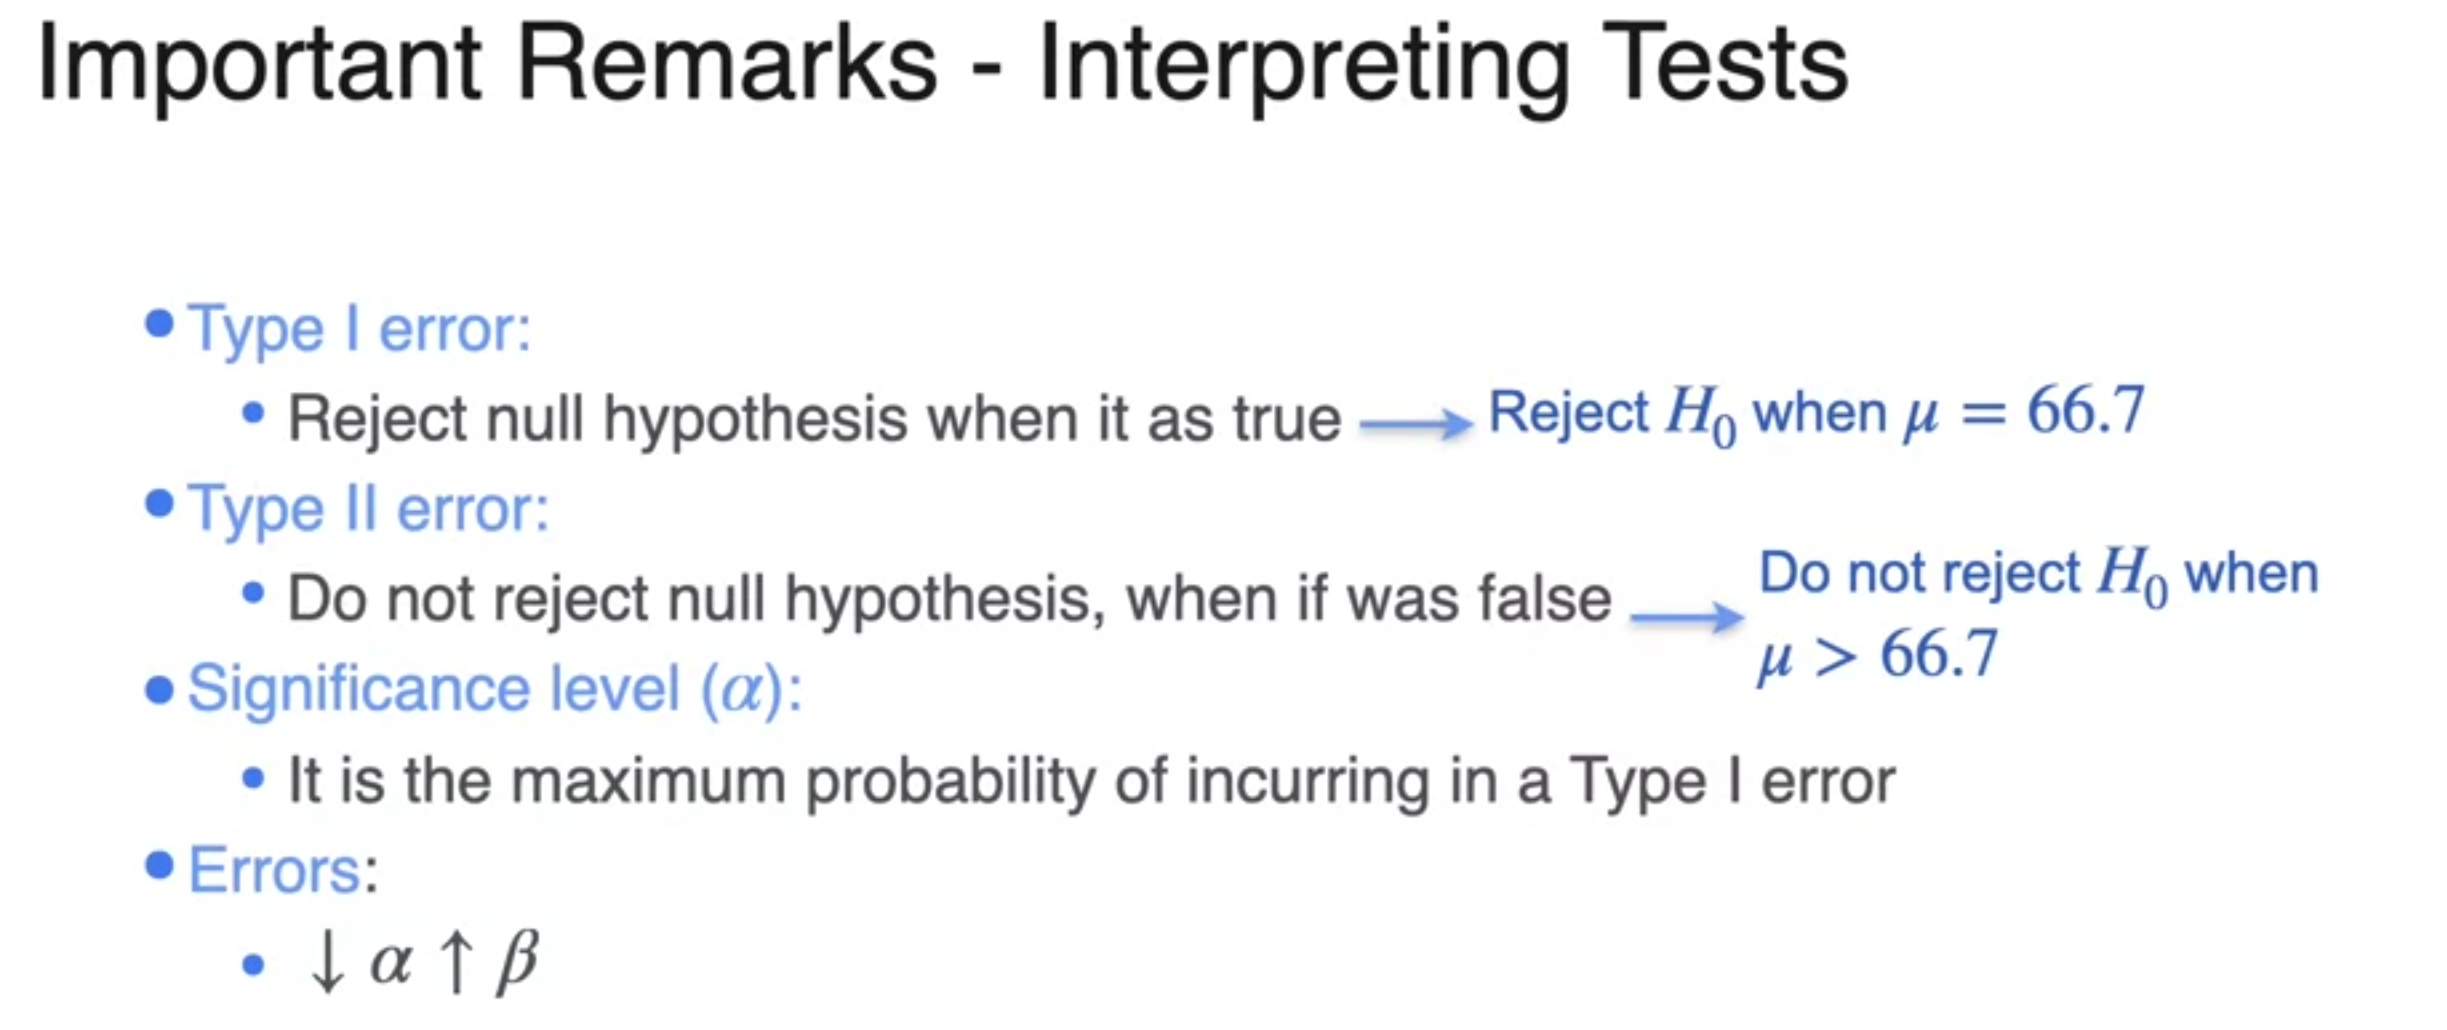
- for a fixed sample size, the type 1 and type 2 error probabilities are entangled.
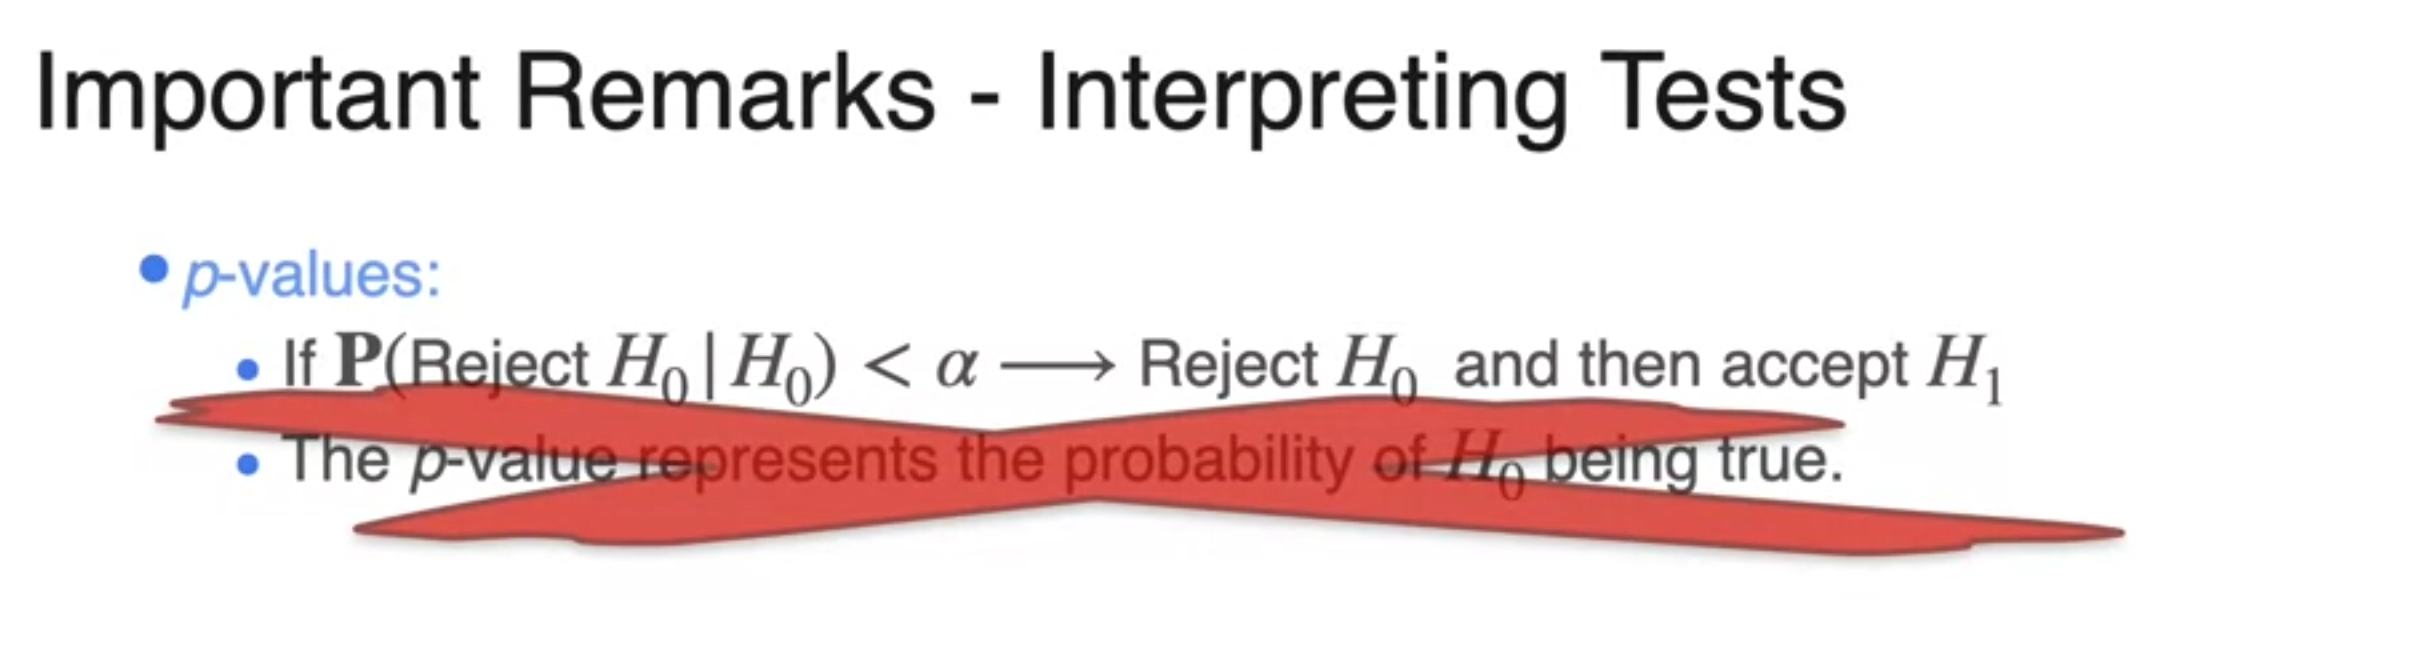
- small p-value rejects null hypothesis doesn't represent the probability that the hypothesis is true
- p-value represent seeing the observed data by chance
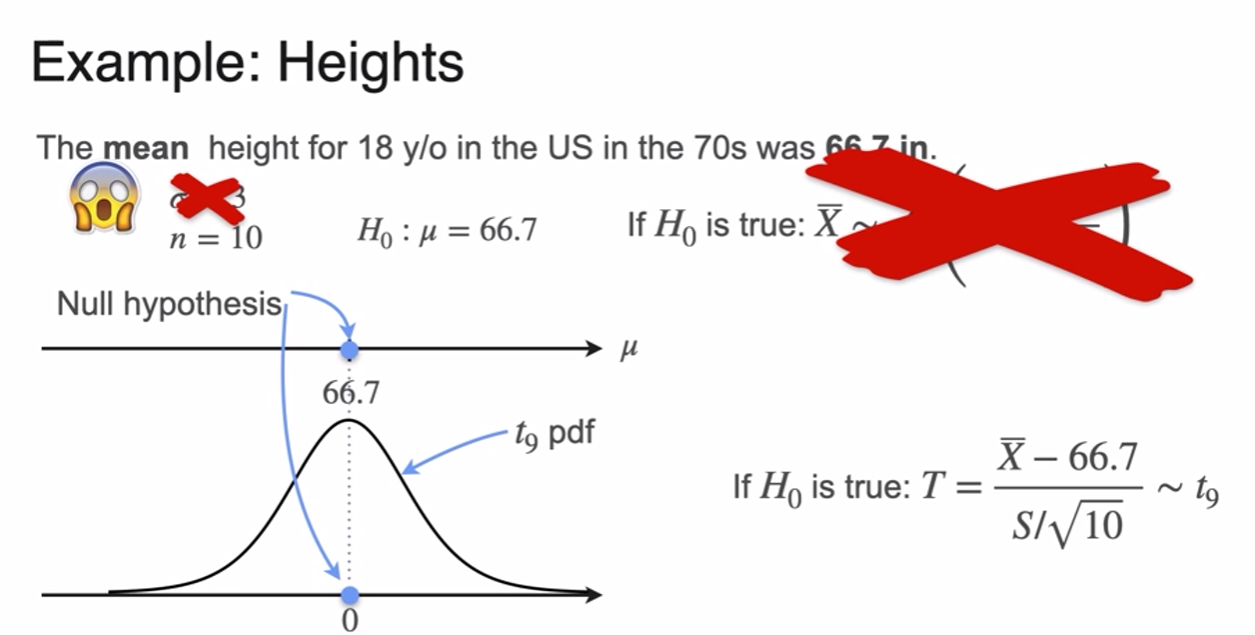
t-Distribution

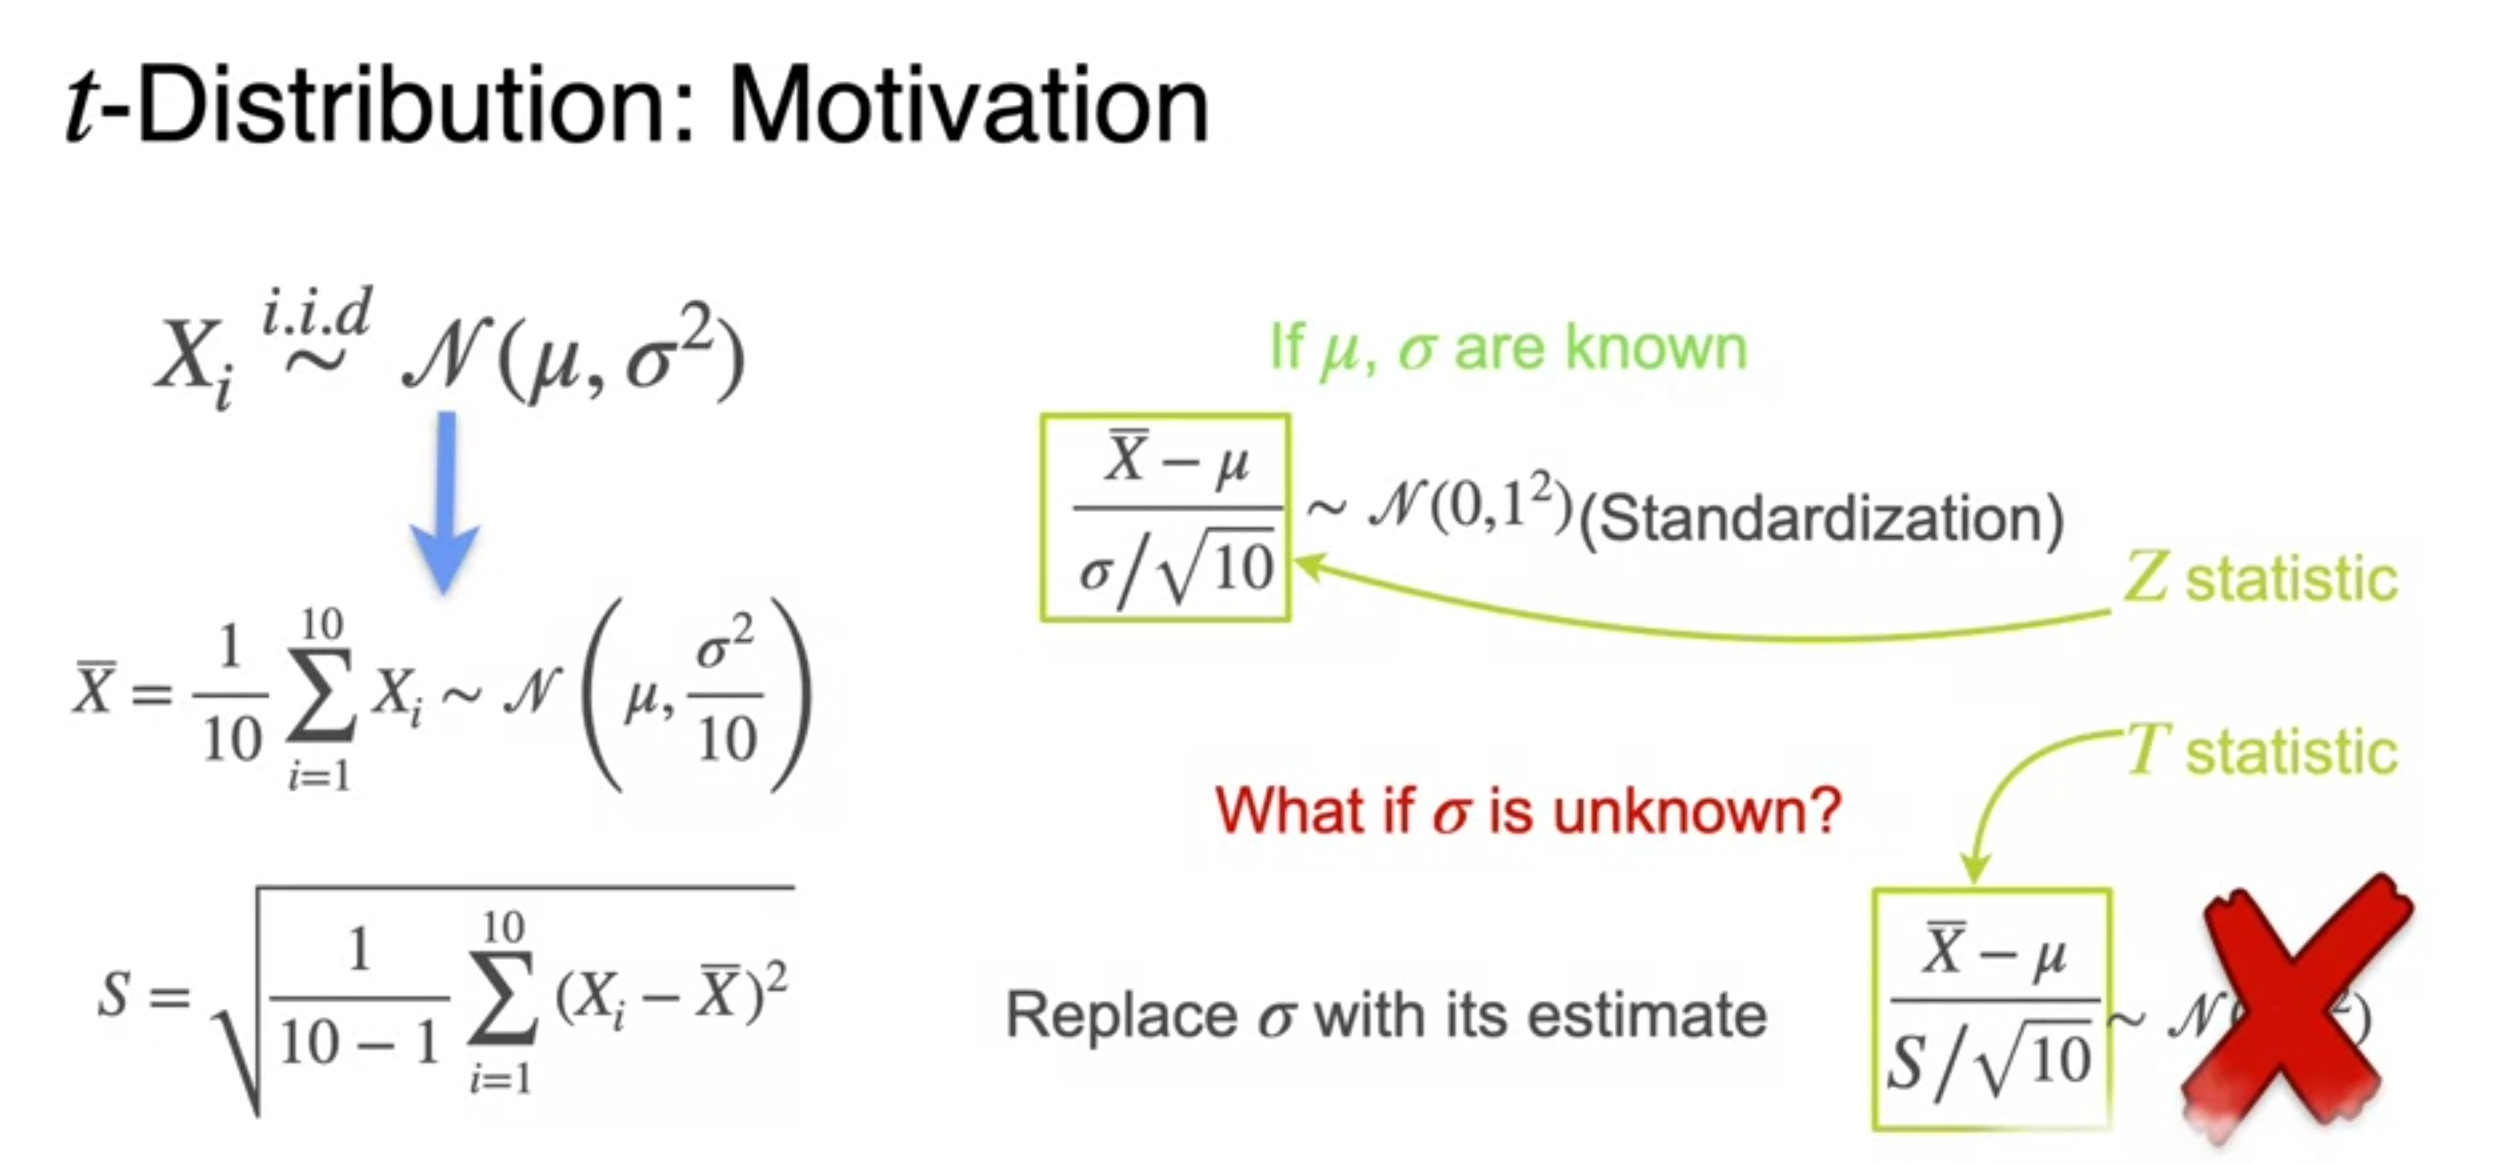
- you don't actually know sigma
- replace the sigma in the standardization formula by its estimate S
- S is almost variance of sample except you divide it by n-1
- but it follow t-distribution not normal distribution
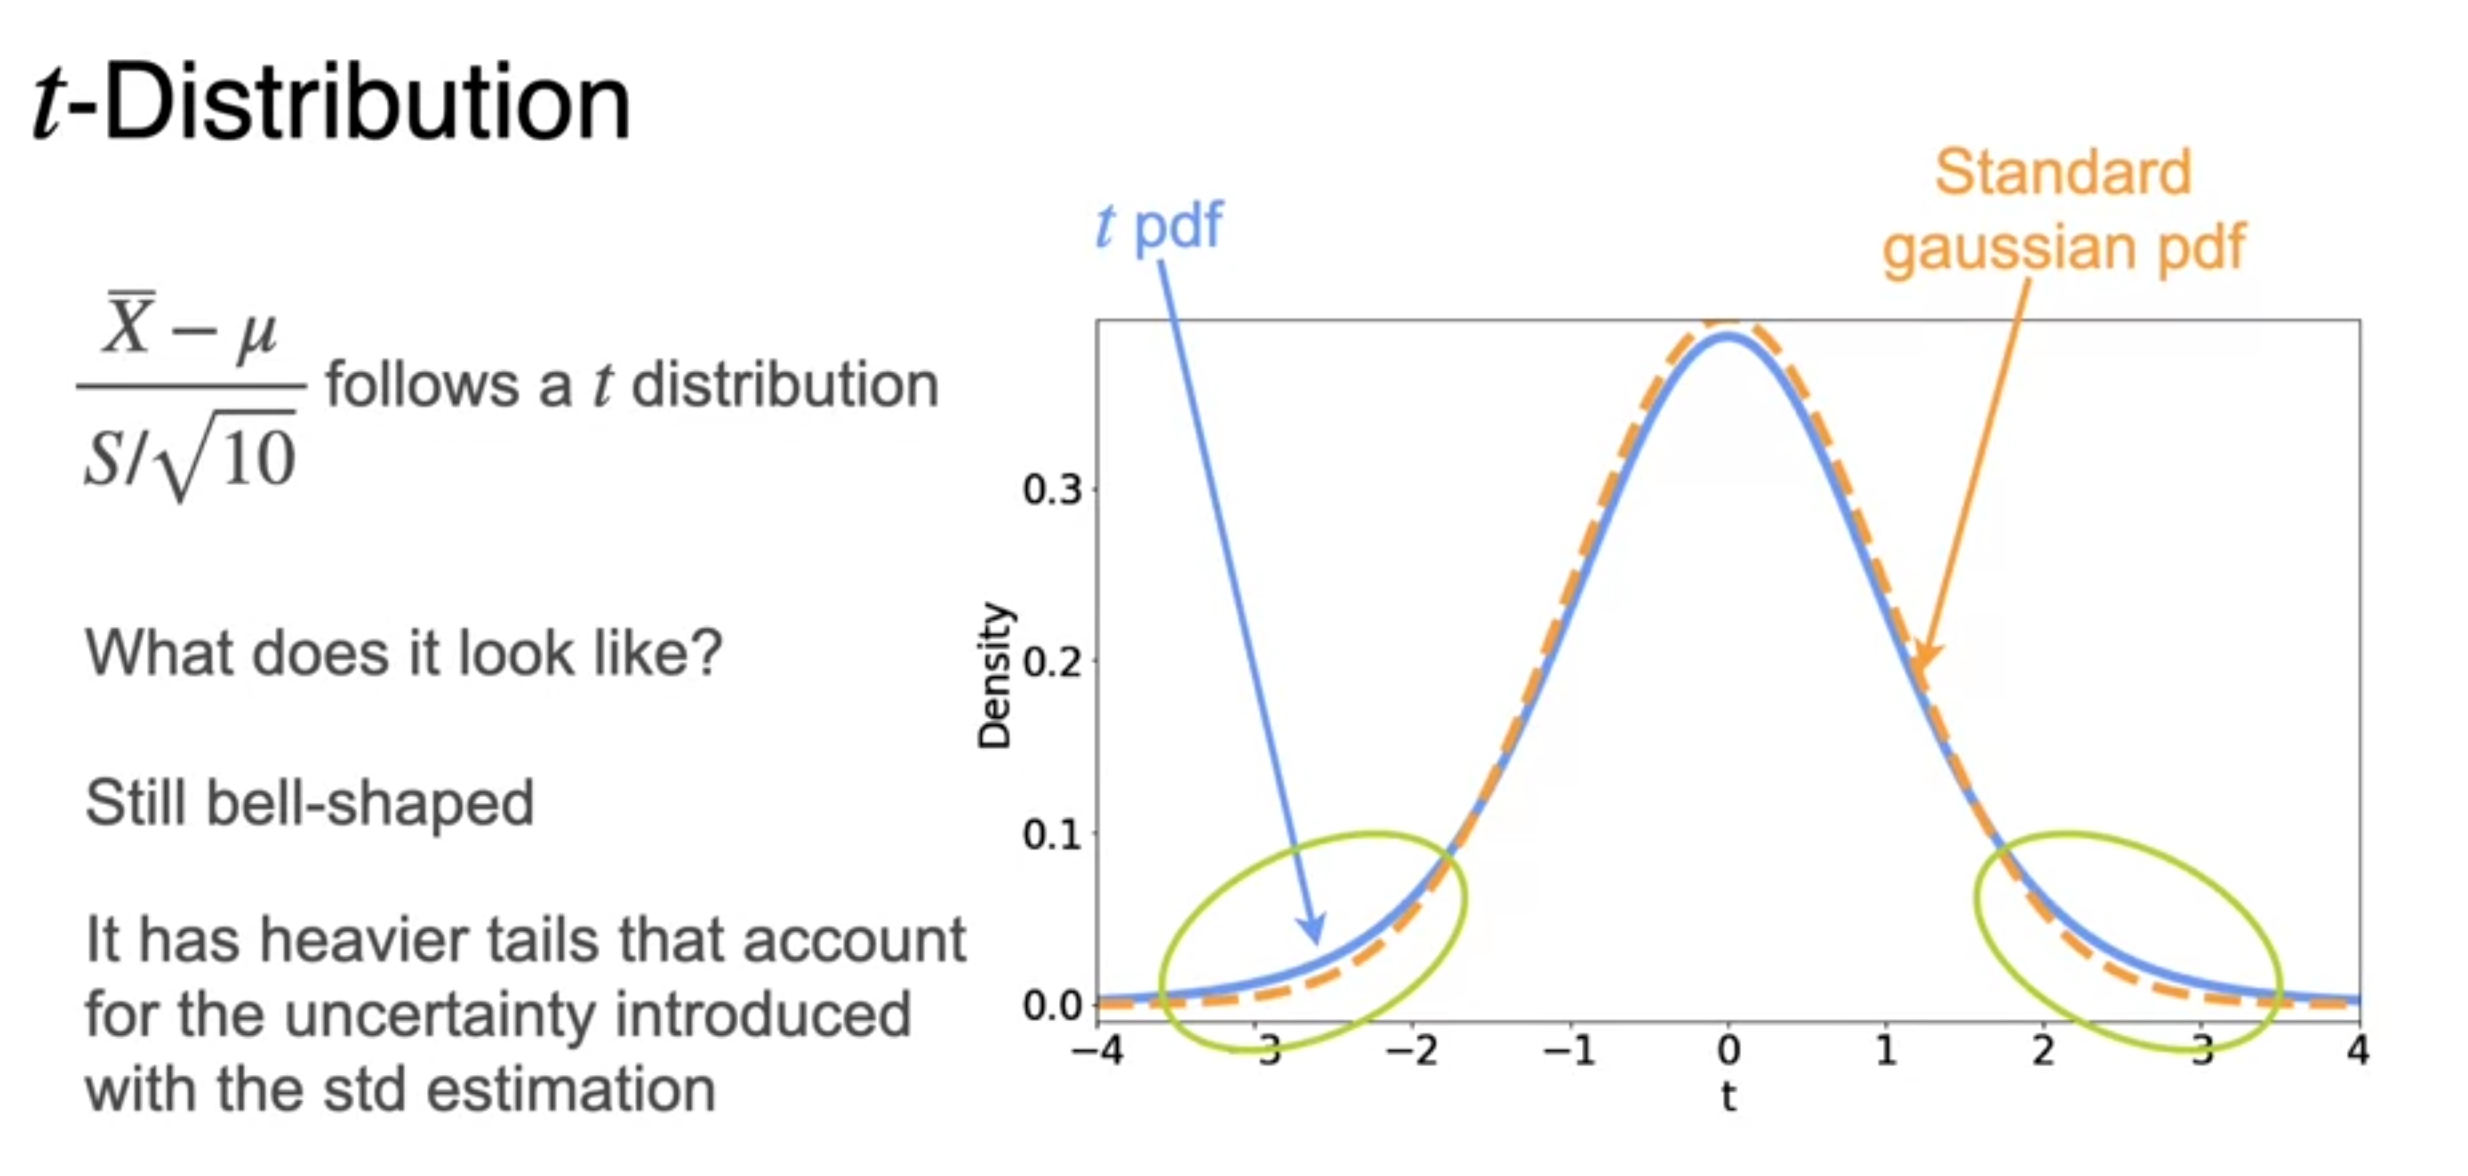
-
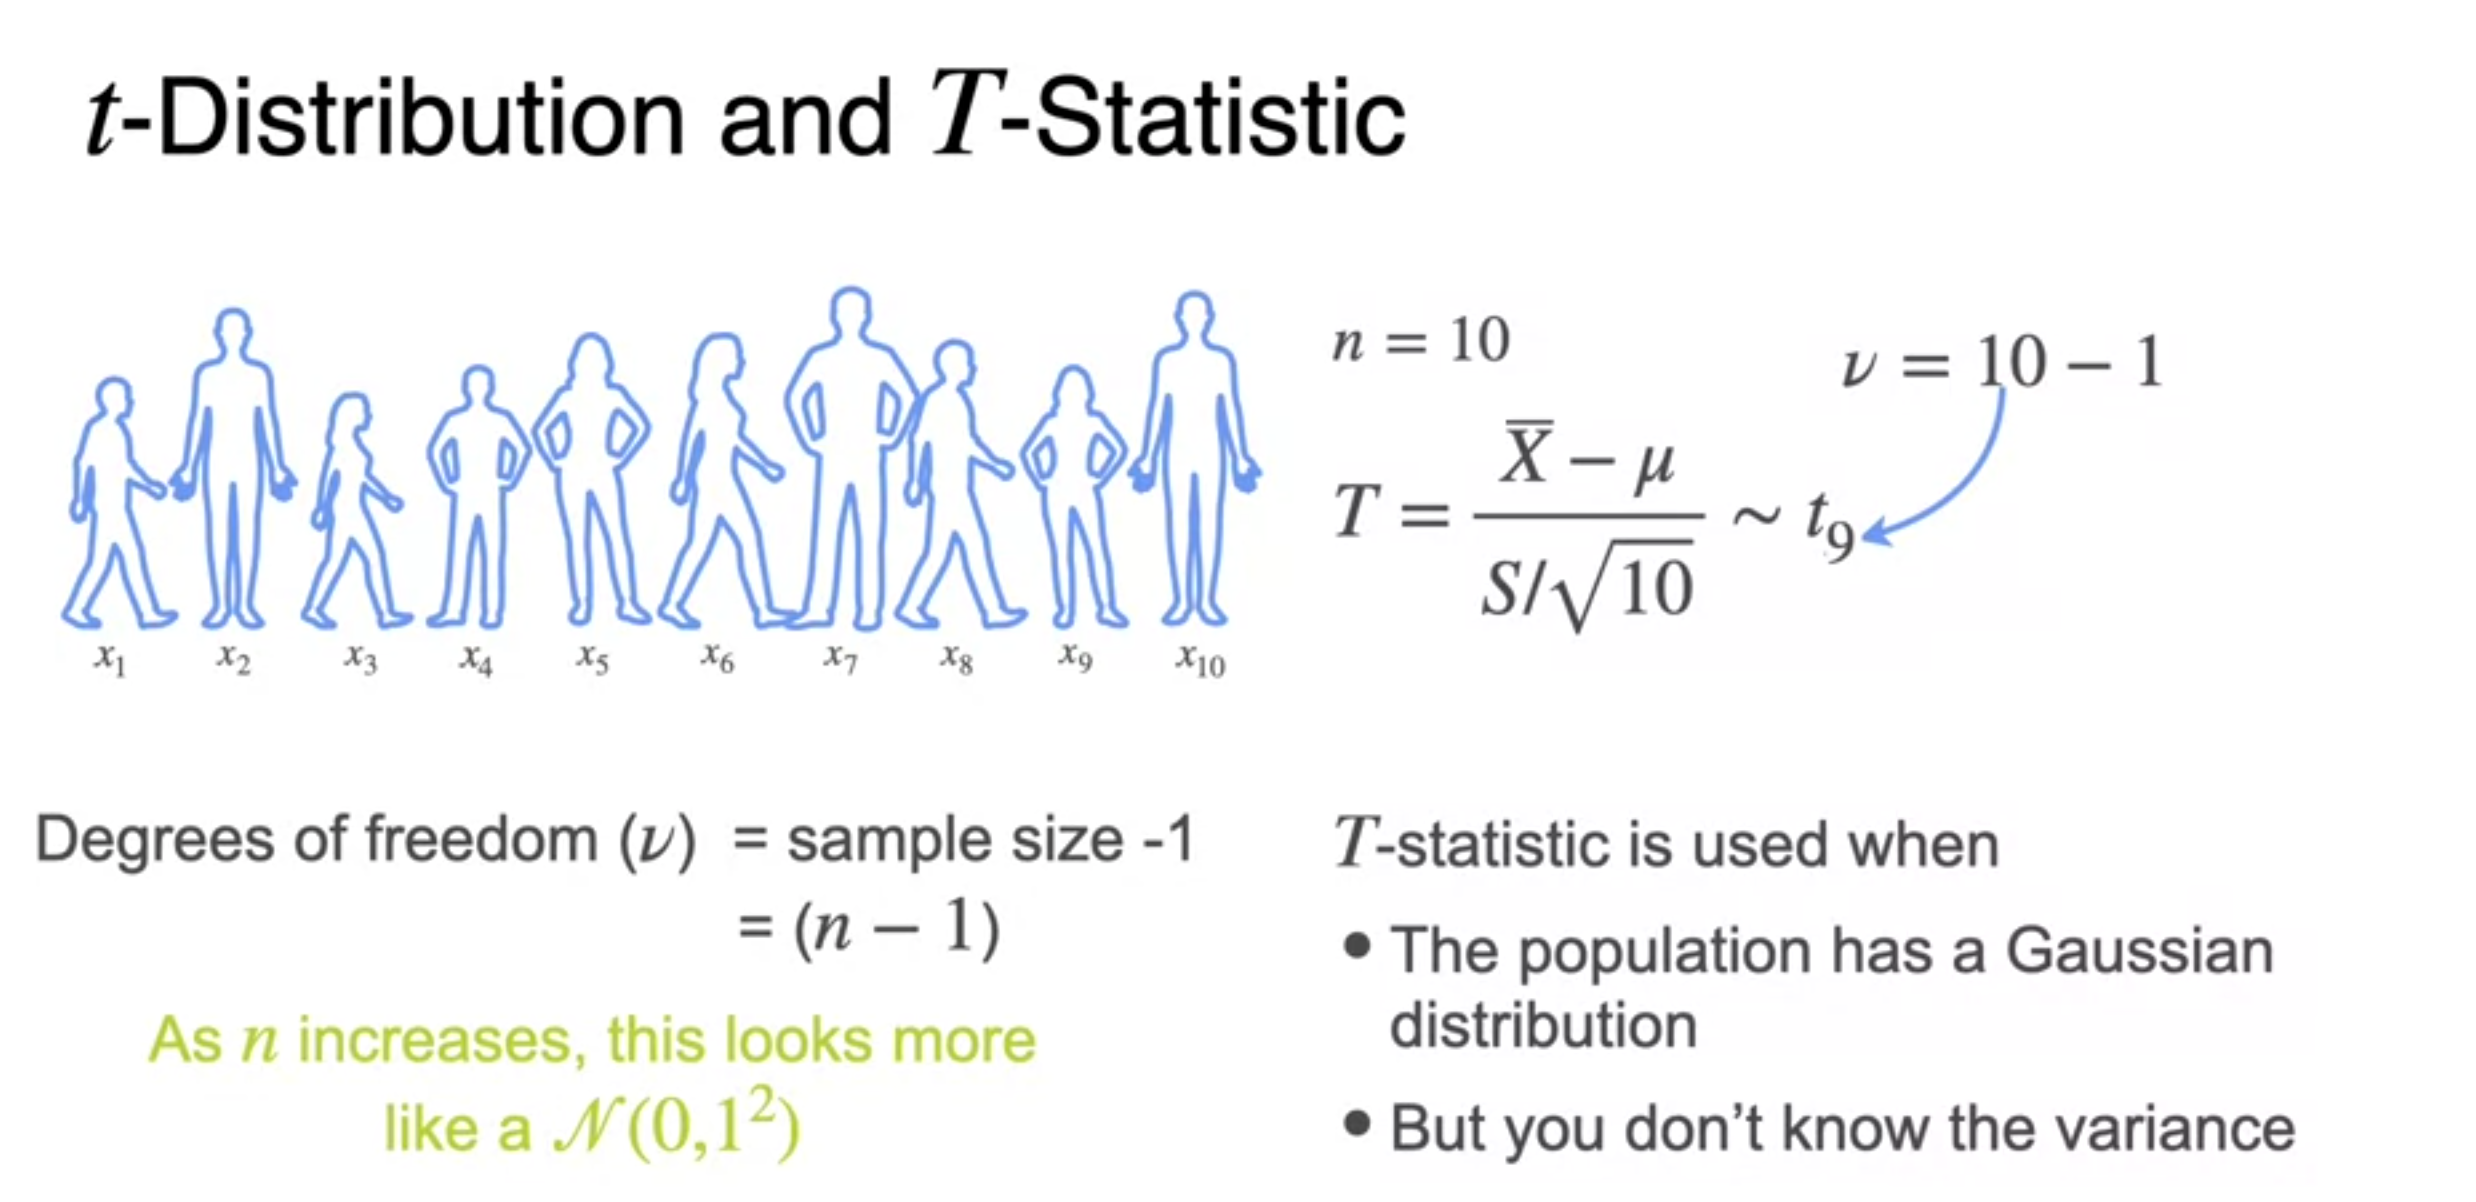
as the degrees of freedom increases
-
when is near 30 the Gaussian PDF and the TPF looks almost alike
- that's why we take 30 samples because t-distribution and the Gaussian are very similar
t-Tests
Two Sample t-Test
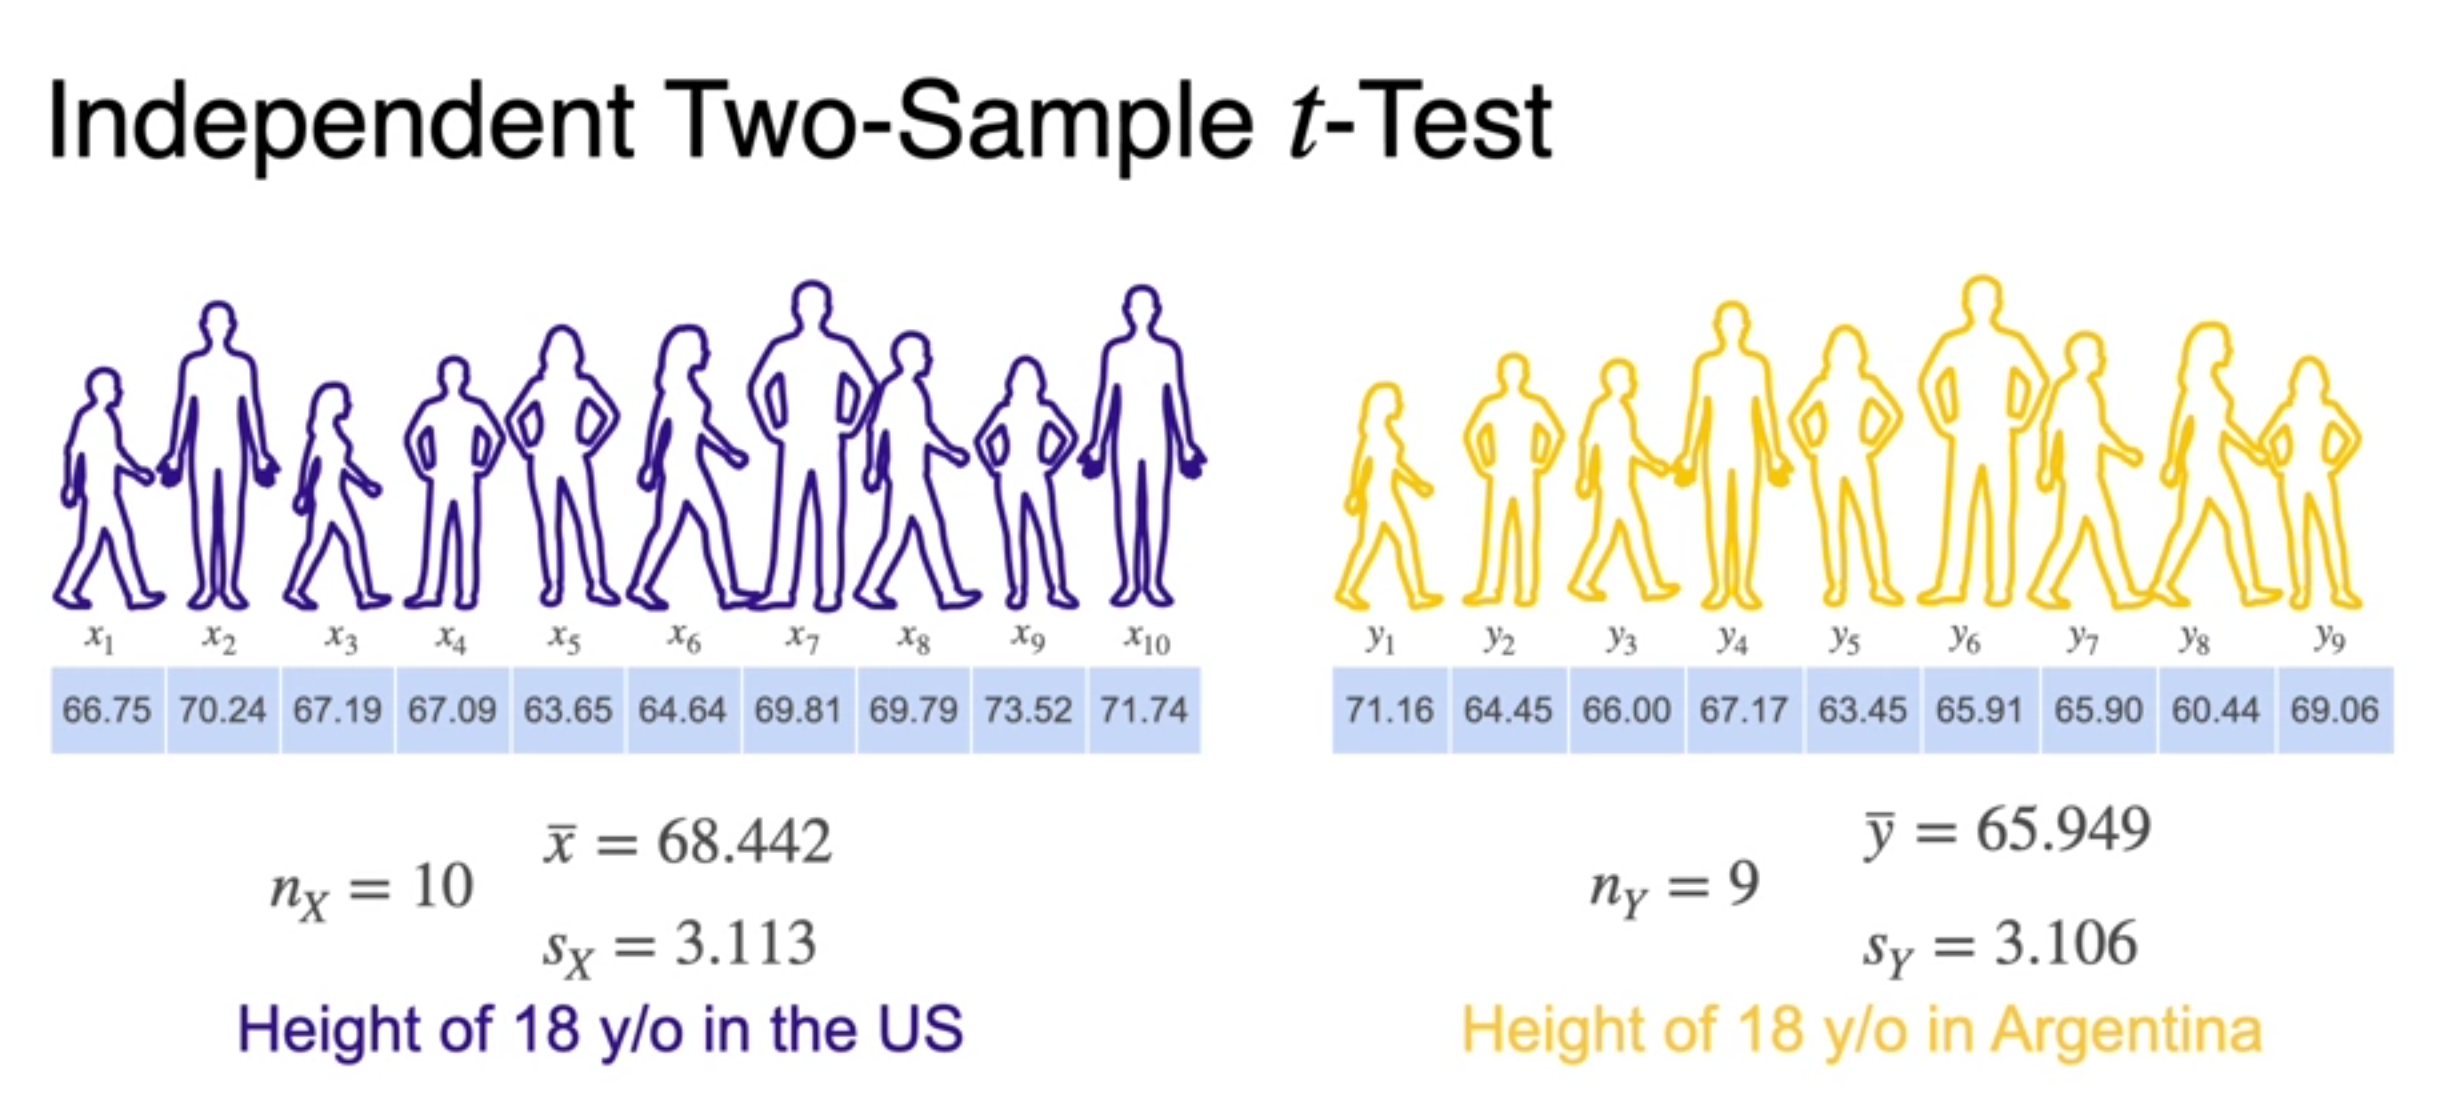
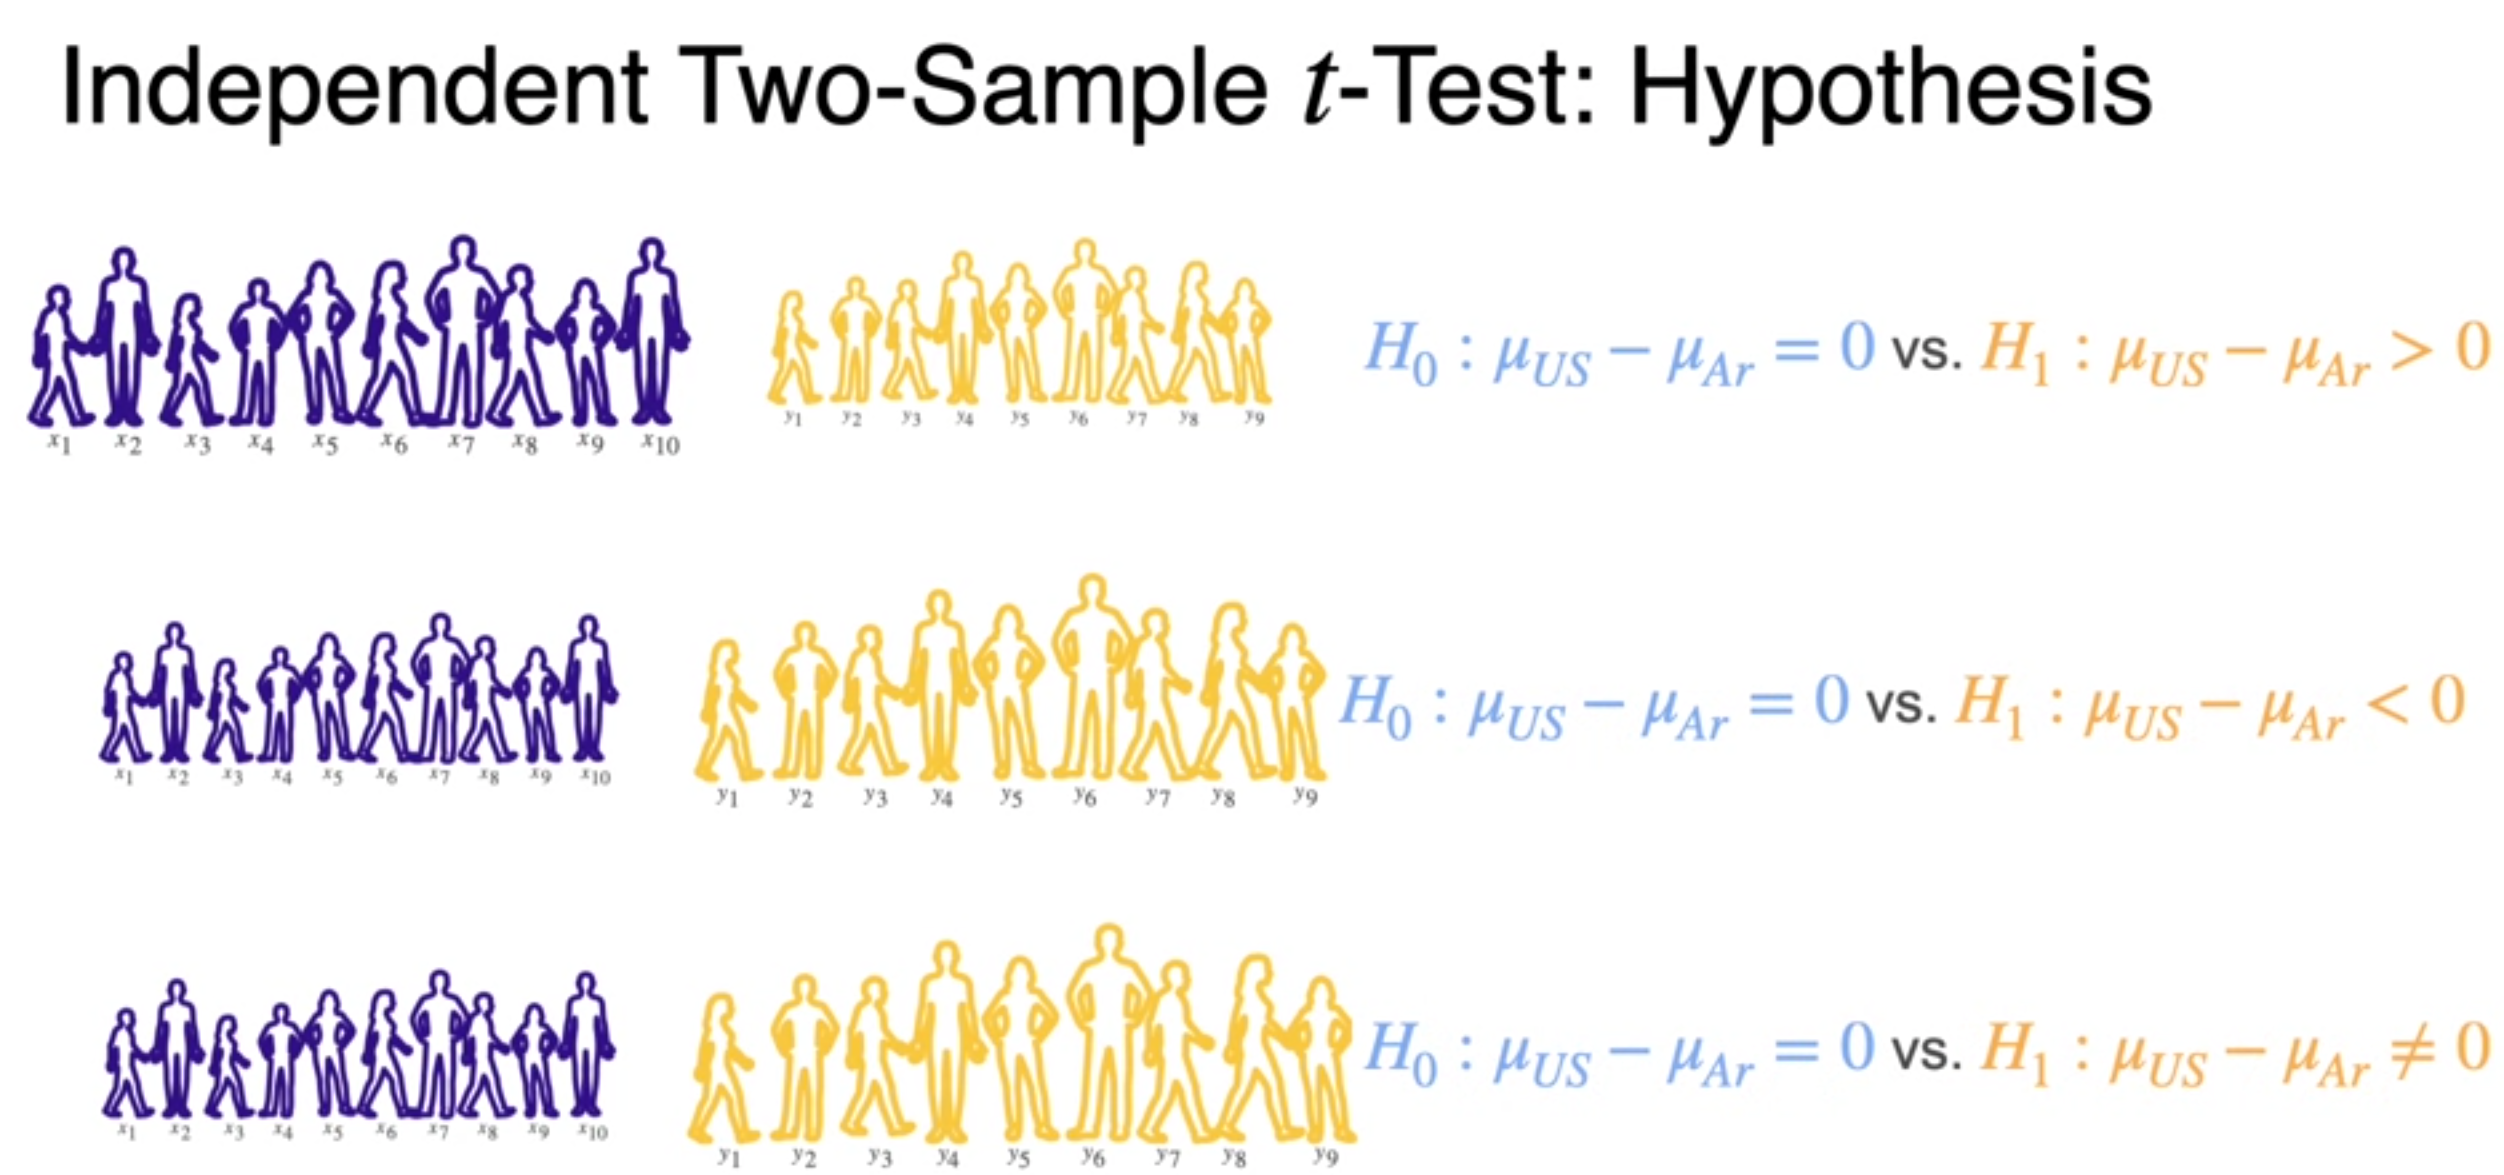
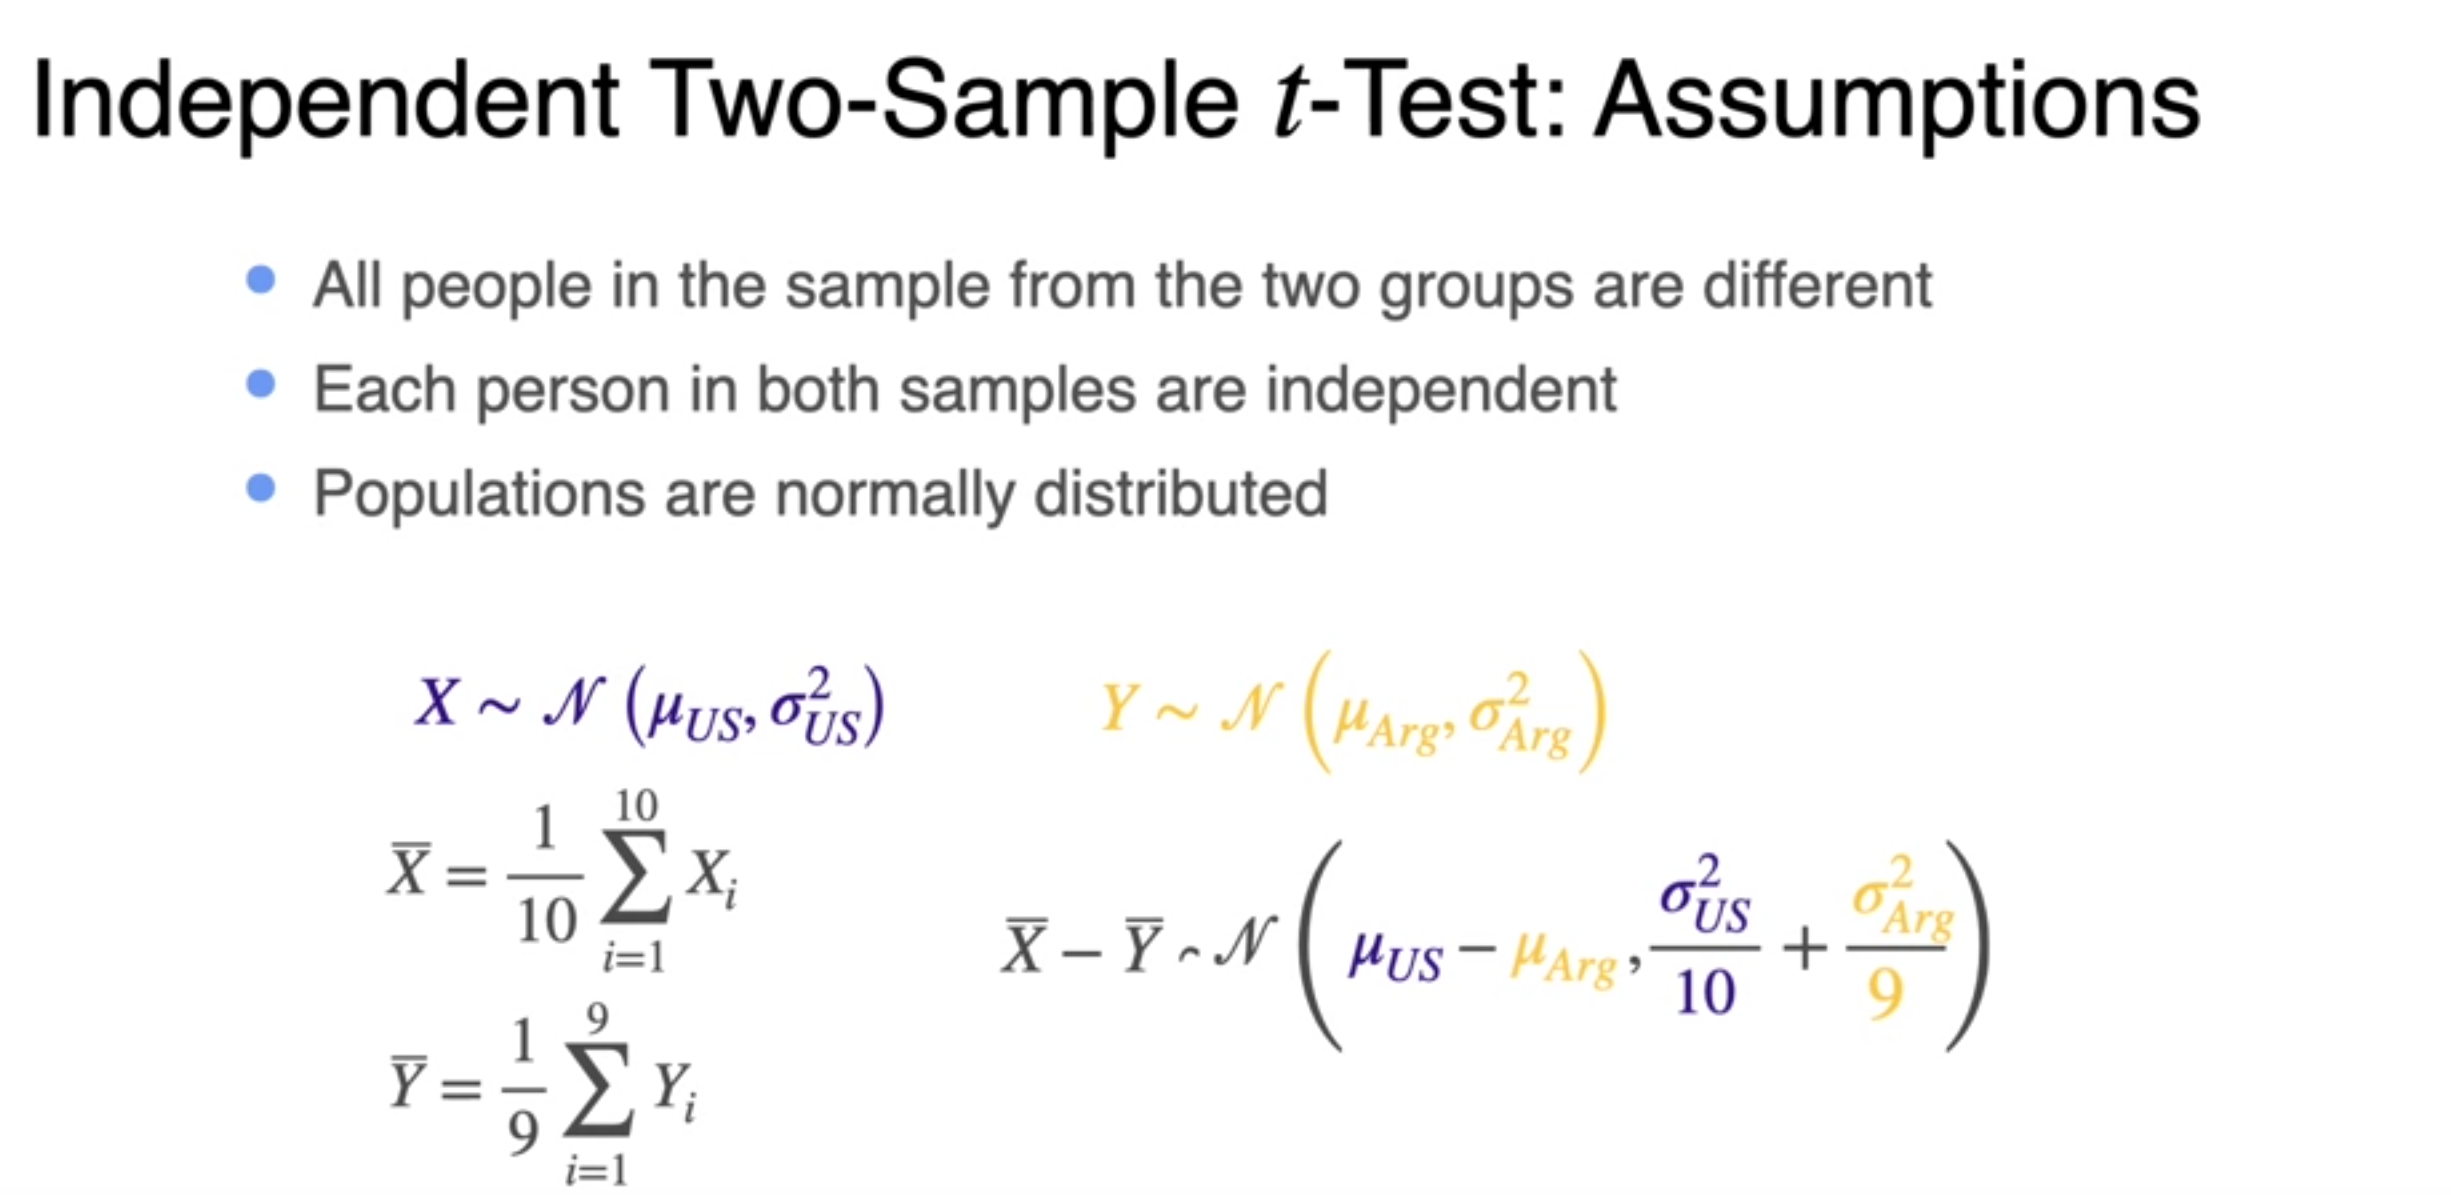
- uses difference between population means
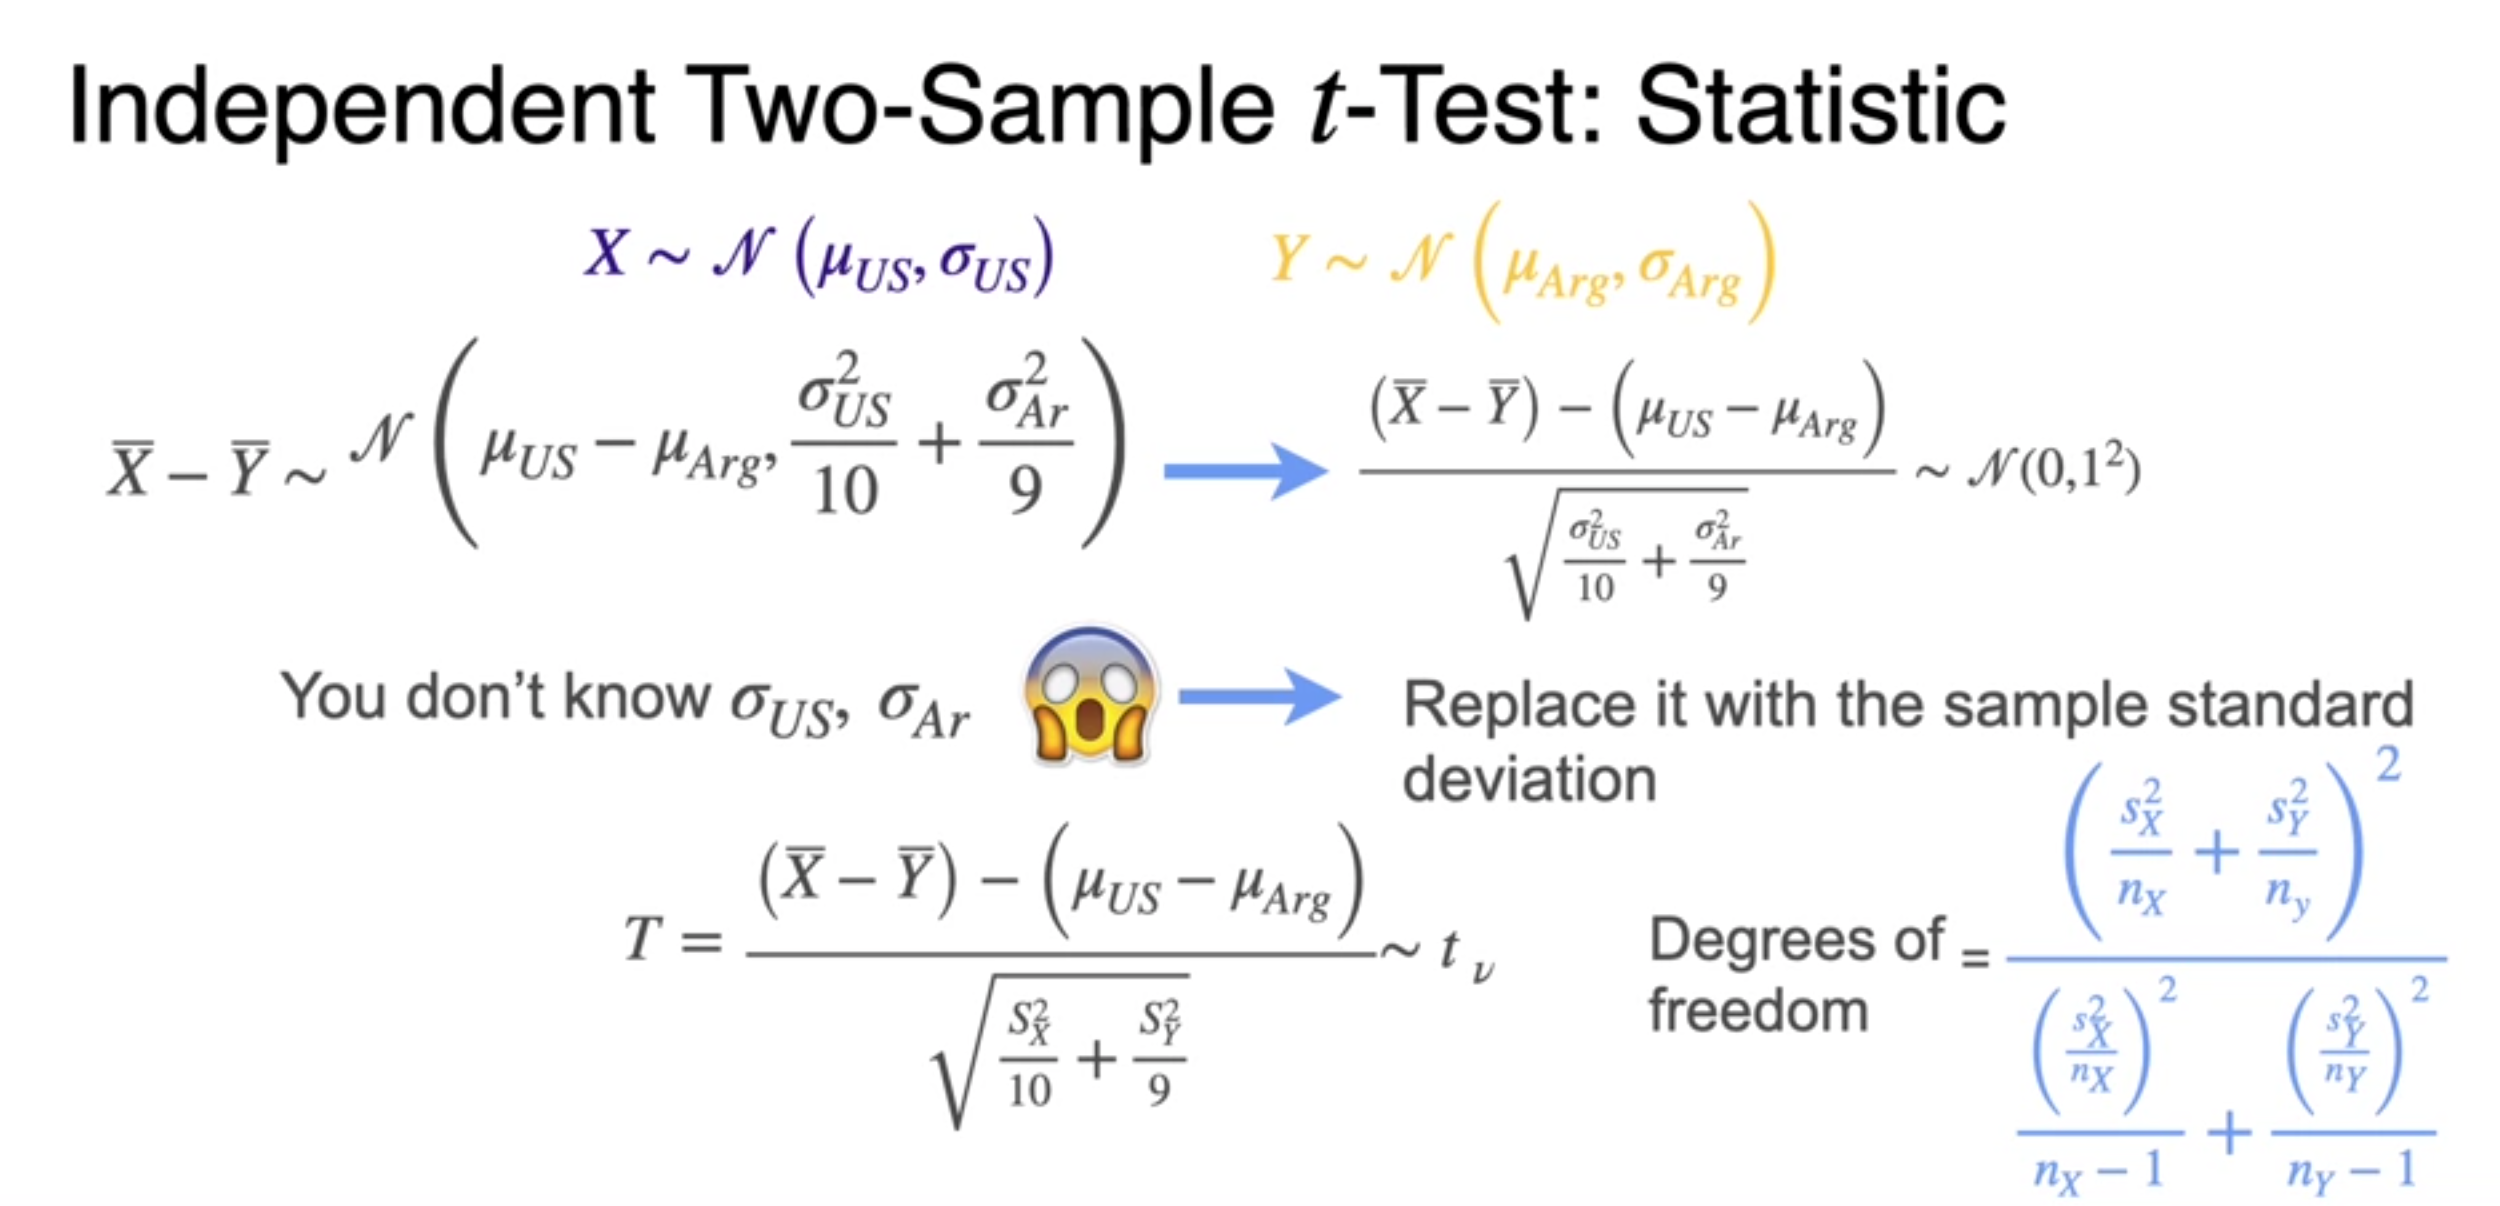
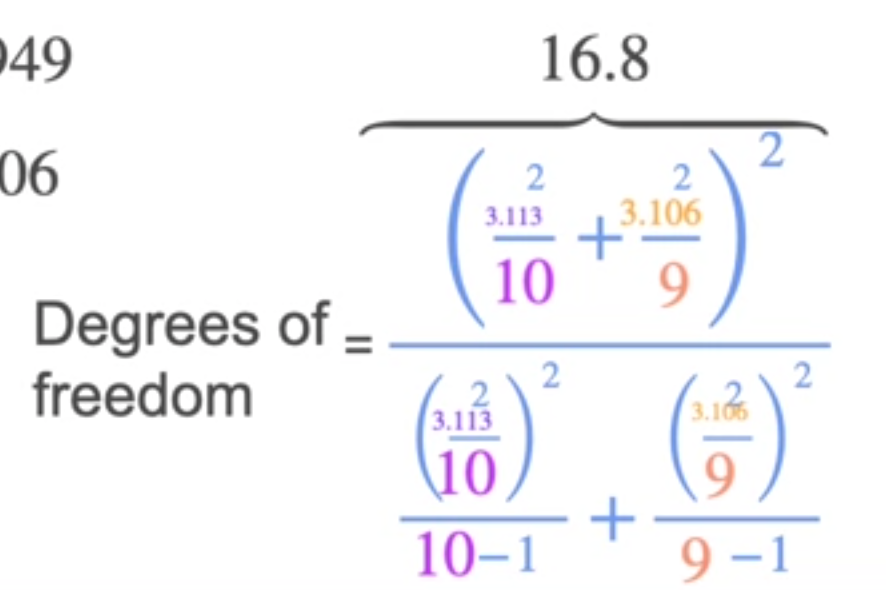
- very complicated Degrees of freedom calculation
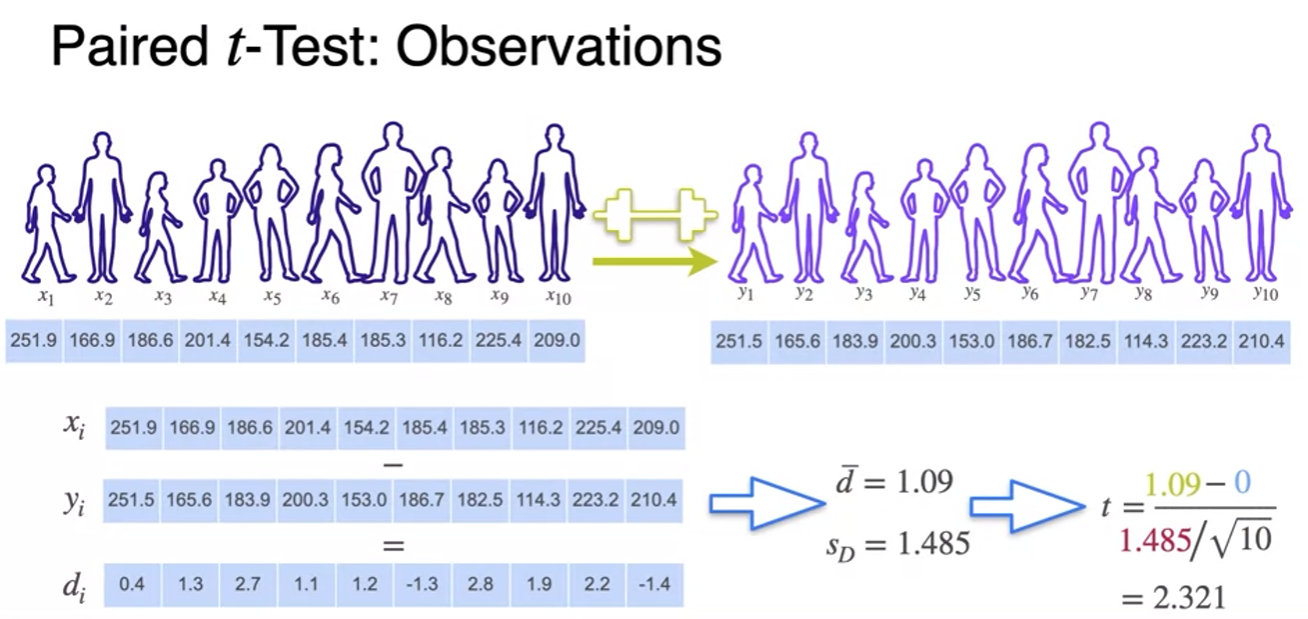
Paired t-Test
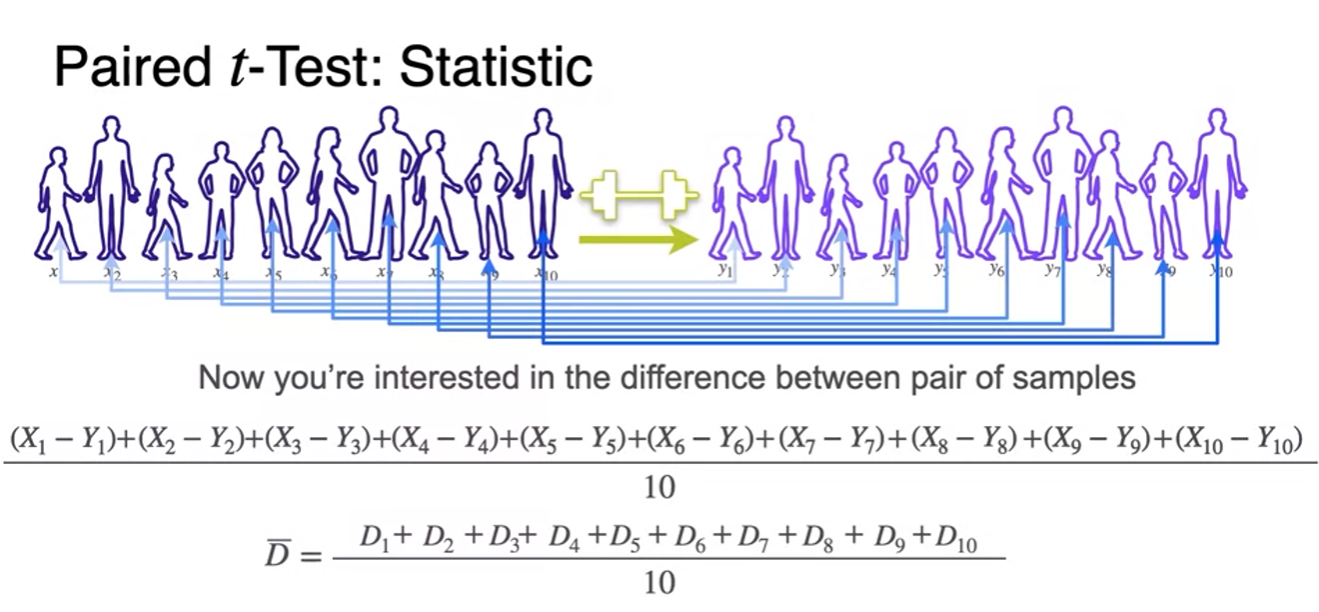

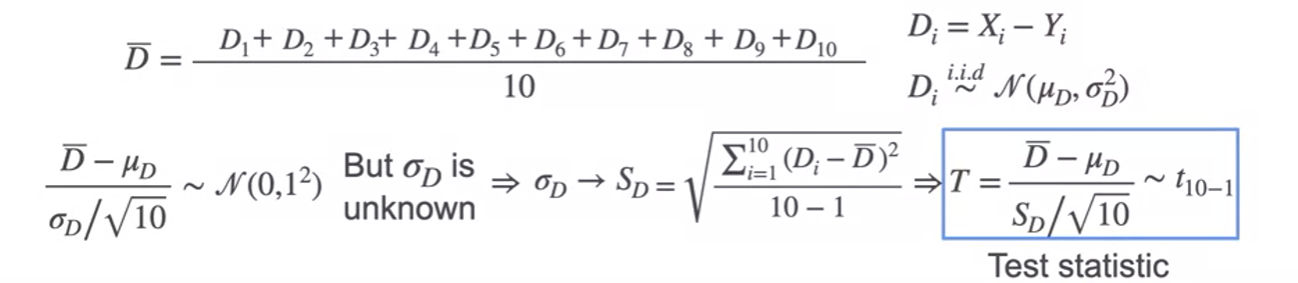
- replace population standard deviation(unknown) by the sample standard deviation
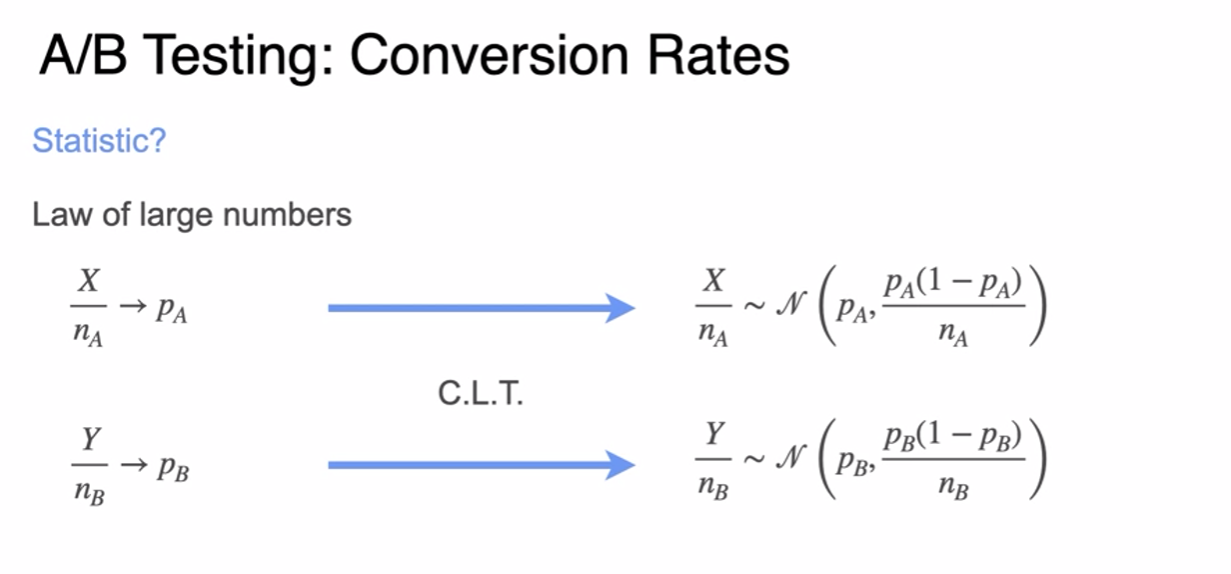
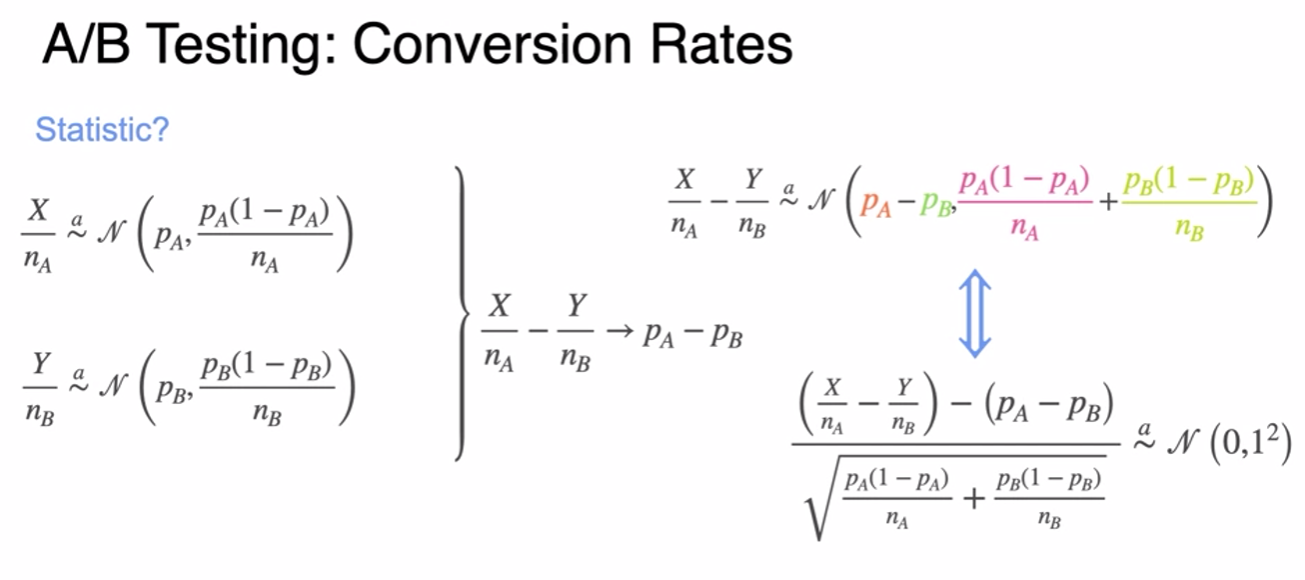
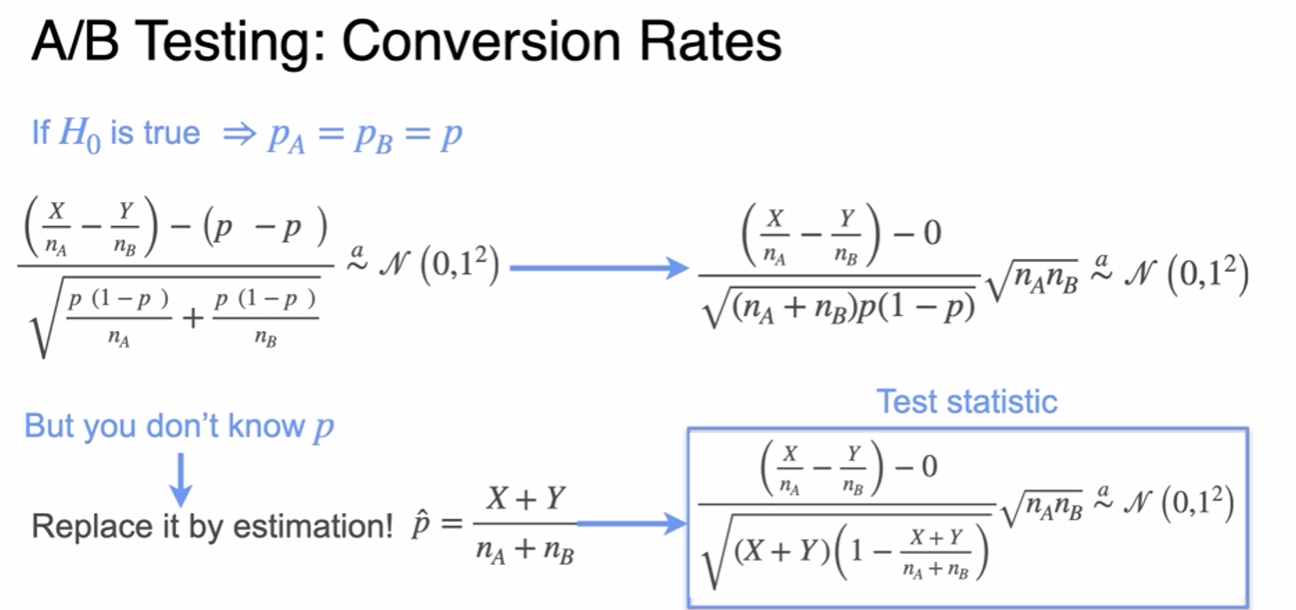
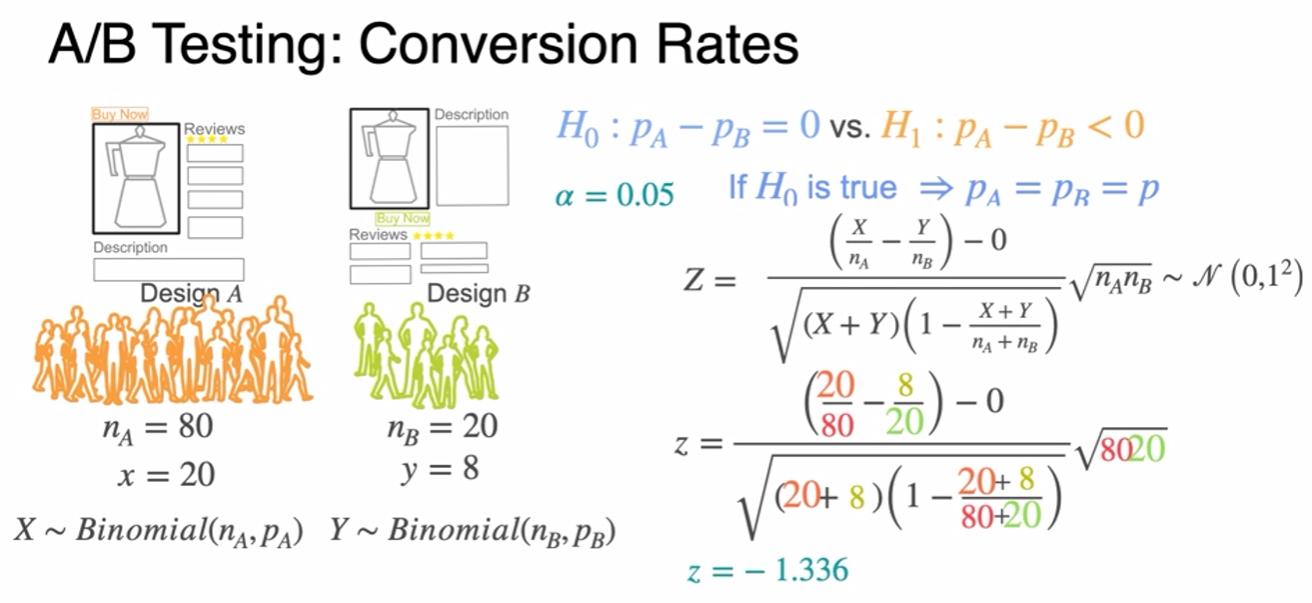
ML Application: A/B Testing
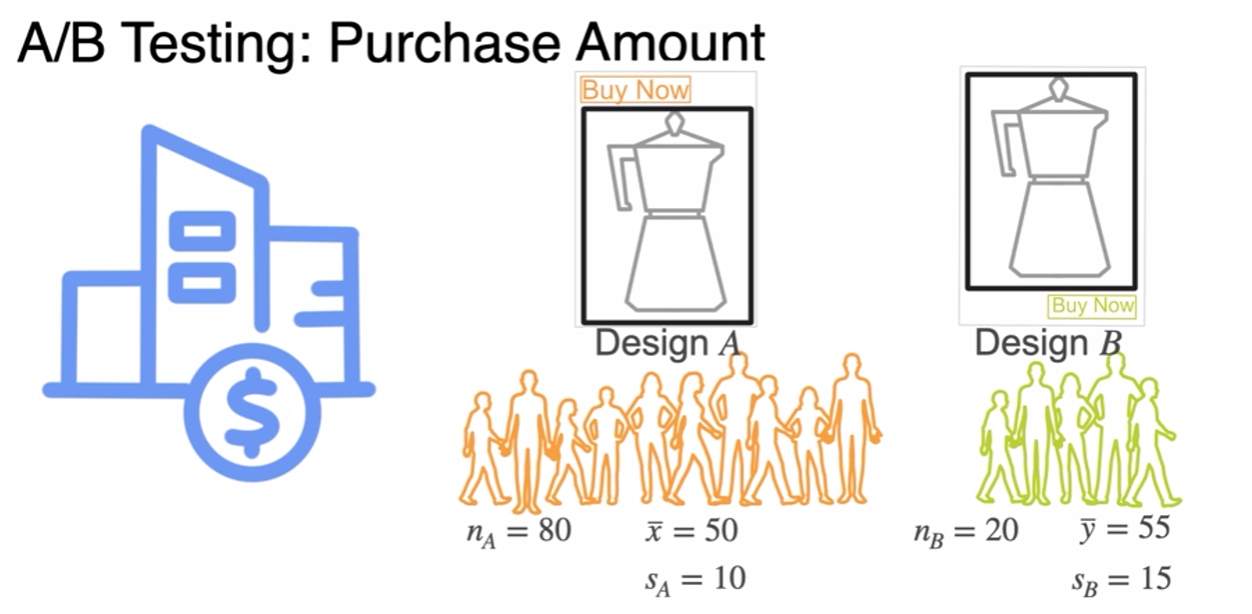
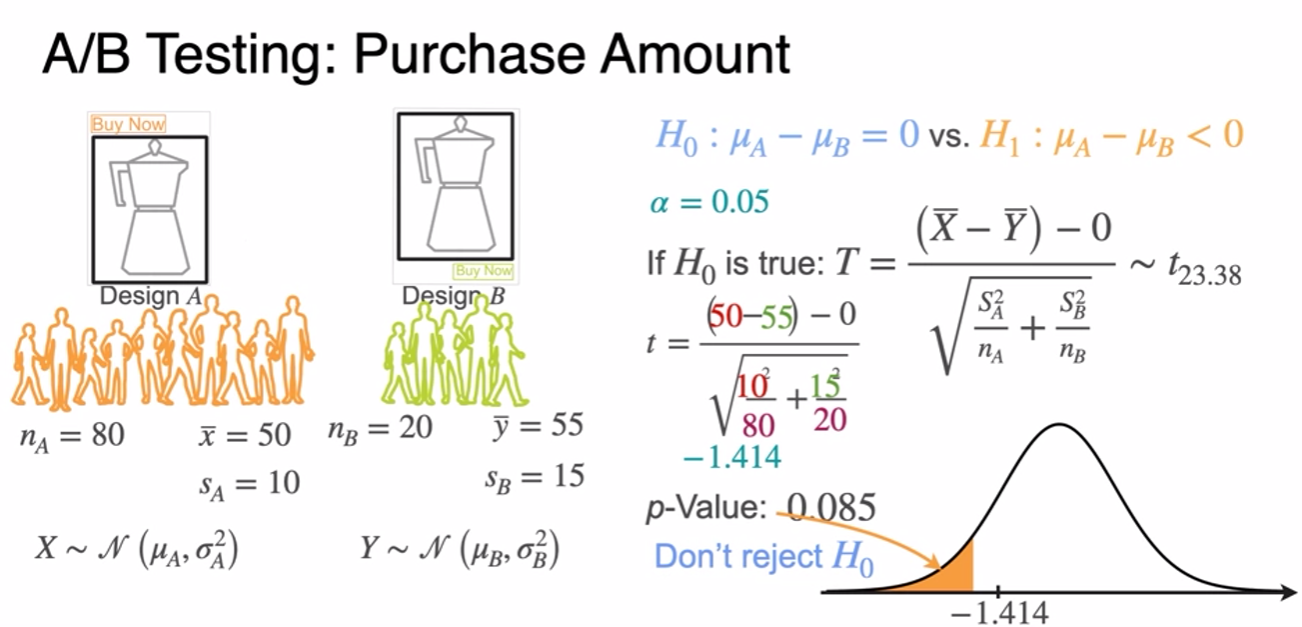
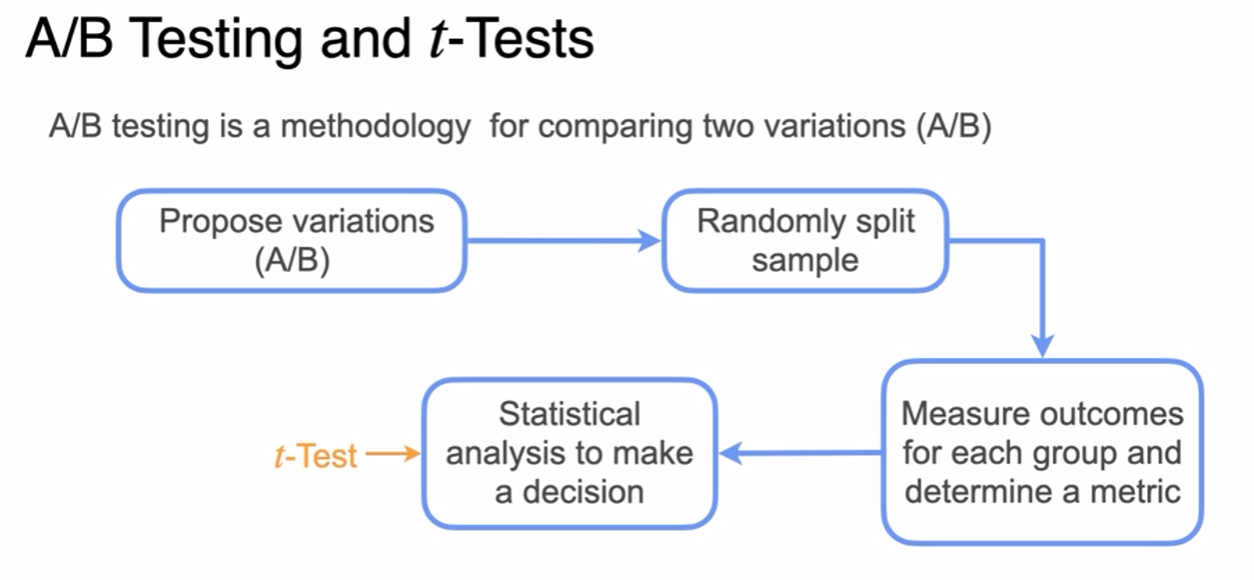
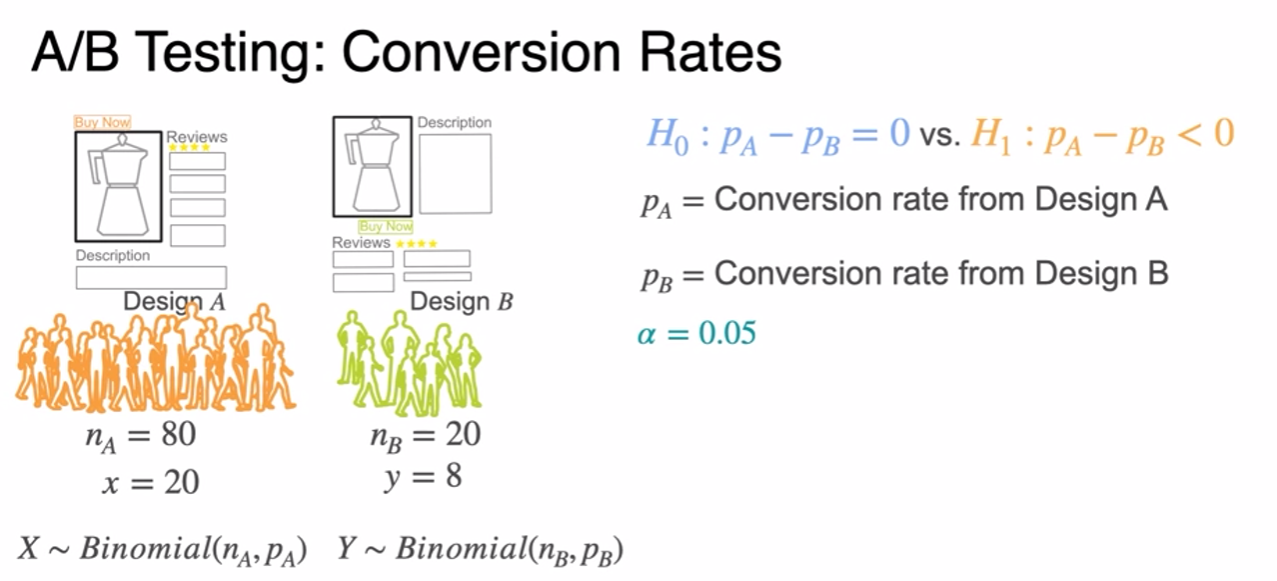
- is B better?