공부 내용
- Matplotlib에서 Text
- Text Properties
- 추가 Text API
Matplotlib에서 Text
Text in Viz
-
시각화에서 Text 사용 이유
- Visual representation들이 줄 수 없는 설명을 추가해 줌
- 잘못된 전달에서 생기는 오해 방지 가능
-
하지만 Text를 과하게 사용한다면 이해를 방해할 수도 있다
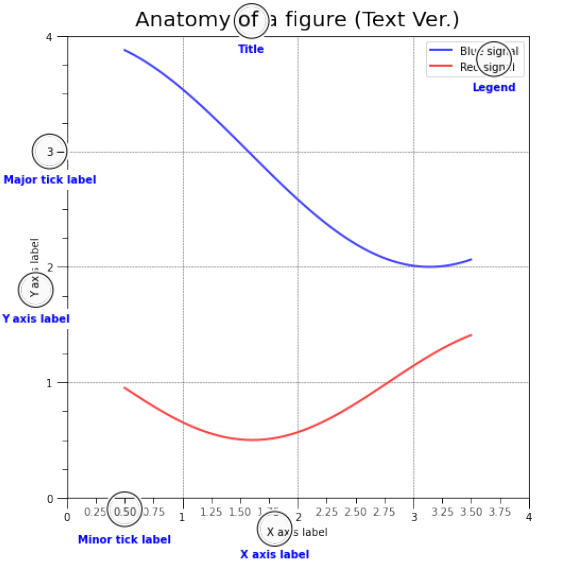
Anatomy of a Figure
- Title : 가장 큰 주제를 설명
- Label : 축에 해당하는 데이터 정보 제공
- Tick Label : 축 눈금을 사용해서 스케일 정보 추가
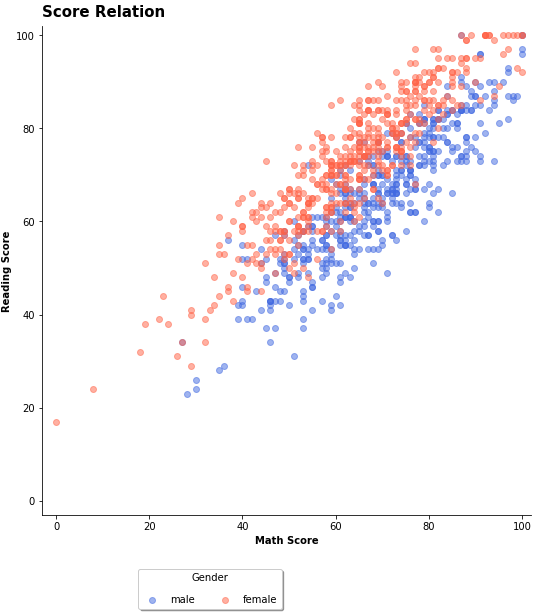
- Legend : 한 그래프에서 2개 이상의 서로 다른 데이터를
분류하기 위해 사용하는 보조 정보(범례) - Annotation : 그 외 시각화에 대한 설명 추가
Text API in Matplotlib
| pyplot API | Object-oriented API | description |
|---|---|---|
suptitle | suptitle | figure 제목 |
title | set_title | ax subplot 제목 |
xlabel | set_xlabel | x축 label |
ylabel | set_ylabel | y축 label |
figtext | text | figure text |
text | text | Axes text |
annoatate | annotate | Axes annotation with arrow |
Text Properties
Font Components
- 글씨체 관련 변환 요소
- family (글씨체)
- size or fontsize (글씨 크기)
- style or fontstyle (글씨 스타일)
- weight or fontweight (글씨 두께)
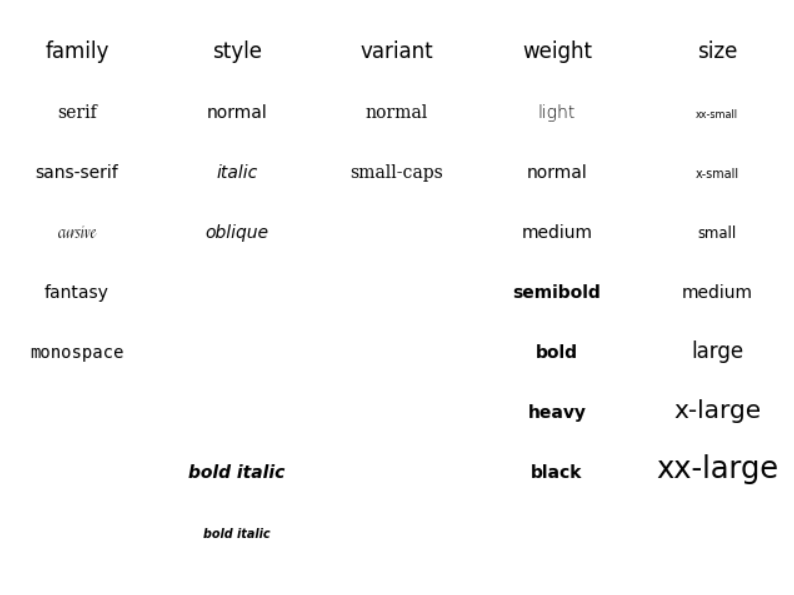
출처 : https://matplotlib.org/stable/gallery/text_labels_and_annotations/fonts_demo.html
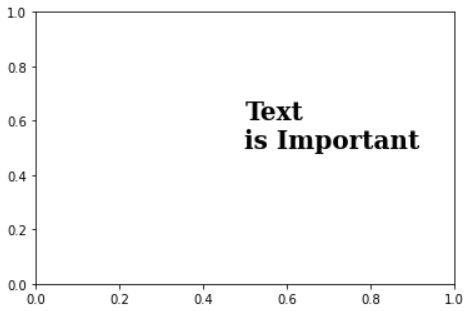
Code
ax.text(x=0.5, y=0.5, s='Text\nis Important',
        fontsize=20, # 글씨 크기
        fontweight='bold', # 두께
        fontfamily='serif', # 글씨체
       )
Detail
- 폰트 자체와는 약간 다르지만 커스텀 할 수 있는 요소
- color (글씨 색깔)
- linespacing (줄간격)
- backgroundcolor (배경색)
- alpha (투명도)
- zorder (z축 위치)
- visible (표시 여부)
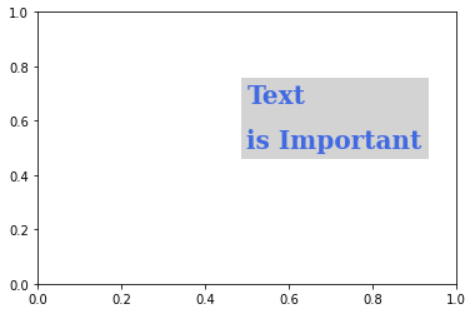
Code
ax.text(x=0.5, y=0.5, s='Text\nis Important',
        fontsize=20, # 크기
        fontweight='bold', # 두께
        fontfamily='serif', # 글씨체
        color='royalblue',# 글씨 색깔
        linespacing=2, # 줄간격
        backgroundcolor='lightgray', # 배경색
        alpha=0.5 # 투명도
       )
Alignment
- 정렬 관련 조정 가능 요소
- ha (왼쪽 오른쪽 정렬)
- va (위아래 정렬)
- rotation (회전)
- multialignment
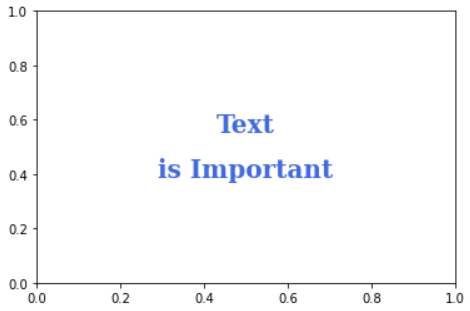
Code
ax.text(x=0.5, y=0.5, s='Text\nis Important',
        fontsize=20,
        fontweight='bold',
        fontfamily='serif',
        color='royalblue',
        linespacing=2,
        va='center', # top, bottom, center
        ha='center', # left, right, center
        rotation='horizontal' # horizontal, vertical 혹은 각도
       )
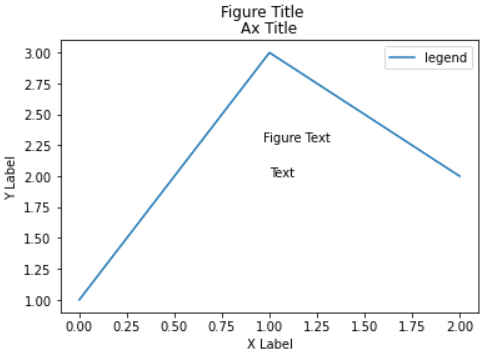
bbox
- 각 모양 bbox 그리는 법
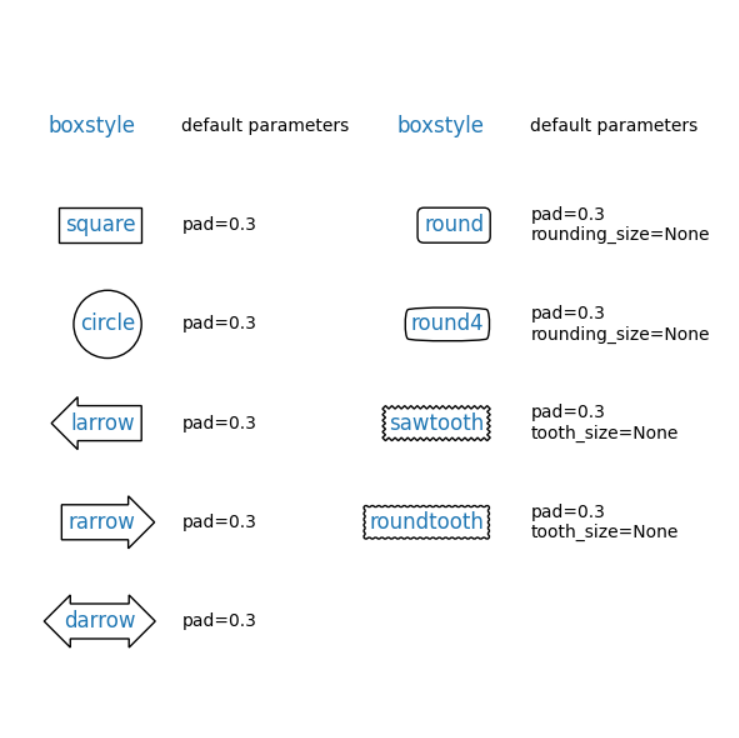
출처 : https://matplotlib.org/stable/gallery/shapes_and_collections/fancybox_demo.html
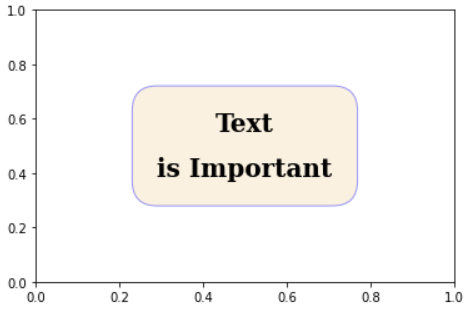
Code
ax.text(x=0.5, y=0.5, s='Text\nis Important',
        fontsize=20,
        fontweight='bold',
        fontfamily='serif',
        color='black',
        linespacing=2,
        va='center', # top, bottom, center
        ha='center', # left, right, center
        rotation='horizontal', # horizontal, vertical 혹은 각도
        bbox=dict(boxstyle='round', facecolor='wheat', ec = 'blue' ,
                  pad = 1, alpha=0.4) # background와 비슷
       )
추가 Text API
Title & Legend
- 제목 위치 조정
- 범례에 제목, 그림자 추가, 위치 조정
Ticks & Text
- tick을 없애거나 조정
- text alignment
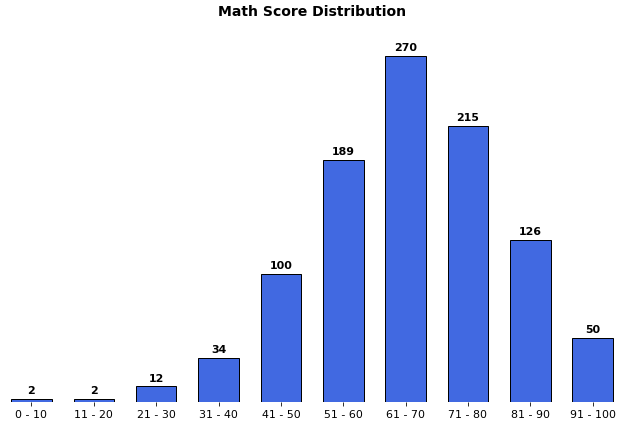
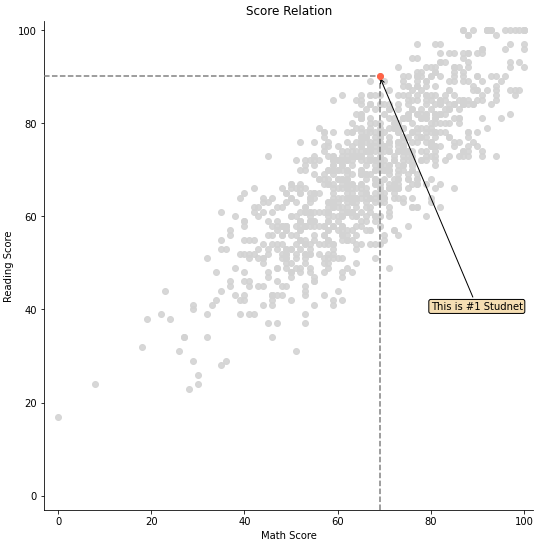
Annotate
- 화살표 사용해서 설명 추가