- Facet이란 분할을 의미하는데, 화면 상의 View를 분할 및 추가하여 다양한 관점을 전달한다.
- 같은 데이터셋에 대해 서로 다른 인코딩을 통해 다른 인사이트를 보여 줄 수 있다. ex) 같은 데이터셋에 대해 막대 그래프와 도넛 차트 비교
- 같은 방법으로 동시에 여러 feature를 보거나 큰 틀에서 볼 수 없는 부분 집합을 세세하게 보여줄 수 있다.
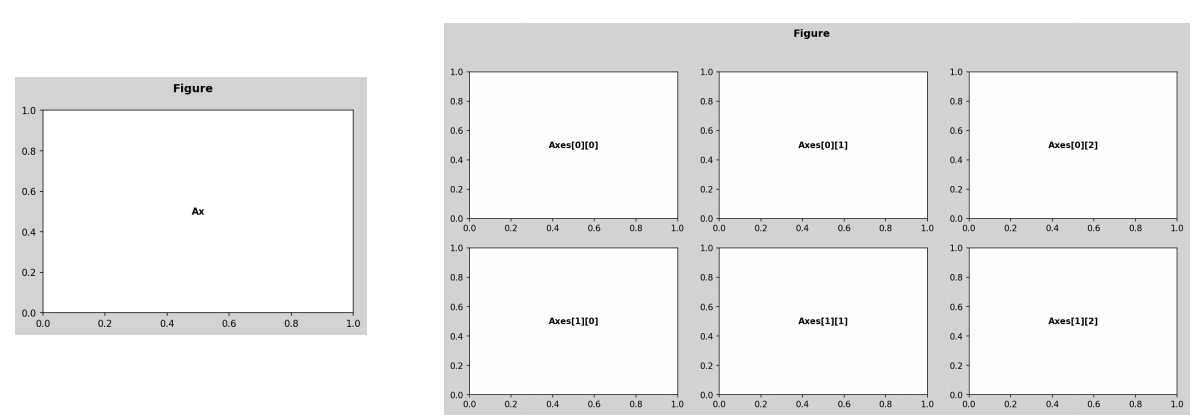
Figure & Axes
- Figure는 큰 틀, Ax는 각 플롯이 들어가는 공간
subplot을 그리는 방법
- plt.subplot()
- plt.figure() + fig.add_subplot()
- plt.subplots()
- ax 리스트는 numpy ndarray로 전달
- 1 x 1 : 객체 1개
- 1 x N 또는 N x 1 : 길이 N 배열(axes[i])
- N x M : N by M 배열(axes[i][k])
쉽게 조정할 수 있는 요소
- figuresize
- dpi
-
인치에 해당하는 dot 수를 정하는 인자로 해상도를 의미
fig = plt.figure(dpi=150)
ax1 = fig.add_subplot(121)
ax2 = fig.add_subplot(122)
ax1.plot([1, 2, 3], [1, 4, 9])
ax2.plot([1, 2, 3], [1, 2, 3])
plt.show()
-
- sharex, sharey
-
동일한 그래프를 여러개를 그리게 되면 축이 여러개로 바뀔 수 있기 때문에, sharex와 sharey를 통해 축을 공유함으로써 시각적으로 강조
# add_subplot 방법
fig = plt.figure()
ax1 = fig.add_subplot(121)
ax1.plot([1, 2, 3], [1, 4, 9])
ax2 = fig.add_subplot(122, sharey=ax1)
ax2.plot([1, 2, 3], [1, 2, 3])
plt.show()

# subplots 방법
fig, axes = plt.subplots(1, 2, sharey=True)

axes[0].plot([1, 2, 3], [1, 4, 9])
axes[1].plot([1, 2, 3], [1, 2, 3])
plt.show()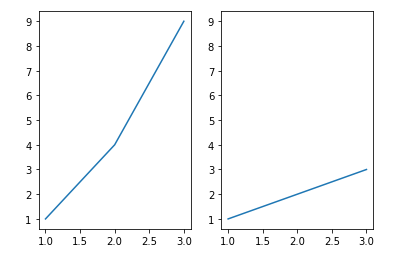
-
- squeeze
-
N x M 차원이 있을 때 N이 1차원인 경우 2차원의 반복문을 사용할 수 없을 때 squeeze를 이용해 2차원으로 만들 수 있다.
-
squeeze는 항상 2차원으로 배열을 받을 수 있다.
-
만약 n=2, m=3 일 때 1중 반복문을 사용하고 싶으면 axes.flatten()을 통해 1차원으로 풀어주어야 가능하다
n, m = 1, 3

# squeeze 부분을 생략하면 n=1이기 때문에 error 발생!
fig, axes = plt.subplots(n, m, squeeze=False, figsize=(m*2, n*2))
idx = 0
# 2중 반복문 사용
for i in range(n):
    for j in range(m):
        axes[i][j].set_title(idx)
        axes[i][j].set_xticks([])
        axes[i][j].set_yticks([])
        idx+=1

plt.show()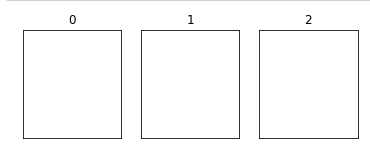
-
- aspect
-
비율을 의미하며, 각각의 subplot 비율을 조정할 수 있다.
fig = plt.figure(figsize=(12, 5))
ax1 = fig.add_subplot(121, aspect=1)
ax2 = fig.add_subplot(122, aspect=0.5)
plt.show()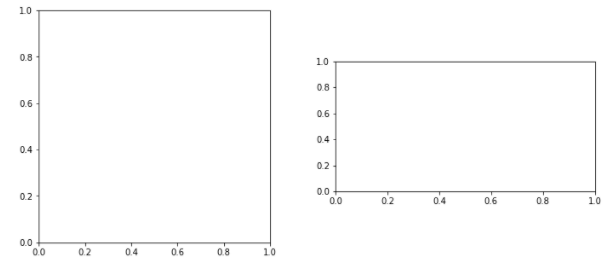
-
Grid Spec
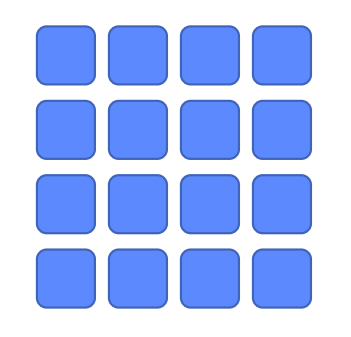
- Grid 형태의 subplots
- 아래의 사진 처럼 기존 subplots로 4x4를 만들 수 있다.
- fig.add_grid_spec()
-
subplot들을 묶어서 사용하고 싶은 경우 Slicing을 통해 표현할 수 있다.
fig = plt.figure(figsize=(8, 5))

gs = fig.add_gridspec(3, 3) # make 3 by 3 grid (row, col)

ax = [None for _ in range(5)]

ax[0] = fig.add_subplot(gs[0, :])
ax[0].set_title('gs[0, :]')

ax[1] = fig.add_subplot(gs[1, :-1])
ax[1].set_title('gs[1, :-1]')

ax[2] = fig.add_subplot(gs[1:, -1])
ax[2].set_title('gs[1:, -1]')

ax[3] = fig.add_subplot(gs[-1, 0])
ax[3].set_title('gs[-1, 0]')

ax[4] = fig.add_subplot(gs[-1, -2])
ax[4].set_title('gs[-1, -2]')

for ix in range(5):
    ax[ix].set_xticks([])
    ax[ix].set_yticks([])

plt.tight_layout()
plt.show()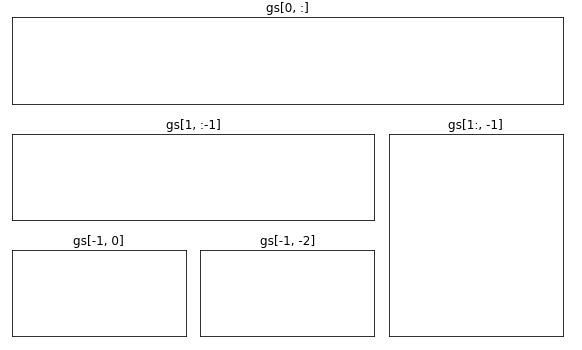
-
- fig.subplot2grid()
-
마찬가지로 subplot들을 묶어서 사용하고 싶은 경우 (x,y), (dx,dy)를 통해 표현할 수 있다.
-
이 방법은 시작점과 끝점, 몇 칸을 쪼개야 하는지를 지정해 주어야 하기 때문에 add_gridspec를 선호
fig = plt.figure(figsize=(8, 5))

ax = [None for _ in range(6)]

#
ax[0] = plt.subplot2grid((3,4), (0,0), colspan=4)
ax[1] = plt.subplot2grid((3,4), (1,0), colspan=1)
ax[2] = plt.subplot2grid((3,4), (1,1), colspan=1)
ax[3] = plt.subplot2grid((3,4), (1,2), colspan=1)
ax[4] = plt.subplot2grid((3,4), (1,3), colspan=1,rowspan=2)
ax[5] = plt.subplot2grid((3,4), (2,0), colspan=3)

for ix in range(6):
    ax[ix].set_title('ax[{}]'.format(ix))
    ax[ix].set_xticks([])
    ax[ix].set_yticks([])

fig.tight_layout()
plt.show()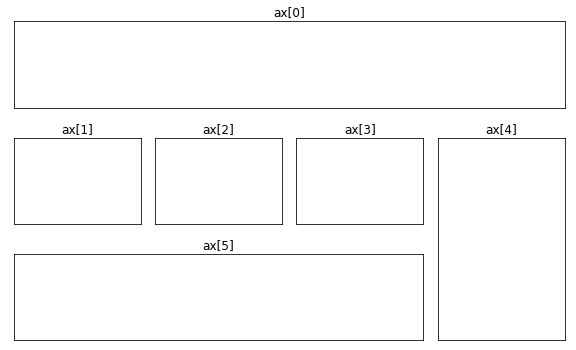
-
- ax.add_axes
-
특정 플롯을 임의의 위치에 만드는 메소드
-
원하는 위치를 조정하여 그래프를 그리는게 쉽지 않기 때문에 추천하지 않는다.
fig = plt.figure(figsize=(8, 5))

ax = [None for _ in range(3)]

ax[0] = fig.add_axes([0.1,0.1,0.8,0.4])
ax[1] = fig.add_axes([0.15,0.6,0.25,0.6])
ax[2] = fig.add_axes([0.5,0.6,0.4,0.3])

for ix in range(3):
    ax[ix].set_title('ax[{}]'.format(ix))
    ax[ix].set_xticks([])
    ax[ix].set_yticks([])

plt.show()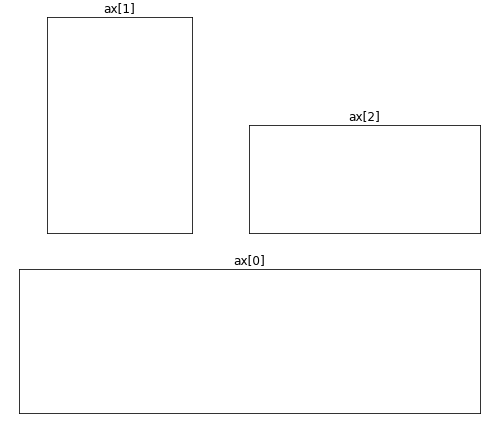
-
-
ax.insert_axes
-
미니맵 형태나 정말 부분적인 plot을 추가할 때 사용
-
표현하고자 하는 메인시각화를 해치지 않는 선에서 사용하는 것을 추천
fig, ax = plt.subplots()
axin = ax.inset_axes([0.8, 0.8, 0.2, 0.2])
plt.show()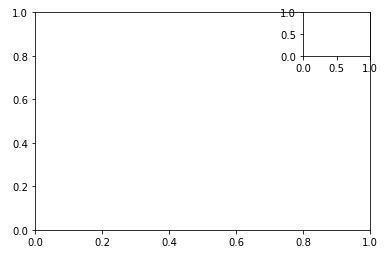
-
-
make_axes_locatable(ax)
-
사방의 원하는 부분에 axes를 추가로 붙일 때 사용
from mpl_toolkits.axes_grid1.axes_divider import make_axes_locatable

fig, ax = plt.subplots(1, 1)
ax_divider = make_axes_locatable(ax)

ax = ax_divider.append_axes("right", size="7%", pad="2%")
plt.show()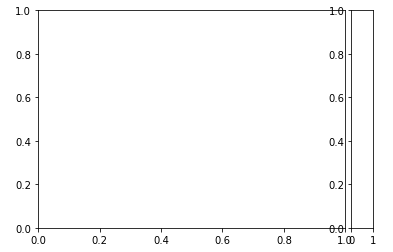
-
